Duke Systems Services and Scale Jeff Chase Duke

- Slides: 75

Duke Systems Services and Scale Jeff Chase Duke University

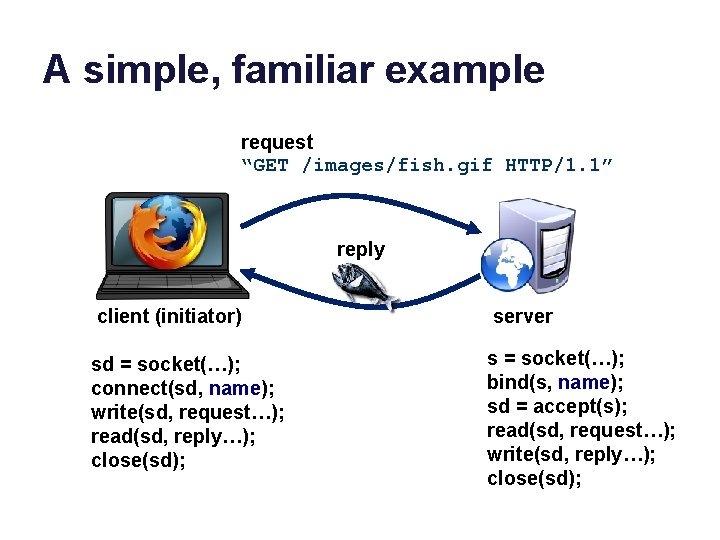
A simple, familiar example request “GET /images/fish. gif HTTP/1. 1” reply client (initiator) server sd = socket(…); connect(sd, name); write(sd, request…); read(sd, reply…); close(sd); s = socket(…); bind(s, name); sd = accept(s); read(sd, request…); write(sd, reply…); close(sd);

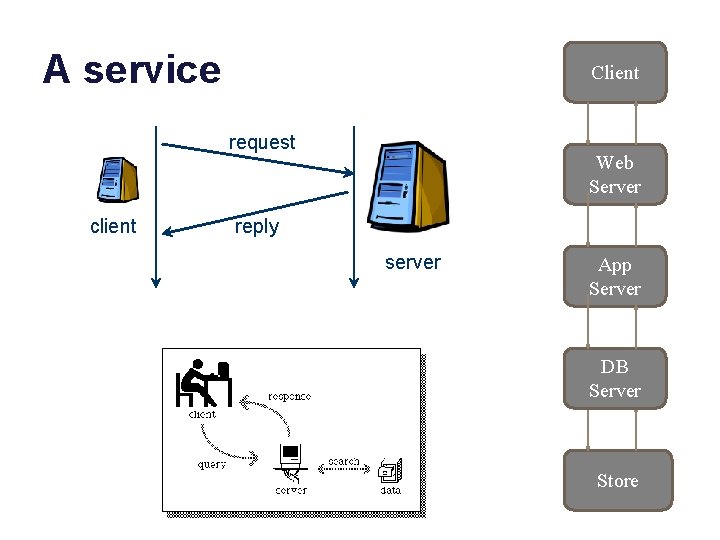
A service Client request client Web Server reply server App Server DB Server Store

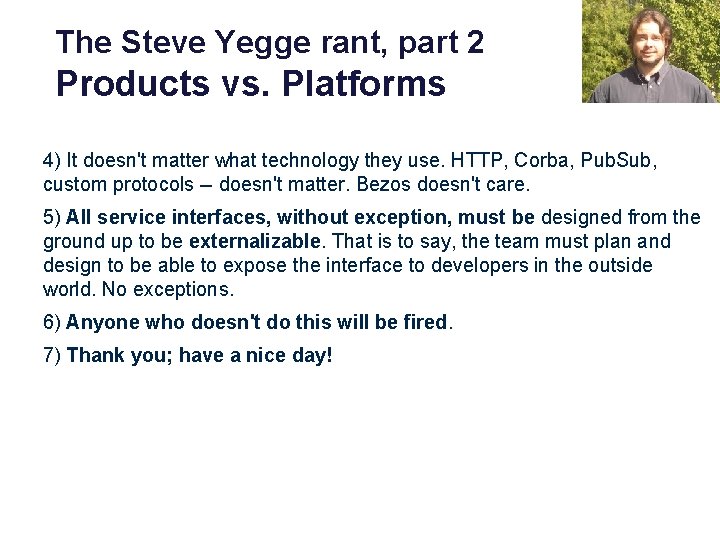
The Steve Yegge rant, part 1 Products vs. Platforms Selectively quoted/clarified from http: //steverant. pen. io/, emphasis added. This is an internal google memorandum that ”escaped”. Yegge had moved to Google from Amazon. His goal was to promote service-oriented software structures within Google. So one day Jeff Bezos [CEO of Amazon] issued a mandate. . [to the developers in his company]: His Big Mandate went something along these lines: 1) All teams will henceforth expose their data and functionality through service interfaces. 2) Teams must communicate with each other through these interfaces. 3) There will be no other form of interprocess communication allowed: no direct linking, no direct reads of another team's data store, no sharedmemory model, no back-doors whatsoever. The only communication allowed is via service interface calls over the network.

The Steve Yegge rant, part 2 Products vs. Platforms 4) It doesn't matter what technology they use. HTTP, Corba, Pub. Sub, custom protocols -- doesn't matter. Bezos doesn't care. 5) All service interfaces, without exception, must be designed from the ground up to be externalizable. That is to say, the team must plan and design to be able to expose the interface to developers in the outside world. No exceptions. 6) Anyone who doesn't do this will be fired. 7) Thank you; have a nice day!

Saa. S platforms New! $10! • A study of Saa. S application frameworks is a topic in itself. • Rests on material in this course • We’ll cover the basics – Internet/web systems and core distributed systems material • But we skip the practical details on specific frameworks. – Ruby on Rails, Django, etc. Web/Saa. S/cloud http: //saasbook. info • Recommended: Berkeley MOOC – Fundamentals of Web systems and cloudbased service deployment. – Examples with Ruby on Rails

Server performance • How many clients can the server handle? • What happens to performance as we increase the number of clients? • What do we do when there are too many clients?

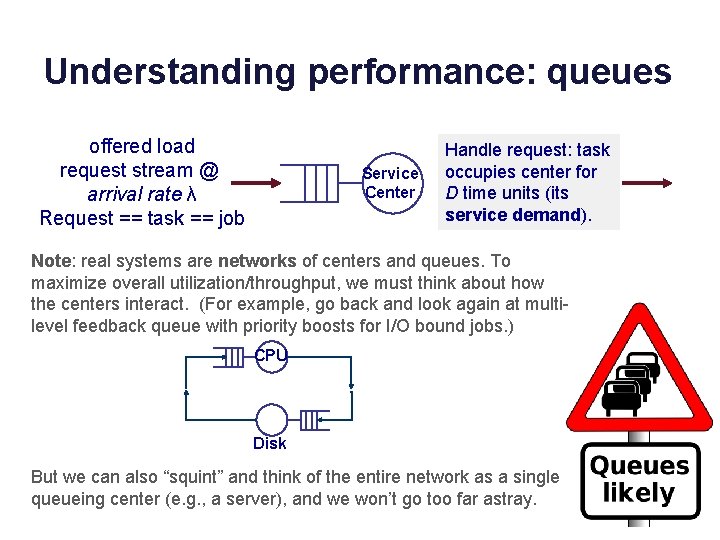
Understanding performance: queues offered load request stream @ arrival rate λ Request == task == job Service Center Handle request: task occupies center for D time units (its service demand). Note: real systems are networks of centers and queues. To maximize overall utilization/throughput, we must think about how the centers interact. (For example, go back and look again at multilevel feedback queue with priority boosts for I/O bound jobs. ) CPU Disk But we can also “squint” and think of the entire network as a single queueing center (e. g. , a server), and we won’t go too far astray.

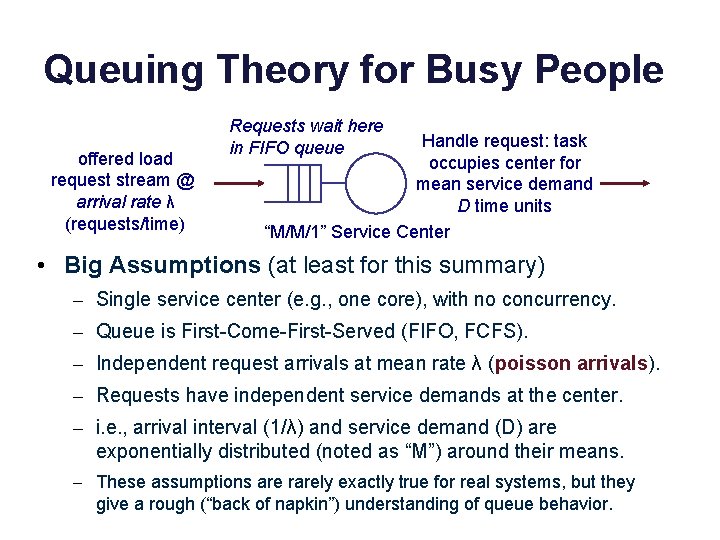
Queuing Theory for Busy People offered load request stream @ arrival rate λ (requests/time) Requests wait here in FIFO queue Handle request: task occupies center for mean service demand D time units “M/M/1” Service Center • Big Assumptions (at least for this summary) – Single service center (e. g. , one core), with no concurrency. – Queue is First-Come-First-Served (FIFO, FCFS). – Independent request arrivals at mean rate λ (poisson arrivals). – Requests have independent service demands at the center. – i. e. , arrival interval (1/λ) and service demand (D) are exponentially distributed (noted as “M”) around their means. – These assumptions are rarely exactly true for real systems, but they give a rough (“back of napkin”) understanding of queue behavior.

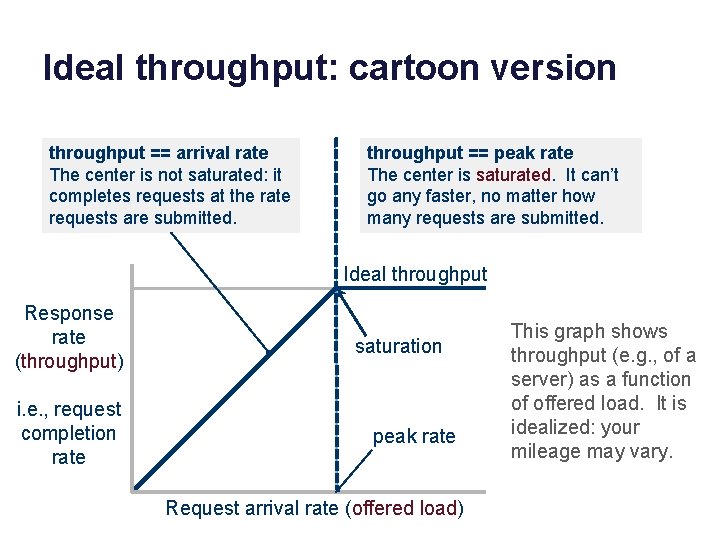
Ideal throughput: cartoon version throughput == arrival rate The center is not saturated: it completes requests at the rate requests are submitted. throughput == peak rate The center is saturated. It can’t go any faster, no matter how many requests are submitted. Ideal throughput Response rate (throughput) i. e. , request completion rate saturation peak rate Request arrival rate (offered load) This graph shows throughput (e. g. , of a server) as a function of offered load. It is idealized: your mileage may vary.

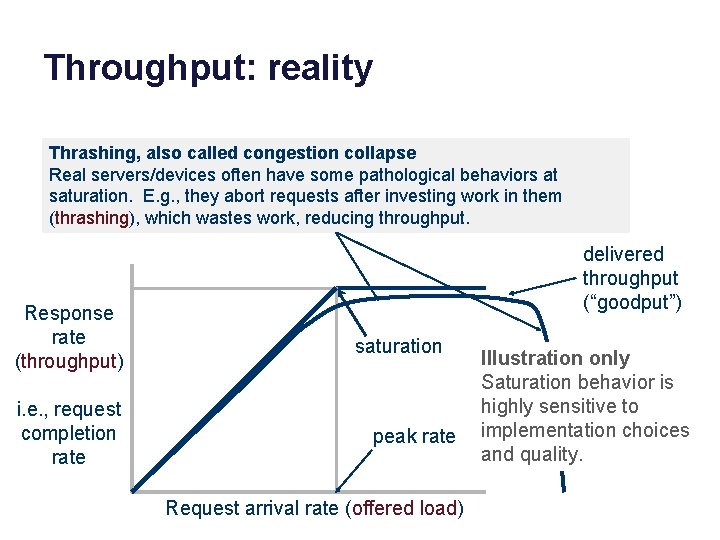
Throughput: reality Thrashing, also called congestion collapse Real servers/devices often have some pathological behaviors at saturation. E. g. , they abort requests after investing work in them (thrashing), which wastes work, reducing throughput. Response rate (throughput) i. e. , request completion rate delivered throughput (“goodput”) saturation peak rate Request arrival rate (offered load) Illustration only Saturation behavior is highly sensitive to implementation choices and quality.

Utilization • What is the probability that the center is busy? – Answer: some number between 0 and 1. • What percentage of the time is the center busy? – Answer: some number between 0 and 100 • These are interchangeable: called utilization U • The probability that the service center is idle is 1 -U

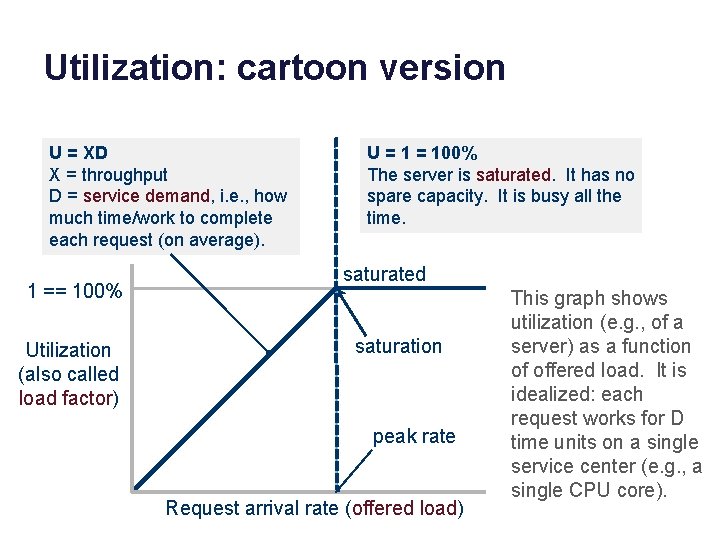
Utilization: cartoon version U = XD X = throughput D = service demand, i. e. , how much time/work to complete each request (on average). 1 == 100% Utilization (also called load factor) U = 100% The server is saturated. It has no spare capacity. It is busy all the time. saturated saturation peak rate Request arrival rate (offered load) This graph shows utilization (e. g. , of a server) as a function of offered load. It is idealized: each request works for D time units on a single service center (e. g. , a single CPU core).

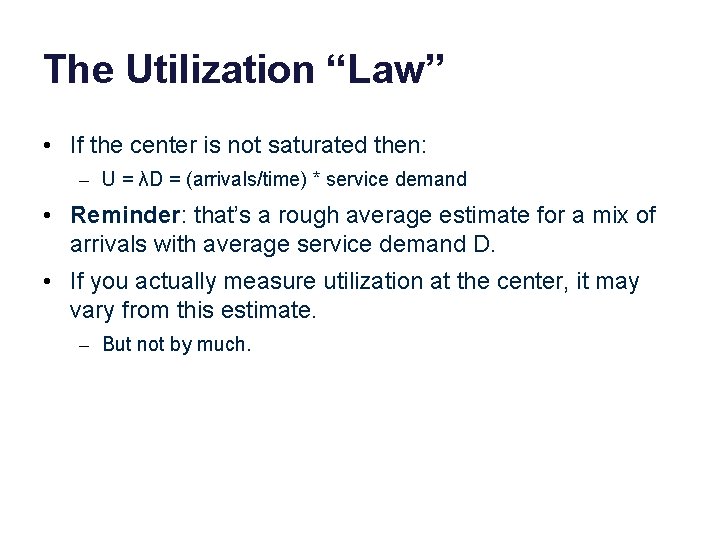
The Utilization “Law” • If the center is not saturated then: – U = λD = (arrivals/time) * service demand • Reminder: that’s a rough average estimate for a mix of arrivals with average service demand D. • If you actually measure utilization at the center, it may vary from this estimate. – But not by much.

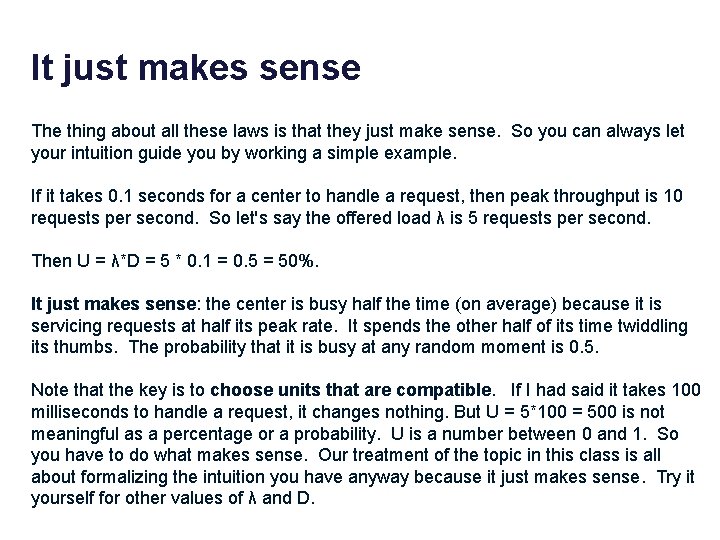
It just makes sense The thing about all these laws is that they just make sense. So you can always let your intuition guide you by working a simple example. If it takes 0. 1 seconds for a center to handle a request, then peak throughput is 10 requests per second. So let's say the offered load λ is 5 requests per second. Then U = λ*D = 5 * 0. 1 = 0. 5 = 50%. It just makes sense: the center is busy half the time (on average) because it is servicing requests at half its peak rate. It spends the other half of its time twiddling its thumbs. The probability that it is busy at any random moment is 0. 5. Note that the key is to choose units that are compatible. If I had said it takes 100 milliseconds to handle a request, it changes nothing. But U = 5*100 = 500 is not meaningful as a percentage or a probability. U is a number between 0 and 1. So you have to do what makes sense. Our treatment of the topic in this class is all about formalizing the intuition you have anyway because it just makes sense. Try it yourself for other values of λ and D.

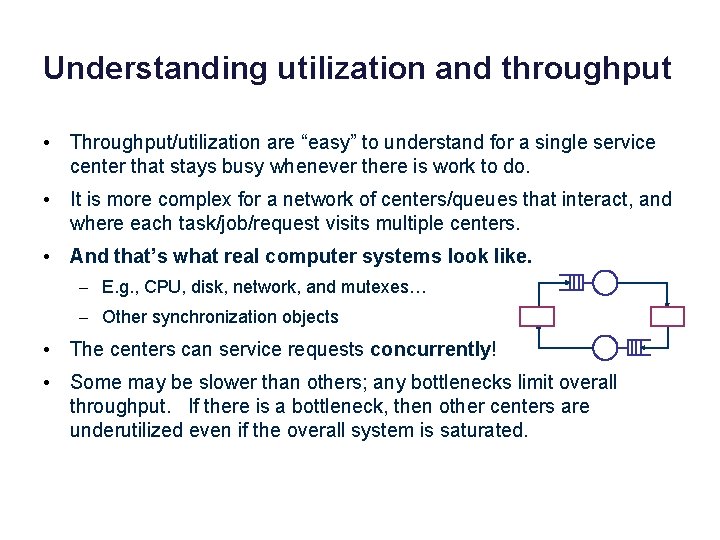
Understanding utilization and throughput • Throughput/utilization are “easy” to understand for a single service center that stays busy whenever there is work to do. • It is more complex for a network of centers/queues that interact, and where each task/job/request visits multiple centers. • And that’s what real computer systems look like. – E. g. , CPU, disk, network, and mutexes… – Other synchronization objects • The centers can service requests concurrently! • Some may be slower than others; any bottlenecks limit overall throughput. If there is a bottleneck, then other centers are underutilized even if the overall system is saturated.

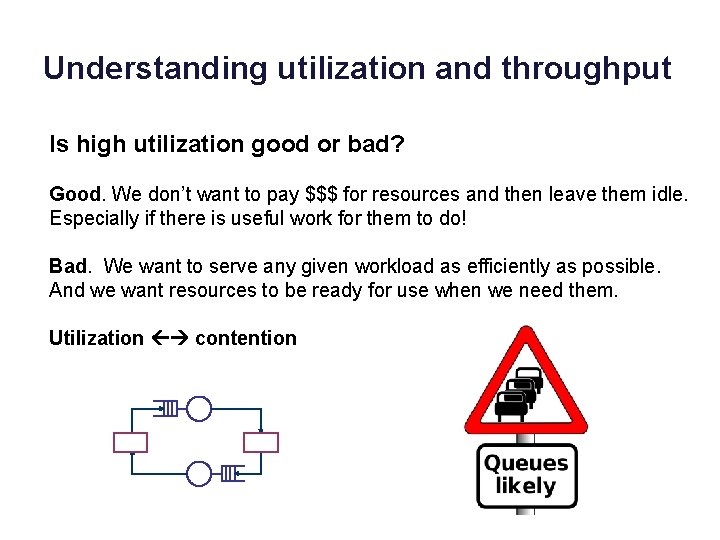
Understanding utilization and throughput Is high utilization good or bad? Good. We don’t want to pay $$$ for resources and then leave them idle. Especially if there is useful work for them to do! Bad. We want to serve any given workload as efficiently as possible. And we want resources to be ready for use when we need them. Utilization contention

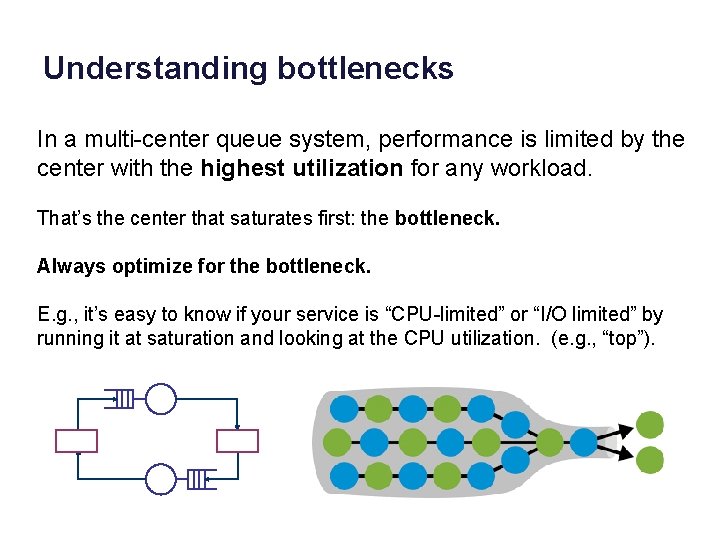
Understanding bottlenecks In a multi-center queue system, performance is limited by the center with the highest utilization for any workload. That’s the center that saturates first: the bottleneck. Always optimize for the bottleneck. E. g. , it’s easy to know if your service is “CPU-limited” or “I/O limited” by running it at saturation and looking at the CPU utilization. (e. g. , “top”).

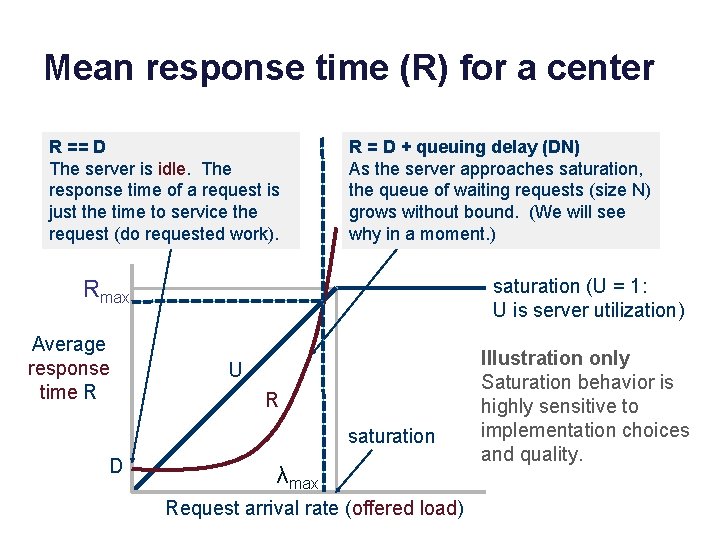
Mean response time (R) for a center R == D The server is idle. The response time of a request is just the time to service the request (do requested work). R = D + queuing delay (DN) As the server approaches saturation, the queue of waiting requests (size N) grows without bound. (We will see why in a moment. ) saturation (U = 1: U is server utilization) Rmax Average response time R U R saturation D λmax Request arrival rate (offered load) Illustration only Saturation behavior is highly sensitive to implementation choices and quality.

Little’s Law For a FIFO/FCFS queue in steady state, mean response time R and mean queue length N are governed by: Little’s Law: N = λR Why? • Suppose a task T is in the system for R time units. • During that time: – λR new tasks arrive (on average) – N tasks depart (all the tasks ahead of T, on average). • But in steady state, the flow in balances flow out. – “Obviously”: throughput X = λ in steady state. Otherwise requests “bottle up” in the server -- not a steady state.

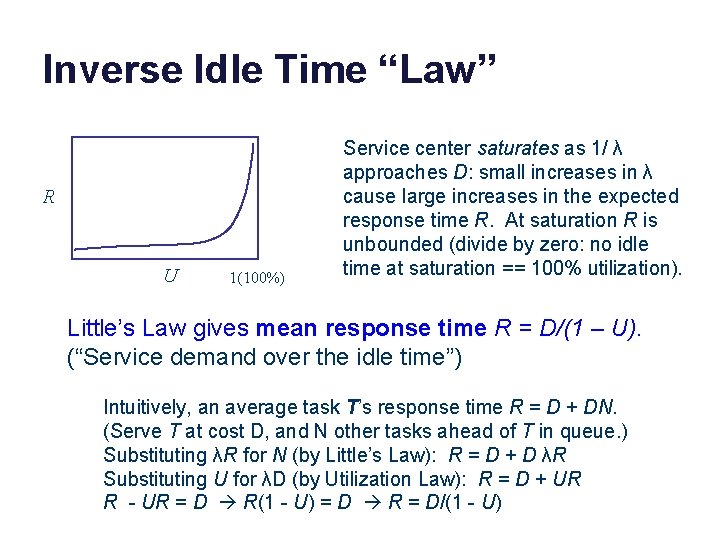
Inverse Idle Time “Law” R U 1(100%) Service center saturates as 1/ λ approaches D: small increases in λ cause large increases in the expected response time R. At saturation R is unbounded (divide by zero: no idle time at saturation == 100% utilization). Little’s Law gives mean response time R = D/(1 – U). (“Service demand over the idle time”) Intuitively, an average task T’s response time R = D + DN. (Serve T at cost D, and N other tasks ahead of T in queue. ) Substituting λR for N (by Little’s Law): R = D + D λR Substituting U for λD (by Utilization Law): R = D + UR R - UR = D R(1 - U) = D R = D/(1 - U)

Why Little’s Law is important 1. Intuitive understanding of FCFS queue behavior. Compute response time from demand parameters (λ, D). Compute N: how much storage is needed for the queue. 2. Notion of a saturated service center. Response times rise rapidly with load and are unbounded. At 50% utilization, a 10% increase in load increases R by 10%. At 90% utilization, a 10% increase in load increases R by 10 x. 3. Basis for predicting performance of queuing networks. Cheap and easy “back of napkin” (rough) estimates of system performance based on observed behavior and proposed changes, e. g. , capacity planning, “what if” questions. Guides intuition even in scenarios where the assumptions of theory are not (exactly) met.

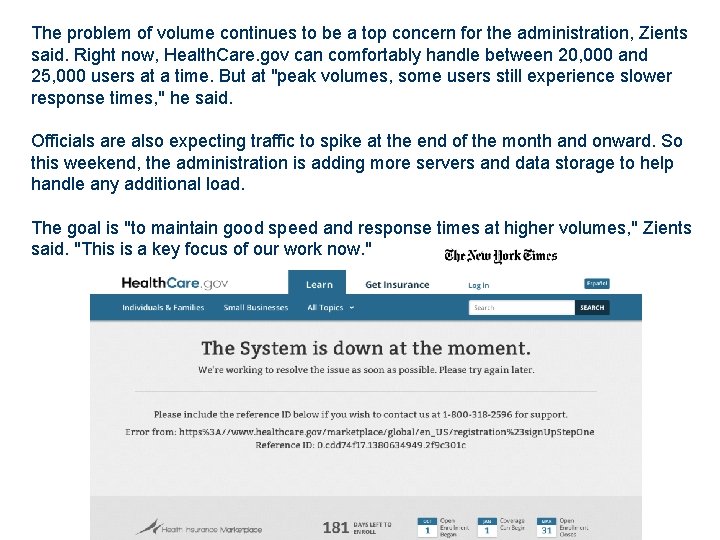
The problem of volume continues to be a top concern for the administration, Zients said. Right now, Health. Care. gov can comfortably handle between 20, 000 and 25, 000 users at a time. But at "peak volumes, some users still experience slower response times, " he said. Officials are also expecting traffic to spike at the end of the month and onward. So this weekend, the administration is adding more servers and data storage to help handle any additional load. The goal is "to maintain good speed and response times at higher volumes, " Zients said. "This is a key focus of our work now. "

Part 2 MANAGING SCALABLE PERFORMANCE

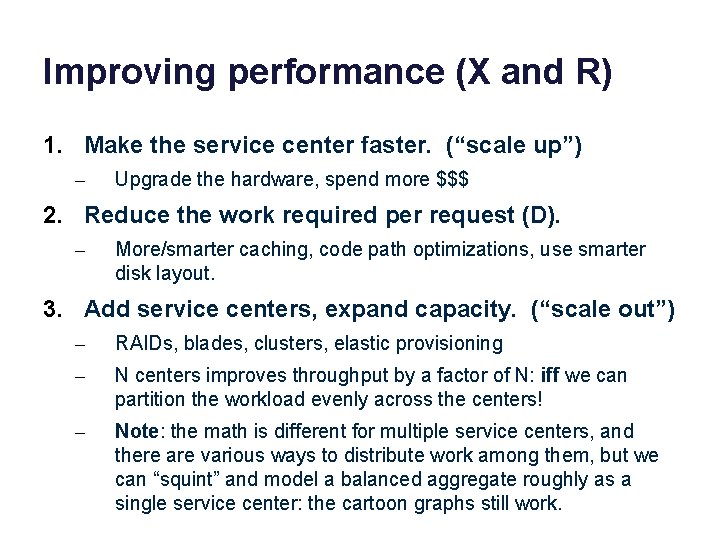
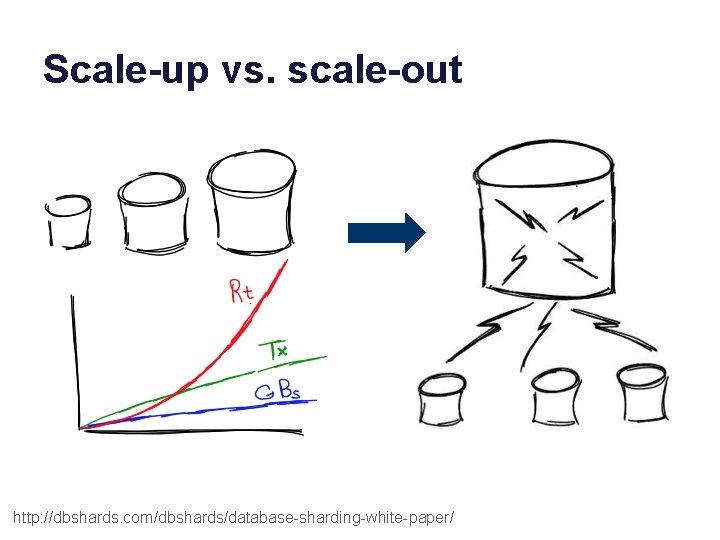
Improving performance (X and R) 1. Make the service center faster. (“scale up”) – Upgrade the hardware, spend more $$$ 2. Reduce the work required per request (D). – More/smarter caching, code path optimizations, use smarter disk layout. 3. Add service centers, expand capacity. (“scale out”) – RAIDs, blades, clusters, elastic provisioning – N centers improves throughput by a factor of N: iff we can partition the workload evenly across the centers! – Note: the math is different for multiple service centers, and there are various ways to distribute work among them, but we can “squint” and model a balanced aggregate roughly as a single service center: the cartoon graphs still work.

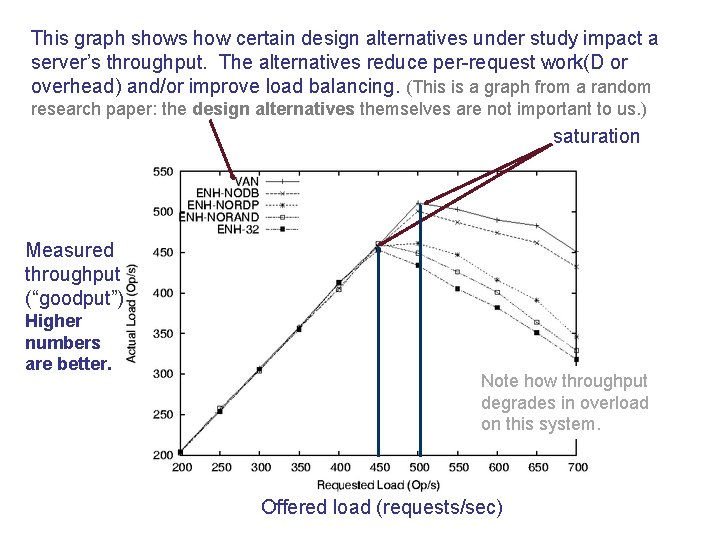
This graph shows how certain design alternatives under study impact a server’s throughput. The alternatives reduce per-request work(D or overhead) and/or improve load balancing. (This is a graph from a random research paper: the design alternatives themselves are not important to us. ) saturation Measured throughput (“goodput”) Higher numbers are better. Note how throughput degrades in overload on this system. Offered load (requests/sec)

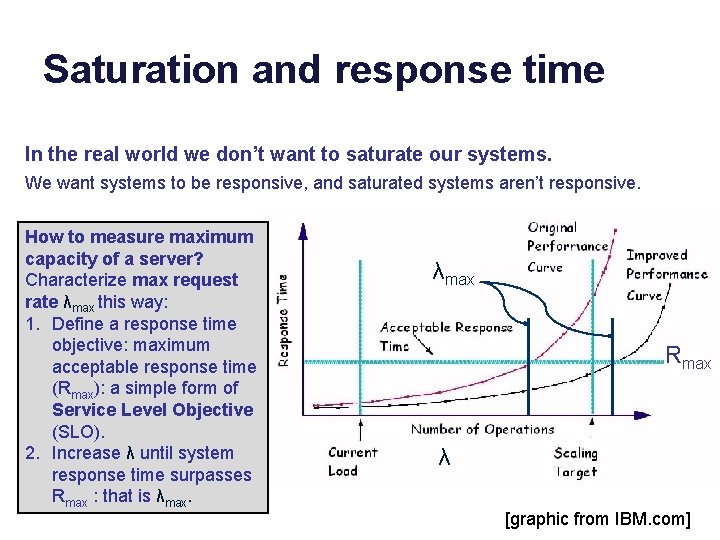
Saturation and response time In the real world we don’t want to saturate our systems. We want systems to be responsive, and saturated systems aren’t responsive. How to measure maximum capacity of a server? Characterize max request rate λmax this way: 1. Define a response time objective: maximum acceptable response time (Rmax): a simple form of Service Level Objective (SLO). 2. Increase λ until system response time surpasses Rmax : that is λmax Rmax λ [graphic from IBM. com]

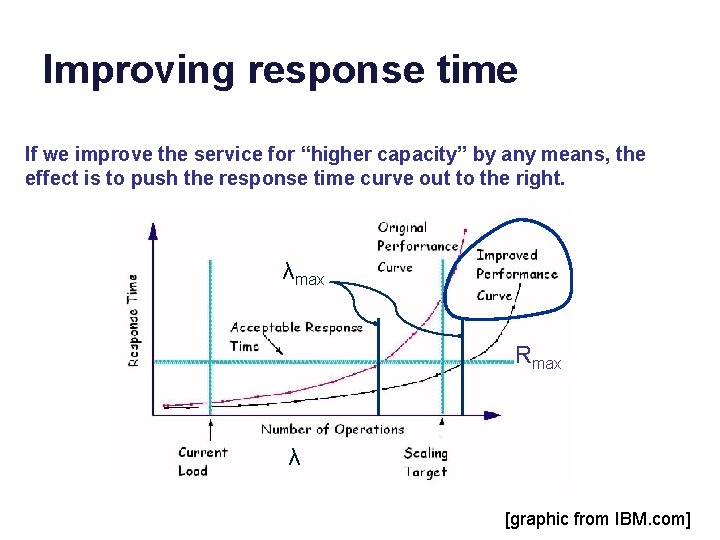
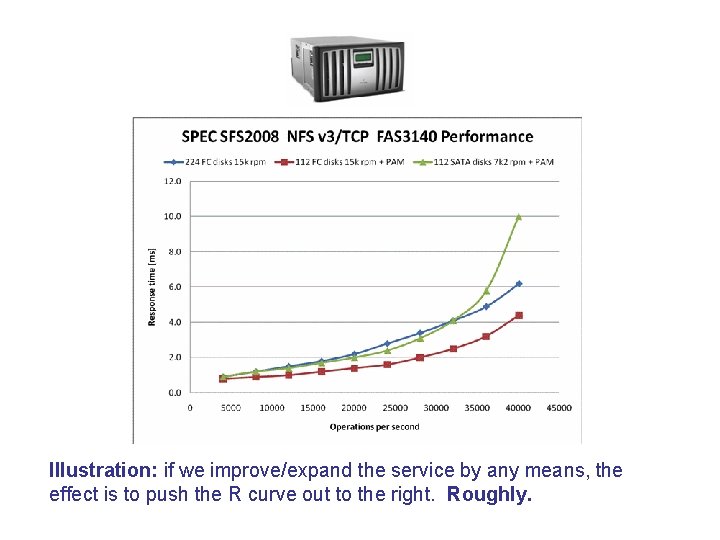
Improving response time If we improve the service for “higher capacity” by any means, the effect is to push the response time curve out to the right. λmax Rmax λ [graphic from IBM. com]

Illustration: if we improve/expand the service by any means, the effect is to push the R curve out to the right. Roughly.

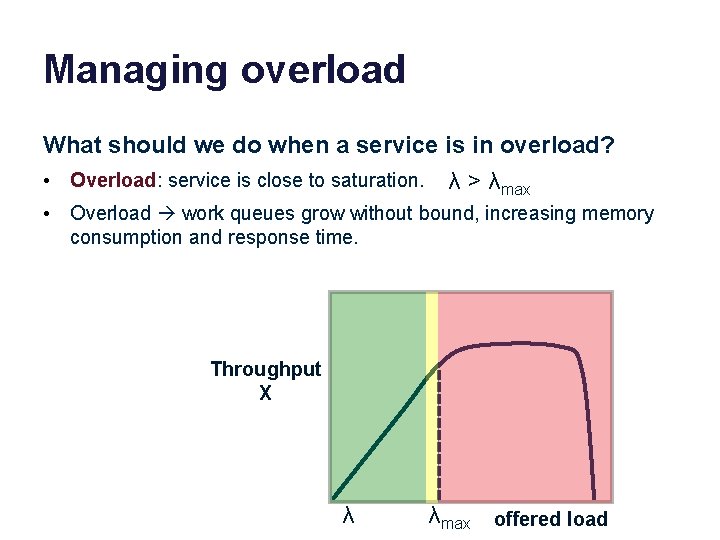
Managing overload What should we do when a service is in overload? • Overload: service is close to saturation. λ > λmax • Overload work queues grow without bound, increasing memory consumption and response time. Throughput X λ λmax offered load

Options for overload 1. Thrashing – Keep trying and hope things get better. Accept each request and inject it into the system. Then drop requests at random if some queue overflows its memory bound. Note: leads to dropping requests after work has been invested, wasting work and reducing throughput (e. g. , “congestion collapse”). 2. Admission control or load conditioning – Reject requests as needed to keep system healthy. Reject them early, before they incur processing costs. Choose your victims carefully, e. g. , prefer “gold” customers, or reject the most expensive requests. 3. Dynamic provisioning or elastic scaling – E. g. , acquire new capacity “on the fly” (e. g. , from a cloud provider), and shift load over to the new capacity.

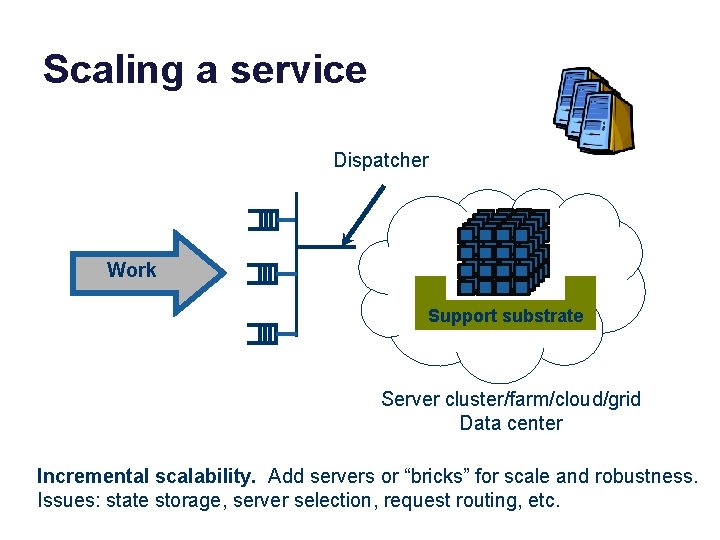
Scaling a service Dispatcher Work Support substrate Server cluster/farm/cloud/grid Data center Incremental scalability. Add servers or “bricks” for scale and robustness. Issues: state storage, server selection, request routing, etc.

Scale-up vs. scale-out http: //dbshards. com/dbshards/database-sharding-white-paper/

Concept: load spreading • Spread (“deal”) the data across a set of storage units. – Make it “look like one big unit”, e. g. , “one big disk”. – Redirect requests for a data item to the right unit. • The concept appears in many different settings/contexts. – We can spread load across many servers too, to make a server cluster look like “one big server”. – We can spread out different data items: objects, records, blocks, chunks, tables, buckets, keys…. – Keep track using maps or a deterministic function (e. g. , a hash). • Also called sharding, declustering, striping, “bricks”.

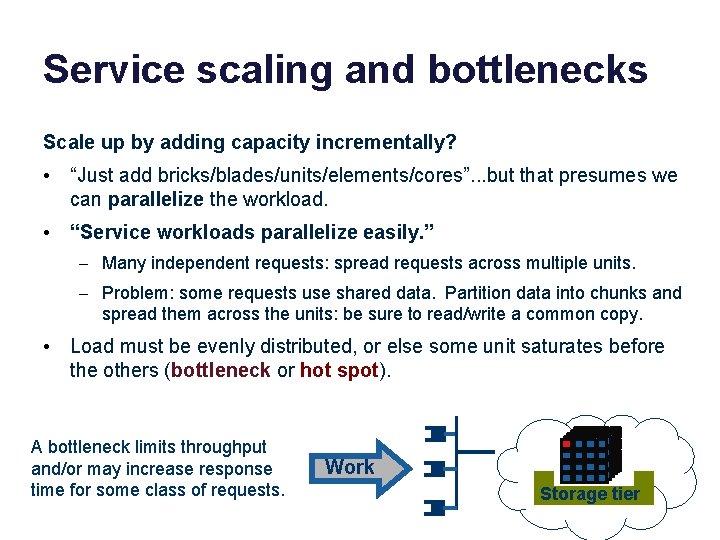
Service scaling and bottlenecks Scale up by adding capacity incrementally? • “Just add bricks/blades/units/elements/cores”. . . but that presumes we can parallelize the workload. • “Service workloads parallelize easily. ” – Many independent requests: spread requests across multiple units. – Problem: some requests use shared data. Partition data into chunks and spread them across the units: be sure to read/write a common copy. • Load must be evenly distributed, or else some unit saturates before the others (bottleneck or hot spot). A bottleneck limits throughput and/or may increase response time for some class of requests. Work Storage tier

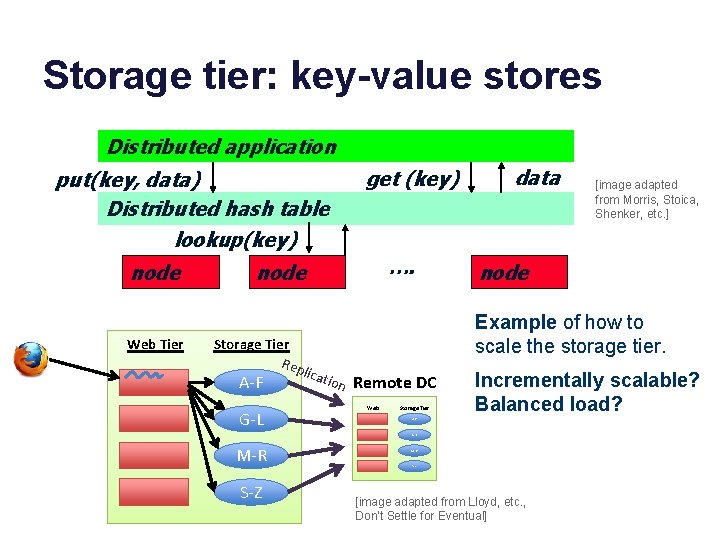
Storage tier: key-value stores Distributed application put(key, data) Distributed hash table lookup(key) node Web Tier get (key) …. node G-L node cati on Remote DC Web Tier Storage Tier Incrementally scalable? Balanced load? A-F G-L M-R S-Z [image adapted from Morris, Stoica, Shenker, etc. ] Example of how to scale the storage tier. Storage Tier Rep li A-F data M-R S-Z [image adapted from Lloyd, etc. , Don’t Settle for Eventual]

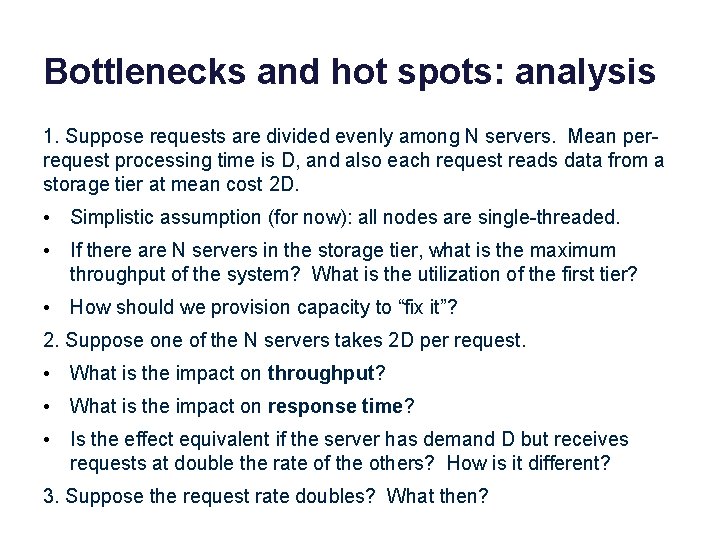
Bottlenecks and hot spots: analysis 1. Suppose requests are divided evenly among N servers. Mean perrequest processing time is D, and also each request reads data from a storage tier at mean cost 2 D. • Simplistic assumption (for now): all nodes are single-threaded. • If there are N servers in the storage tier, what is the maximum throughput of the system? What is the utilization of the first tier? • How should we provision capacity to “fix it”? 2. Suppose one of the N servers takes 2 D per request. • What is the impact on throughput? • What is the impact on response time? • Is the effect equivalent if the server has demand D but receives requests at double the rate of the others? How is it different? 3. Suppose the request rate doubles? What then?

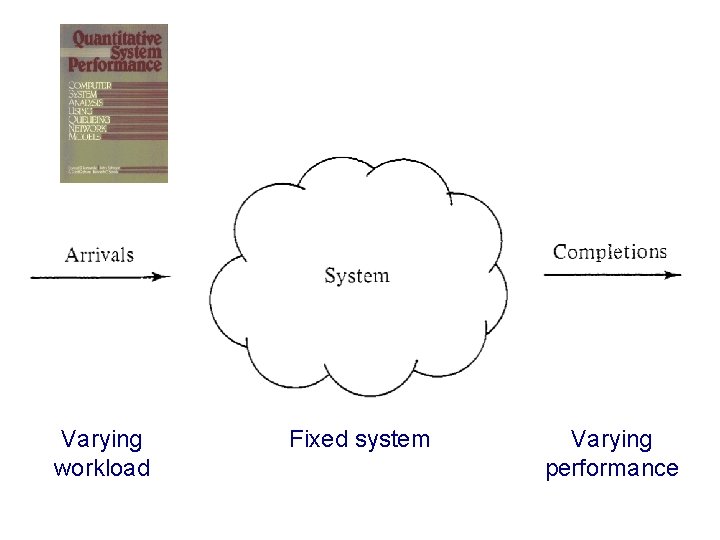
Varying workload Fixed system Varying performance

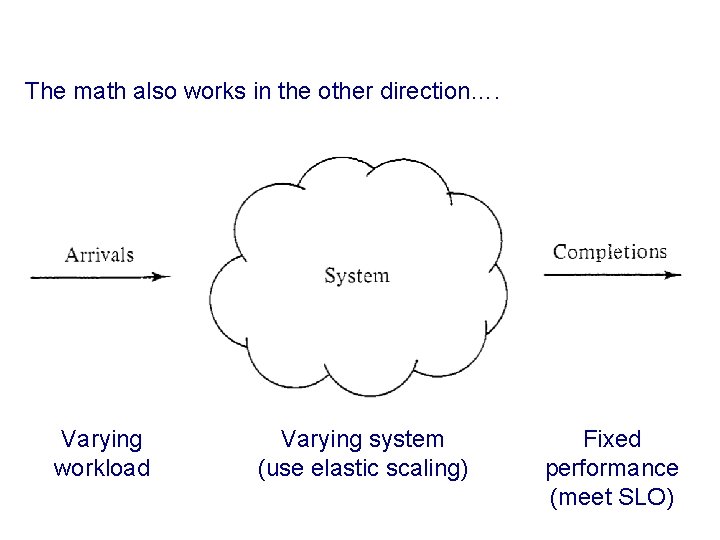
The math also works in the other direction…. Varying workload Varying system (use elastic scaling) Fixed performance (meet SLO)

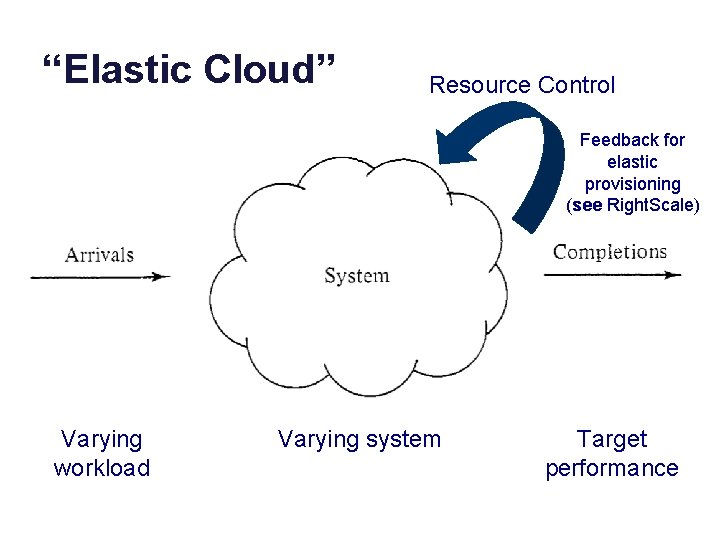
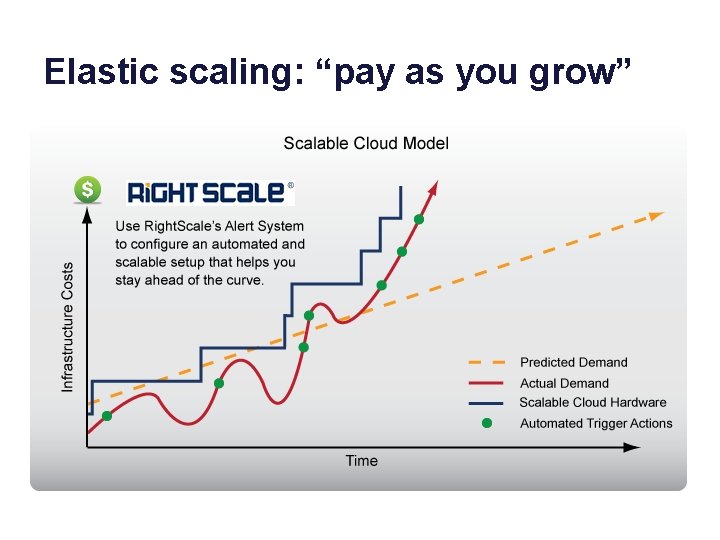
“Elastic Cloud” Resource Control Feedback for elastic provisioning (see Right. Scale) Varying workload Varying system Target performance

Elastic scaling: “pay as you grow”

Elastic scaling: points • What are the “automated triggers” that drive scaling? – Monitor system measures: N, R, U, X (from previous class) – Use models to derive the capacity needed to meet targets • Service Level Objectives or SLO for response time • target average utilization • How to adapt when system is under/overloaded? – Obtain capacity as needed, e. g. , from cloud (“pay as you grow”). – Direct traffic to spread workload across your capacity (servers) as evenly and reliably as you can. (Use some replication. ) – Rebalance on failures or other changes in capacity. – Leave some capacity “headroom” for sudden load spikes. – Watch out for bottlenecks! But how to address them?

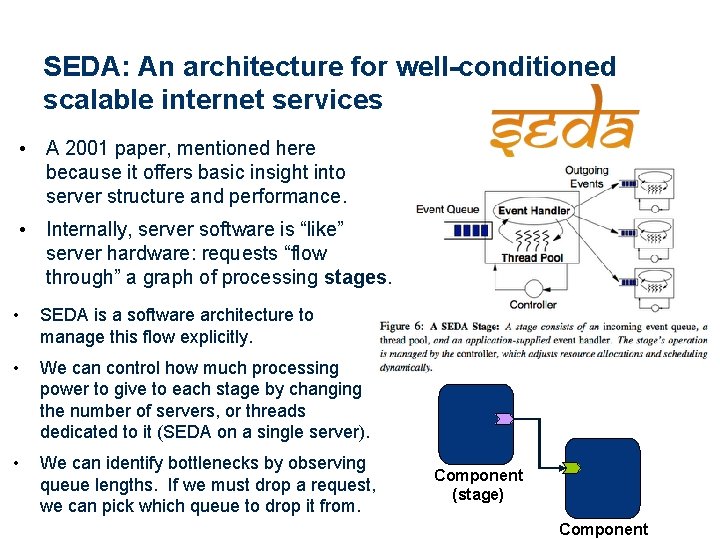
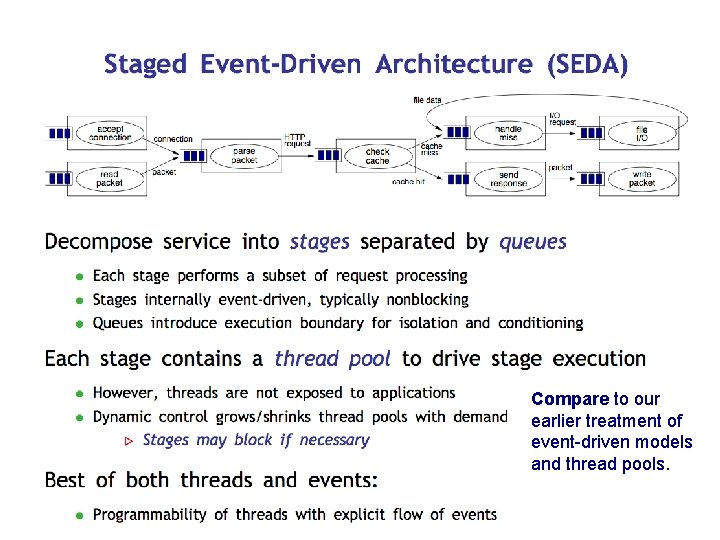
SEDA: An architecture for well-conditioned scalable internet services • A 2001 paper, mentioned here because it offers basic insight into server structure and performance. • Internally, server software is “like” server hardware: requests “flow through” a graph of processing stages. • SEDA is a software architecture to manage this flow explicitly. • We can control how much processing power to give to each stage by changing the number of servers, or threads dedicated to it (SEDA on a single server). • We can identify bottlenecks by observing queue lengths. If we must drop a request, we can pick which queue to drop it from. Component (stage) Component

Compare to our earlier treatment of event-driven models and thread pools.


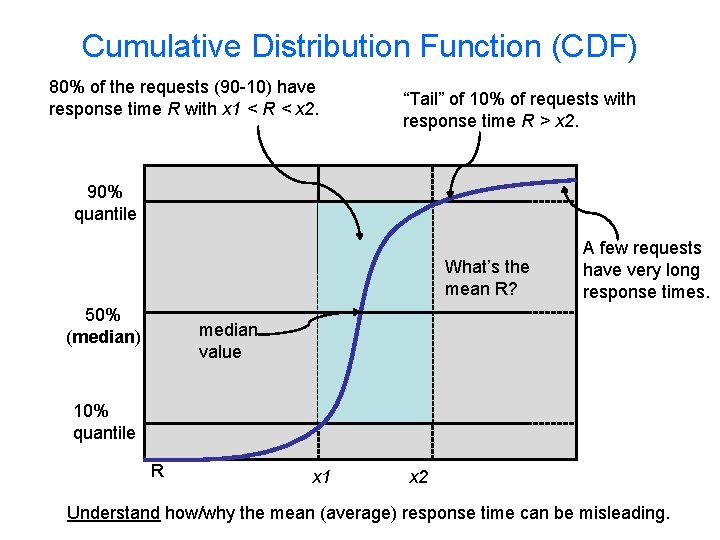
Cumulative Distribution Function (CDF) 80% of the requests (90 -10) have response time R with x 1 < R < x 2. “Tail” of 10% of requests with response time R > x 2. 90% quantile What’s the mean R? 50% (median) A few requests have very long response times. median value 10% quantile R x 1 x 2 Understand how/why the mean (average) response time can be misleading.

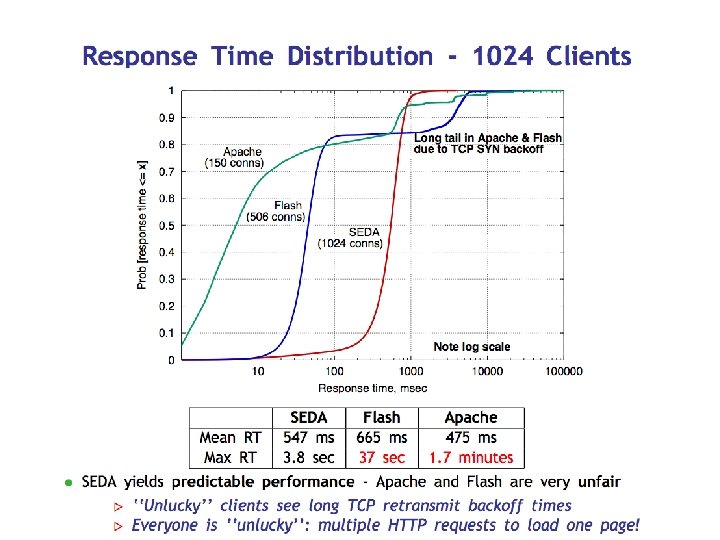
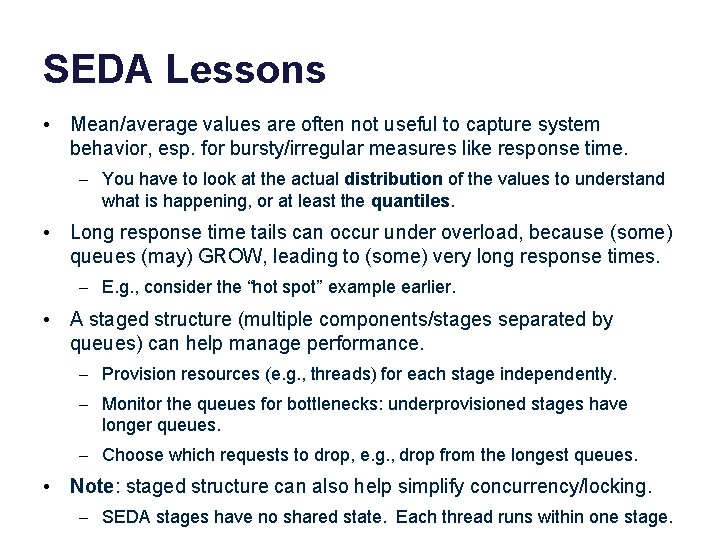
SEDA Lessons • Mean/average values are often not useful to capture system behavior, esp. for bursty/irregular measures like response time. – You have to look at the actual distribution of the values to understand what is happening, or at least the quantiles. • Long response time tails can occur under overload, because (some) queues (may) GROW, leading to (some) very long response times. – E. g. , consider the “hot spot” example earlier. • A staged structure (multiple components/stages separated by queues) can help manage performance. – Provision resources (e. g. , threads) for each stage independently. – Monitor the queues for bottlenecks: underprovisioned stages have longer queues. – Choose which requests to drop, e. g. , drop from the longest queues. • Note: staged structure can also help simplify concurrency/locking. – SEDA stages have no shared state. Each thread runs within one stage.

Part 3 LIMITS OF SCALABLE PERFORMANCE

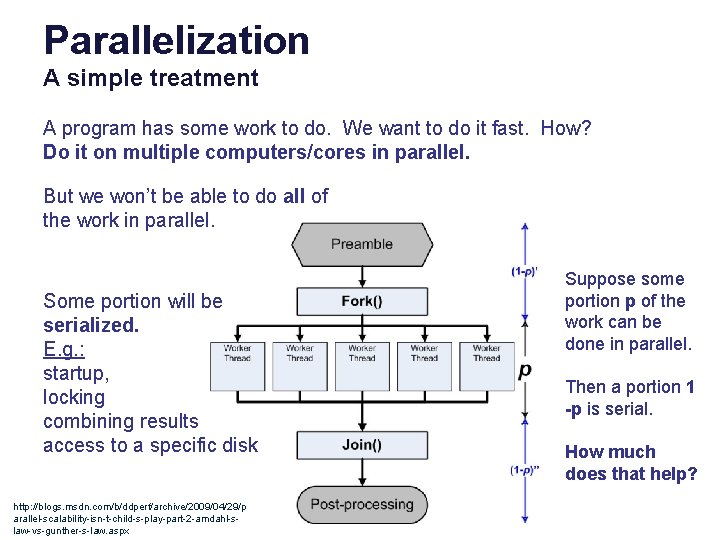
Parallelization A simple treatment A program has some work to do. We want to do it fast. How? Do it on multiple computers/cores in parallel. But we won’t be able to do all of the work in parallel. Some portion will be serialized. E. g. : startup, locking combining results access to a specific disk http: //blogs. msdn. com/b/ddperf/archive/2009/04/29/p arallel-scalability-isn-t-child-s-play-part-2 -amdahl-slaw-vs-gunther-s-law. aspx Suppose some portion p of the work can be done in parallel. Then a portion 1 -p is serial. How much does that help?

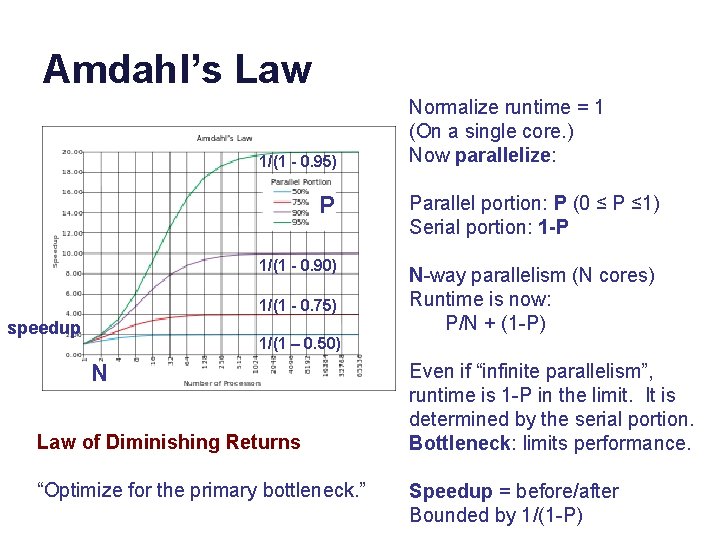
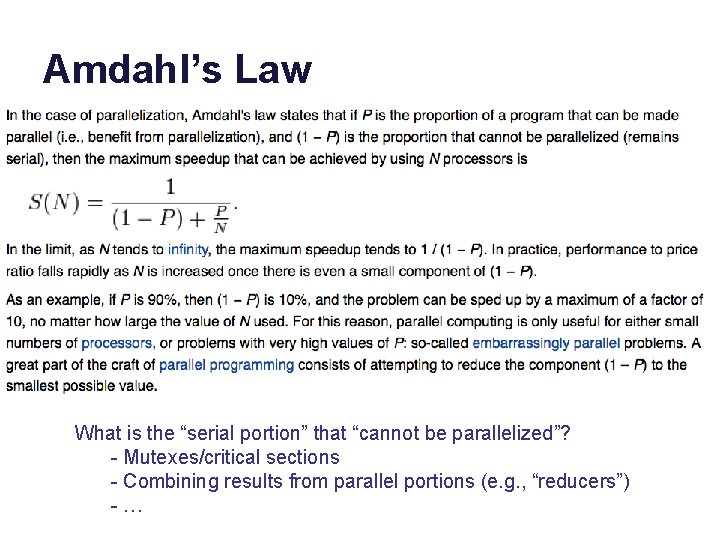
Amdahl’s Law 1/(1 - 0. 95) P 1/(1 - 0. 90) 1/(1 - 0. 75) speedup Normalize runtime = 1 (On a single core. ) Now parallelize: Parallel portion: P (0 ≤ P ≤ 1) Serial portion: 1 -P N-way parallelism (N cores) Runtime is now: P/N + (1 -P) 1/(1 – 0. 50) N Law of Diminishing Returns “Optimize for the primary bottleneck. ” Even if “infinite parallelism”, runtime is 1 -P in the limit. It is determined by the serial portion. Bottleneck: limits performance. Speedup = before/after Bounded by 1/(1 -P)

Amdahl’s Law What is the “serial portion” that “cannot be parallelized”? - Mutexes/critical sections - Combining results from parallel portions (e. g. , “reducers”) - …

“Cloud computing is a model for enabling convenient, ondemand network access to a shared pool of configurable computing resources (e. g. , networks, servers, storage, applications, and services) that can be rapidly provisioned and released with minimal management effort or service provider interaction. ” - US National Institute for Standards and Technology http: //www. csrc. nist. gov/groups/SNS/cloud-computing/ Part 4 VIRTUAL CLOUD HOSTING

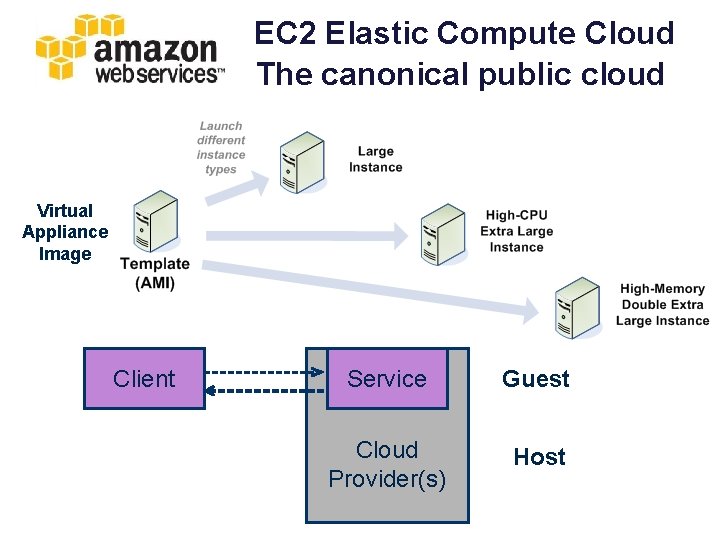
EC 2 Elastic Compute Cloud The canonical public cloud Virtual Appliance Image Client Service Guest Cloud Provider(s) Host


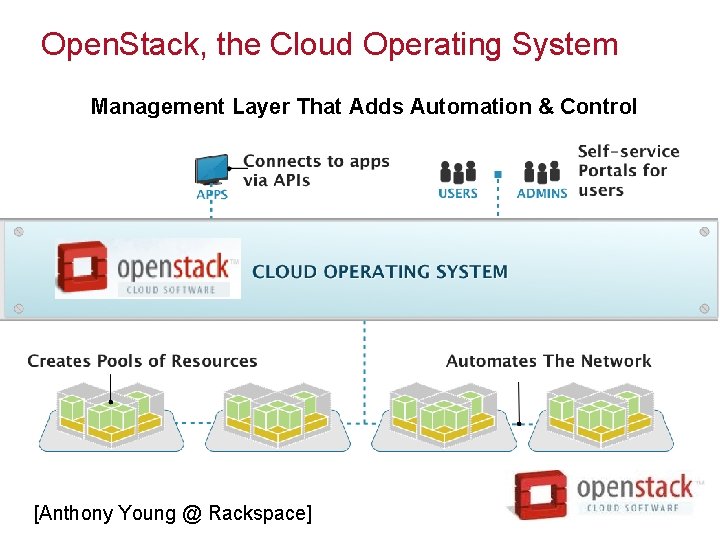
Open. Stack, the Cloud Operating System Management Layer That Adds Automation & Control [Anthony Young @ Rackspace]

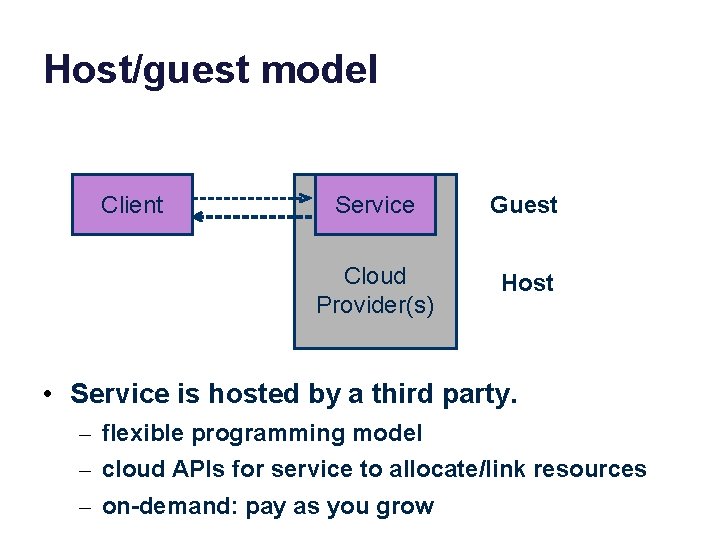
Host/guest model Client Service Guest Cloud Provider(s) Host • Service is hosted by a third party. – flexible programming model – cloud APIs for service to allocate/link resources – on-demand: pay as you grow

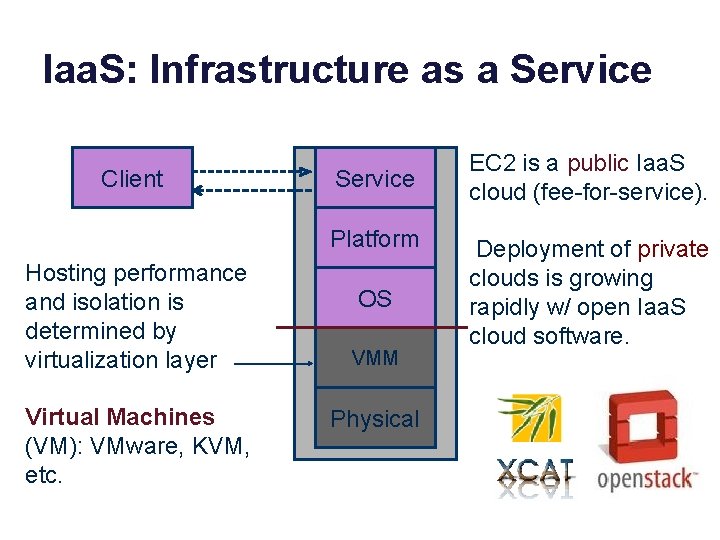
Iaa. S: Infrastructure as a Service Client Service Platform Hosting performance and isolation is determined by virtualization layer Virtual Machines (VM): VMware, KVM, etc. OS VMM Physical EC 2 is a public Iaa. S cloud (fee-for-service). Deployment of private clouds is growing rapidly w/ open Iaa. S cloud software.


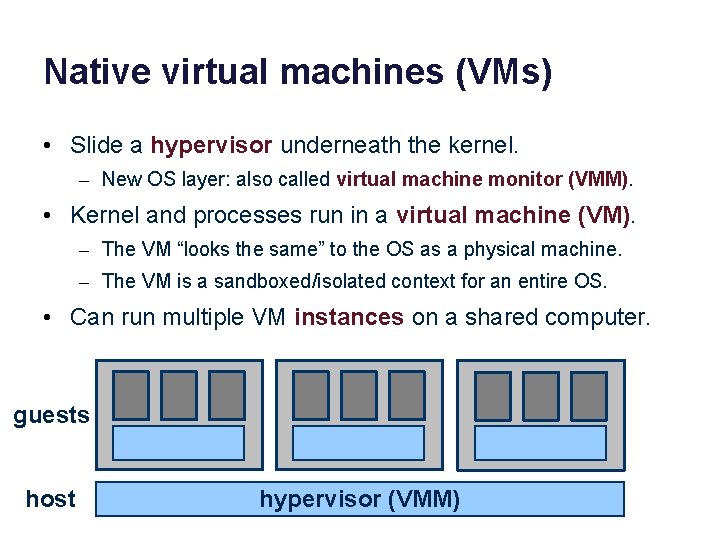
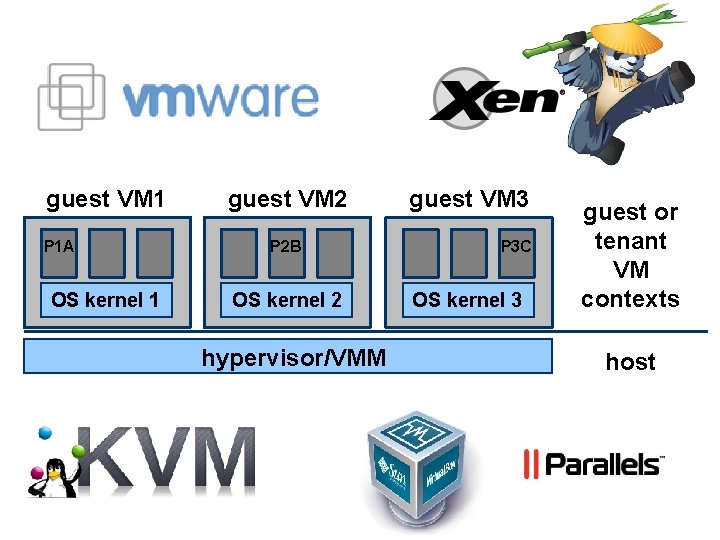
Native virtual machines (VMs) • Slide a hypervisor underneath the kernel. – New OS layer: also called virtual machine monitor (VMM). • Kernel and processes run in a virtual machine (VM). – The VM “looks the same” to the OS as a physical machine. – The VM is a sandboxed/isolated context for an entire OS. • Can run multiple VM instances on a shared computer. guests host hypervisor (VMM)

guest VM 1 P 1 A OS kernel 1 guest VM 2 P 2 B OS kernel 2 hypervisor/VMM guest VM 3 P 3 C OS kernel 3 guest or tenant VM contexts host

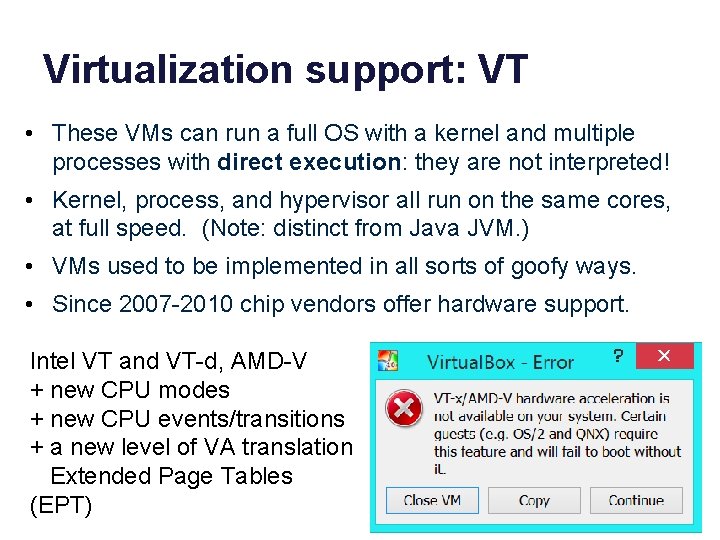
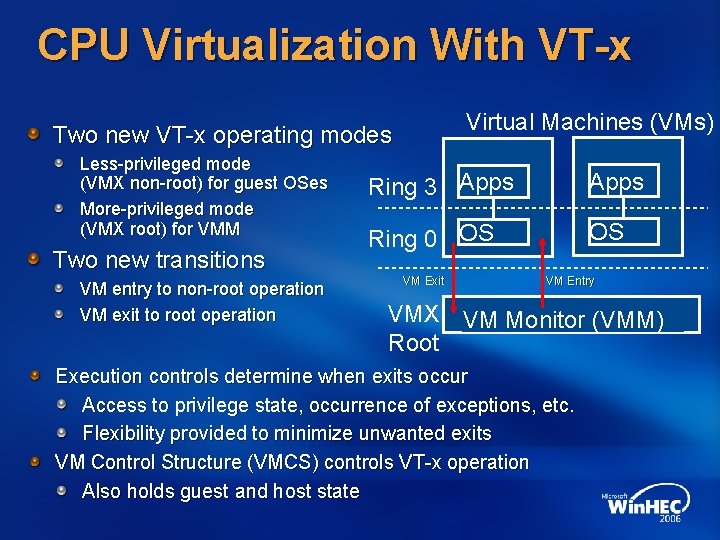
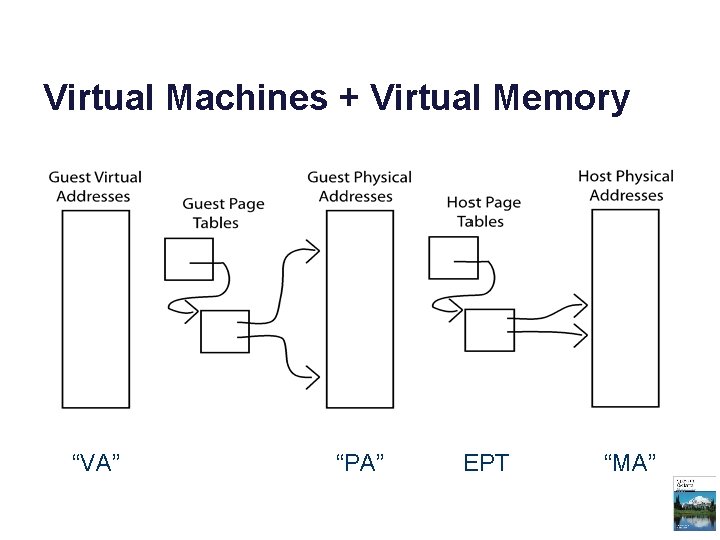
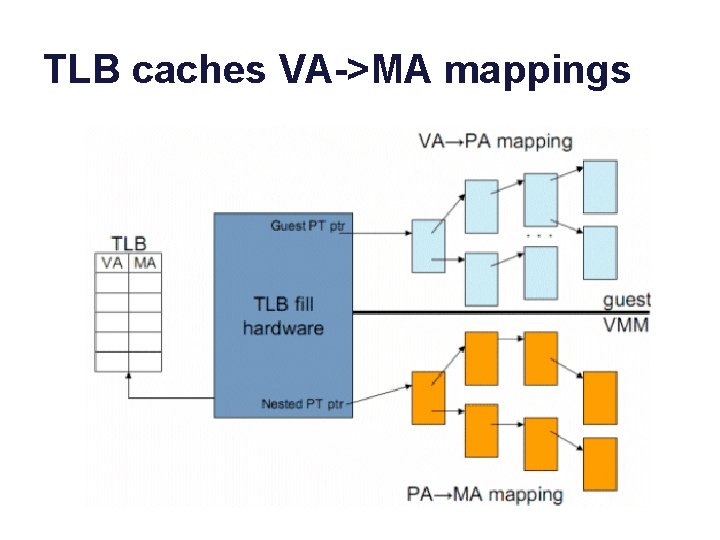
Virtualization support: VT • These VMs can run a full OS with a kernel and multiple processes with direct execution: they are not interpreted! • Kernel, process, and hypervisor all run on the same cores, at full speed. (Note: distinct from Java JVM. ) • VMs used to be implemented in all sorts of goofy ways. • Since 2007 -2010 chip vendors offer hardware support. Intel VT and VT-d, AMD-V + new CPU modes + new CPU events/transitions + a new level of VA translation Extended Page Tables (EPT)

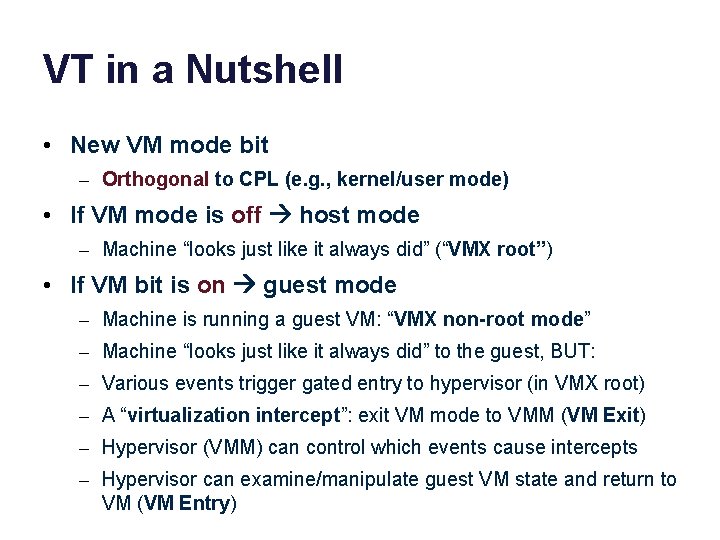
VT in a Nutshell • New VM mode bit – Orthogonal to CPL (e. g. , kernel/user mode) • If VM mode is off host mode – Machine “looks just like it always did” (“VMX root”) • If VM bit is on guest mode – Machine is running a guest VM: “VMX non-root mode” – Machine “looks just like it always did” to the guest, BUT: – Various events trigger gated entry to hypervisor (in VMX root) – A “virtualization intercept”: exit VM mode to VMM (VM Exit) – Hypervisor (VMM) can control which events cause intercepts – Hypervisor can examine/manipulate guest VM state and return to VM (VM Entry)

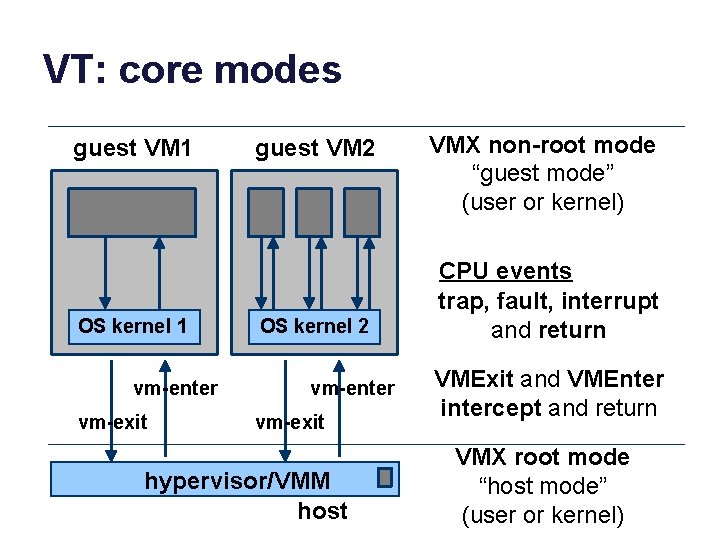
VT: core modes guest VM 1 OS kernel 1 vm-enter vm-exit guest VM 2 OS kernel 2 vm-enter vm-exit hypervisor/VMM host VMX non-root mode “guest mode” (user or kernel) CPU events trap, fault, interrupt and return VMExit and VMEnter intercept and return VMX root mode “host mode” (user or kernel)

CPU Virtualization With VT-x Virtual Machines (VMs) Two new VT-x operating modes Less-privileged mode (VMX non-root) for guest OSes More-privileged mode (VMX root) for VMM Two new transitions VM entry to non-root operation VM exit to root operation Ring 3 Apps Ring 0 OS VM Exit VM Entry VMX VM Monitor (VMM) Root Execution controls determine when exits occur Access to privilege state, occurrence of exceptions, etc. Flexibility provided to minimize unwanted exits VM Control Structure (VMCS) controls VT-x operation Also holds guest and host state

Virtual Machines + Virtual Memory “VA” “PA” EPT “MA”

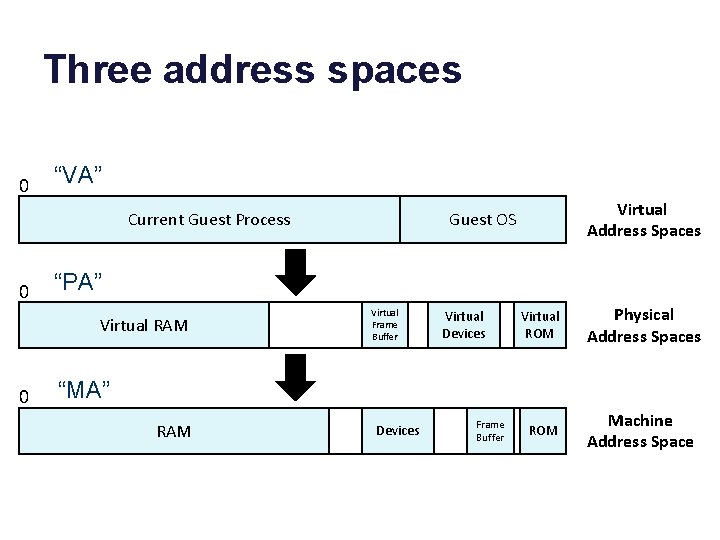
Three address spaces 0 “VA” Current Guest Process 0 “PA” Virtual RAM 0 Virtual Address Spaces Guest OS Virtual Frame Buffer Virtual Devices Virtual ROM Physical Address Spaces ROM Machine Address Space “MA” RAM Devices Frame Buffer

TLB caches VA->MA mappings

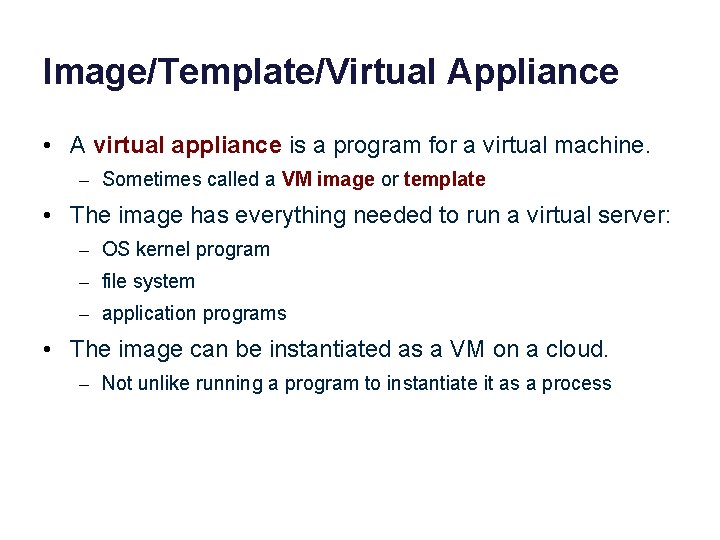
Image/Template/Virtual Appliance • A virtual appliance is a program for a virtual machine. – Sometimes called a VM image or template • The image has everything needed to run a virtual server: – OS kernel program – file system – application programs • The image can be instantiated as a VM on a cloud. – Not unlike running a program to instantiate it as a process

Thank you, VMware

Containers • Note: lightweight container technologies offer a similar abstraction for software packaging and deployment, based on an extended process model. – E. g. , Docker and Google Kubernetes

Part 5 NOTREACHED

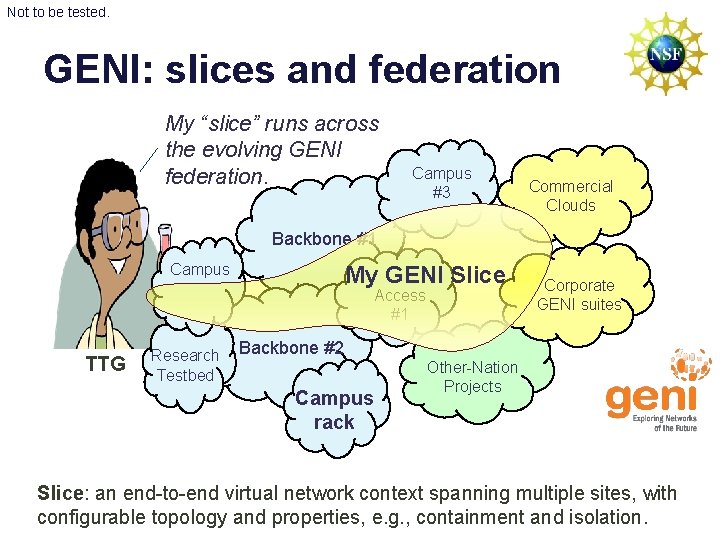
Not to be tested. GENI: slices and federation My “slice” runs across the evolving GENI federation. Campus #3 Commercial Clouds Backbone #1 Campus My GENI Slice Access #1 TTG Research Testbed Corporate GENI suites Backbone #2 Campus rack Other-Nation Projects Slice: an end-to-end virtual network context spanning multiple sites, with configurable topology and properties, e. g. , containment and isolation.

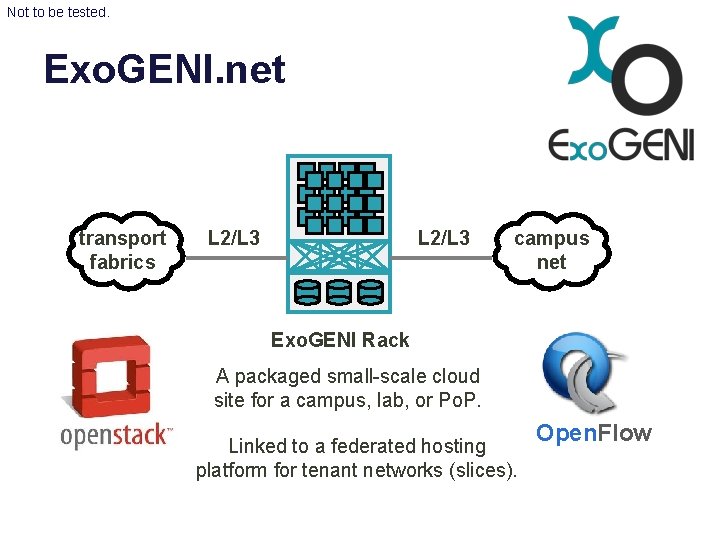
Not to be tested. Exo. GENI. net transport fabrics L 2/L 3 campus net Exo. GENI Rack A packaged small-scale cloud site for a campus, lab, or Po. P. Linked to a federated hosting platform for tenant networks (slices). Open. Flow

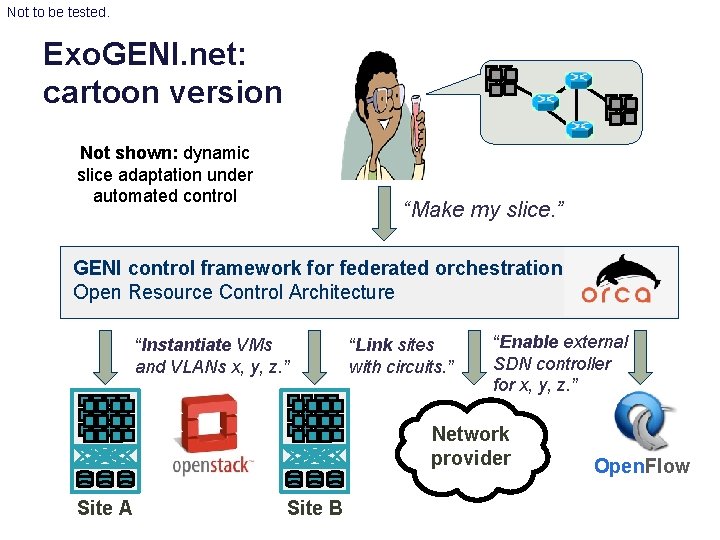
Not to be tested. Exo. GENI. net: cartoon version Not shown: dynamic slice adaptation under automated control “Make my slice. ” GENI control framework for federated orchestration Open Resource Control Architecture “Instantiate VMs and VLANs x, y, z. ” “Link sites with circuits. ” “Enable external SDN controller for x, y, z. ” Network provider Site A Site B Open. Flow