DUALITY STICKS THE RELATIONSHIP BETWEEN CONFIDENCE INTERVALS HYPOTHESIS

DUALITY STICKS THE RELATIONSHIP BETWEEN CONFIDENCE INTERVALS & HYPOTHESIS TESTS John Krickl Glenbrook North High School Northbrook, IL jkrickl@glenbrook 225. org

MOTIVATION

HOW CAN WE MAKE THIS STATEMENT MORE MEANINGFUL TO STUDENTS? “Using the sample, a two-tailed hypothesis test with significance level α will generally* make the same decision about a hypothesized value of a parameter as will a 100(1 - α)% confidence interval. ” *The difference between does not make this relationship perfect, but I do not believe this detracts from the big picture of the activity. Also, this difference makes for a great discussion in class. ( S e e s l i d e 1 6 f o r m o r e f l e c t i o n t h i s )

CONSTRUCTION § Popsicle stick § Paper clip § Pipe cleaners § Red pipe cleaner: cut to (just over) 29 cm § Green pipe cleaner: cut to (just under) 25 cm

RESULT

LOGISTICS For the sake of simplicity and multiple uses, this activity is constructed visualizing a 95% confidence interval for a population proportion in conjunction with the rejection region of a two-tailed, one proportion z-test with alpha =. 05.

LOGISTICS One standard deviation will be represented by 7. 5 cm when drawn on the board. Thus: § Red pipe cleaner (29. 4 cm) represents a 95% confidence interval § Green pipe cleaner (24. 7 cm) represents a 90% confidence interval Having this consistent scale allows you to quickly recreate a sketch of the standard normal distribution that will match up with the sticks we have created

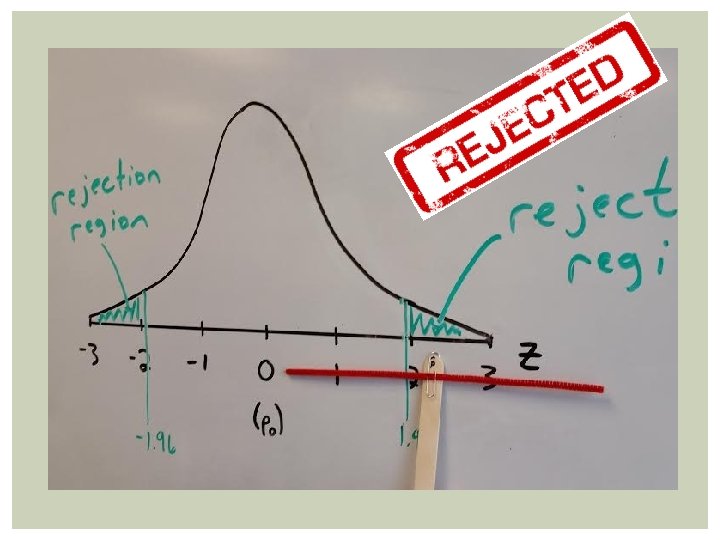
I start by having the students put the popsicle stick at the center of the distribution. While this is a sketch of the standard normal distribution, I put p 0 in parentheses below z = 0 to remind students than an obtained p-hat equal to p 0 corresponds with a test statistic of 0.

Both our CI and our hypothesis test do not find evidence against p 0.

The A-HA moment for many students. Students notice that when our obtained p-hat (or corresponding test statistic) is on the cusp of the rejection region, our 95% CI just barely captures p 0. The instant we move further right…

IN ACTION Students work in pairs. Person A focuses on the result of the hypothesis test. § I reject H 0 (p = p 0 ). § I fail to reject H 0. Person B focuses on the result of the confidence interval. § “I do not contain p 0 , so I reject p 0 as a plausible value for p” § “I contain p 0 , so I do not reject p 0 as a plausible value for p”

BEFORE AND AFTER Typical student answer in the past for why this duality occurs: “Since the hypothesis test rejected p=. 48, the confidence interval also rejects. 48. ” After this activity: “If we rejected H 0 , we had a test statistic larger than 1. 96 or smaller than -1. 96. Since the 95% confidence interval spans 1. 96 standard deviations in either direction from our obtained result, we will be too far from p 0 to capture it in the interval. ”

WHAT ABOUT A ONE-TAILED TEST? For a one-tailed hypothesis test with alpha =. 05, the test will (generally) make the same decision about a hypothesized value of the parameter that a 90% confidence interval will make. While it is not too difficult to note that the rejection region of a one-tailed, one proportion z-test will either be z < -1. 645 or z > 1. 645, and 1. 645 is the critical value for a 90% CI for a population proportion, I think it packs a lot more punch for the students to understand this relationship in a more hands-on way…

Students can see that the 90% CI backs up the decision of the hypothesis test, but the 95% CI does not, as it still captures p 0.

CLOSING COMMENTS The statement on slide 3 includes the word “generally” because in a one proportion z-test, we use p 0 when calculating the standard deviation of the sampling distribution of p hat. When we construct the confidence interval, we estimate p 0 with p hat, and therefore the standard deviation assuming H 0 is true & the standard error used in the confidence interval will not perfectly match. While this distinction is worth mentioning, I don’t believe it detracts from the message of the activity. § As mentioned previously, this made for a great discussion in class. The same activity could be done in the context of inference for a population mean, but then degrees of freedom are involved (unless we know σ, which is unlikely). This is an activity that I use often & spontaneously in class, so I didn’t want to make a new scale/rejection region each time we had a new sample.

THANK YOU! Please feel free to contact me with any questions or suggestions for improvement… jkrickl@glenbrook 225. org
- Slides: 17