Dual Bar Charts TwoWay Tables Worksheet A The

Dual Bar Charts & Two-Way Tables – Worksheet A The worksheet is in a 2 sizes.

Printing To print handouts from slides Select the slide from the left. Then click: File > Print > ‘Print Current Slide’ To print multiple slides Click on a section title to highlight all those slides, or press ‘Ctrl’ at the same time as selecting slides to highlight more than one. Then click: File > Print > ‘Print Selection’ To print double-sided handouts Highlight both slides before using ‘Print Selection’. Choose ‘Print on Both Sides’ and ‘Flip on Short Edge’.
 Use the information to complete the bar graph.")
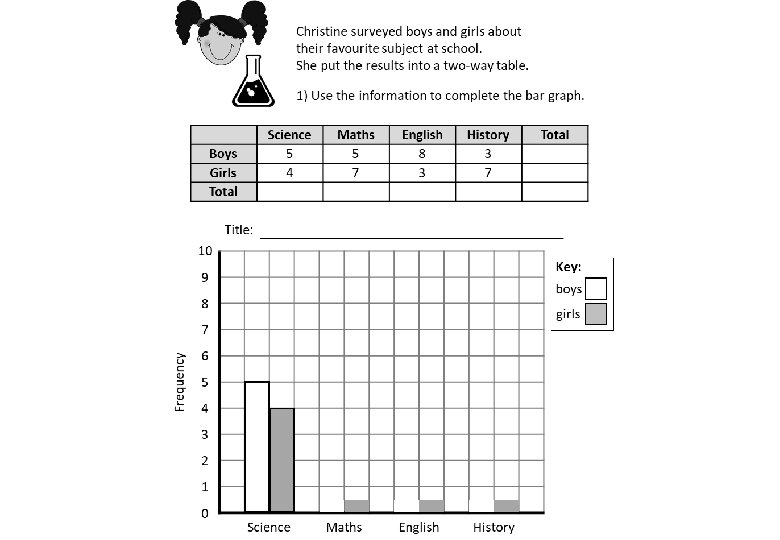
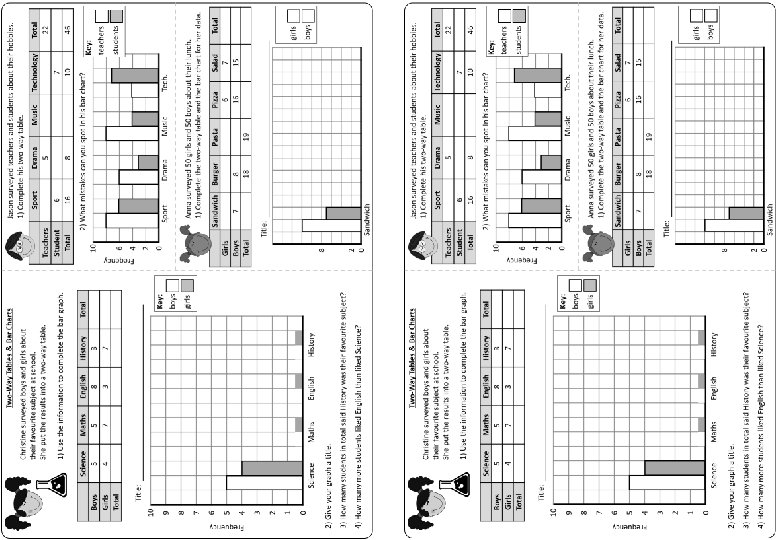
Two-Way Tables & Bar Charts 1) Use the information to complete the bar graph. Science 5 4 9 Boys Girls Total Title: Maths 5 7 12 English 8 3 11 History 3 7 10 Total 21 21 42 Favourite Subjects for 42 Students 10 Frequency students 4 2 0 Sport Girls Boys Total 4 3 Sandwich 12 7 19 Title: 2 English Frequency 1 Maths History 2) Give your graph a title. 3) How many students in total said History was their favourite subject? 10 4) How many more students liked English than liked Science? 2 Drama Music Tech. Anna surveyed 50 girls and 50 boys about their lunch. 1) Complete the two-way table and the bar chart for her data. 5 Science Total 22 24 46 Key: 6 6 0 Technology 3 7 10 teachers girls 7 Music 4 8 12 10 boys 8 Drama 5 3 8 2) What mistakes can you spot in his bar chart? Key: 9 Sport 10 6 16 Teachers Student Total Freqency Christine surveyed boys and girls about their favourite subject at school. She put the results into a two-way table. Jason surveyed teachers and students about their hobbies. 1) Complete his two-way table. 16 14 12 10 8 6 4 2 0 Burger 10 8 18 Pasta 15 4 19 Pizza 6 16 22 Salad 7 15 22 Total 50 50 100 Favourite Subjects for 100 Students Key: girls boys Sandwich Burger Pasta Pizza Salad

Two-Way Tables & Bar Charts Christine surveyed boys and girls about their favourite subject at school. She put the results into a two-way table. Sport 1) Use the information to complete the bar graph. Boys Girls Total Maths 5 7 English 8 3 History 3 7 6 16 Music Technology Total 22 7 10 8 10 46 Key: teachers students 6 4 2 10 Key: 9 0 boys 8 Sport girls 7 4 Music Sandwich Burger Pasta 7 8 18 19 Girls Boys Total 5 Drama Tech. Anna surveyed 50 girls and 50 boys about their lunch. 1) Complete the two-way table and the bar chart for her data. 6 3 Pizza 6 16 Salad 7 15 Total Title: 2 1 0 Drama 5 2) What mistakes can you spot in his bar chart? Total Title: Frequency Teachers Student Total Freqency Science 5 4 Jason surveyed teachers and students about their hobbies. 1) Complete his two-way table. girls Science Maths English boys History 2) Give your graph a title. 3) How many students in total said History was their favourite subject? 4) How many more students liked English than liked Science? 8 2 0 Sandwich

Questions? Comments? Suggestions? …or have you found a mistake!? Any feedback would be appreciated . Please feel free to email: tom@goteachmaths. co. uk
- Slides: 7