
Drought Frequency Analysis in Tlamacazapa Guerrero Mexico Robin
Drought Frequency Analysis in Tlamacazapa, Guerrero, Mexico Robin Lynch Hydrology April 29, 2010
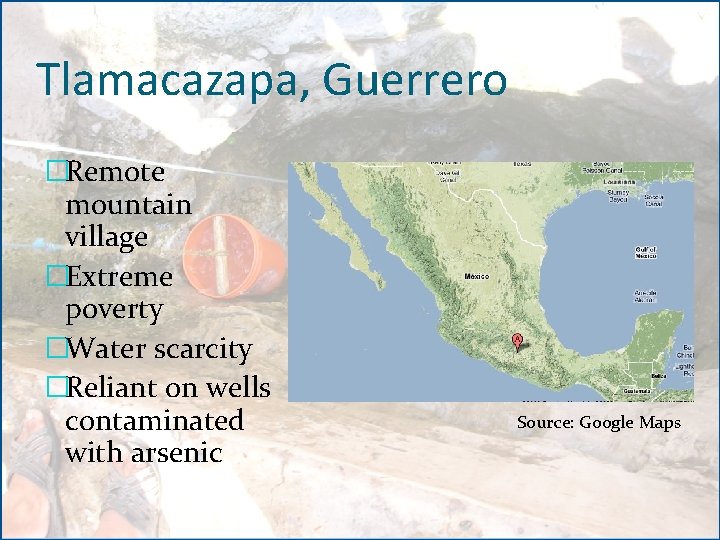
Tlamacazapa, Guerrero �Remote mountain village �Extreme poverty �Water scarcity �Reliant on wells contaminated with arsenic Source: Google Maps
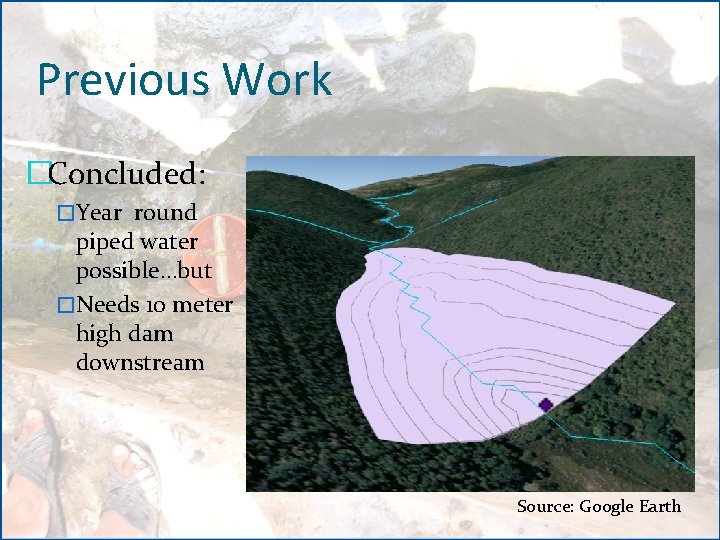
Previous Work �Concluded: �Year round piped water possible…but �Needs 10 meter high dam downstream Source: Google Earth
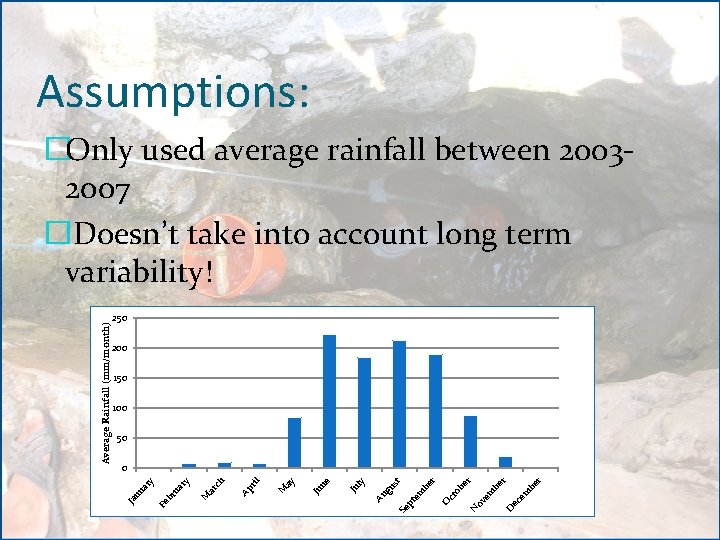
Assumptions: 250 200 150 100 50 r em be r D ec m be er ov e N ct ob r O be em Se pt Au gu st Ju ly Ju ne ay M ril Ap ch M ar y ar ru Fe b nu ar y 0 Ja Average Rainfall (mm/month) �Only used average rainfall between 20032007 �Doesn’t take into account long term variability!
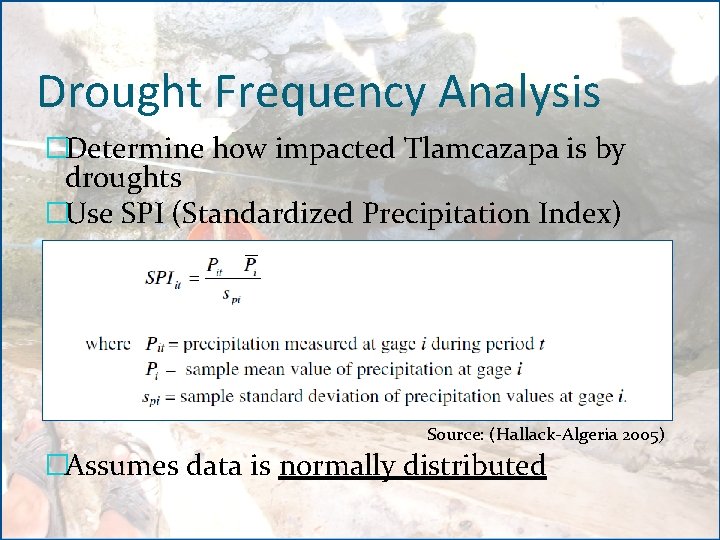
Drought Frequency Analysis �Determine how impacted Tlamcazapa is by droughts �Use SPI (Standardized Precipitation Index) Source: (Hallack-Algeria 2005) �Assumes data is normally distributed
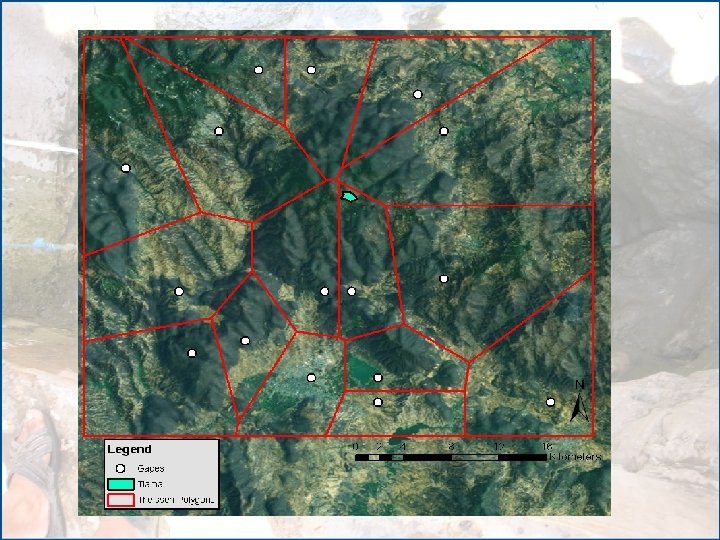
Instituto Mexicano de Technologia del Agua (IMTA) � 16 gaging stations �Within 25 kilometer radius of Tlama �Rainfall data between 1940 -1998 �Inconsistent years in each station
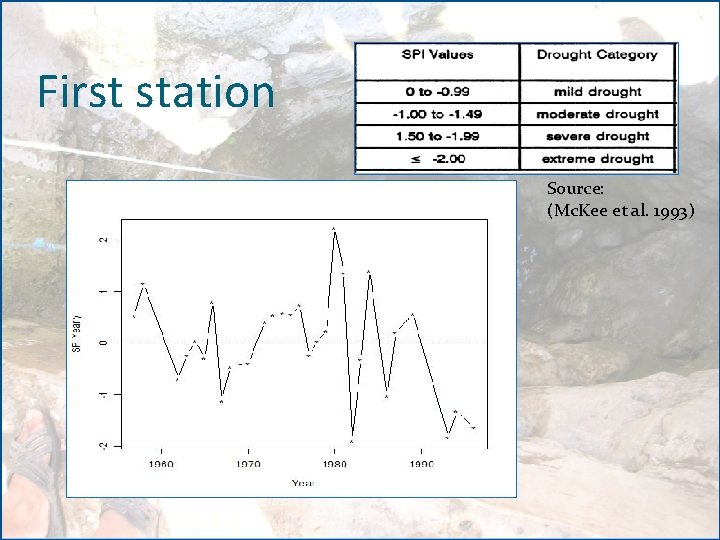
First station Source: (Mc. Kee et al. 1993)
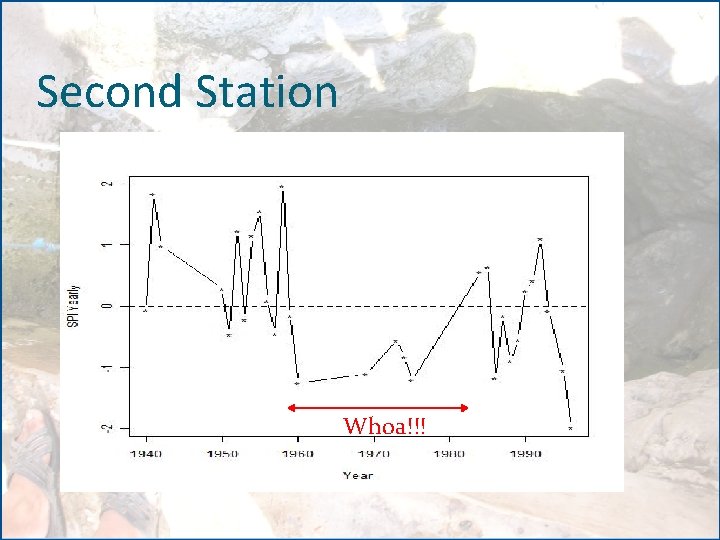
Second Station Whoa!!!
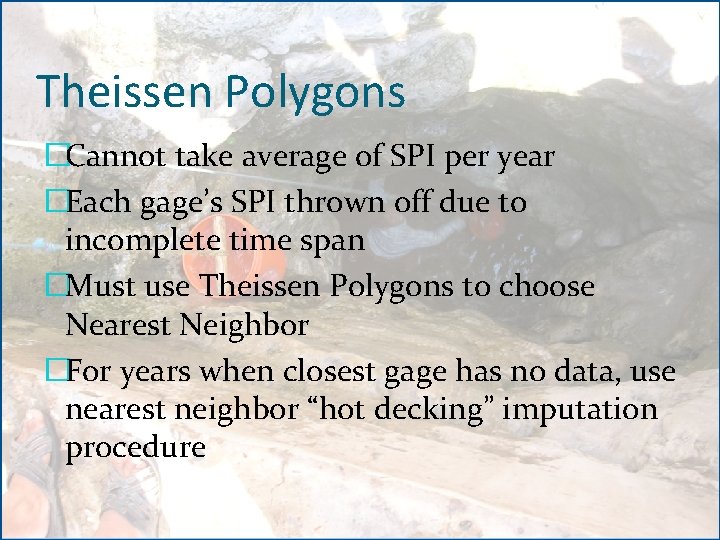
Theissen Polygons �Cannot take average of SPI per year �Each gage’s SPI thrown off due to incomplete time span �Must use Theissen Polygons to choose Nearest Neighbor �For years when closest gage has no data, use nearest neighbor “hot decking” imputation procedure
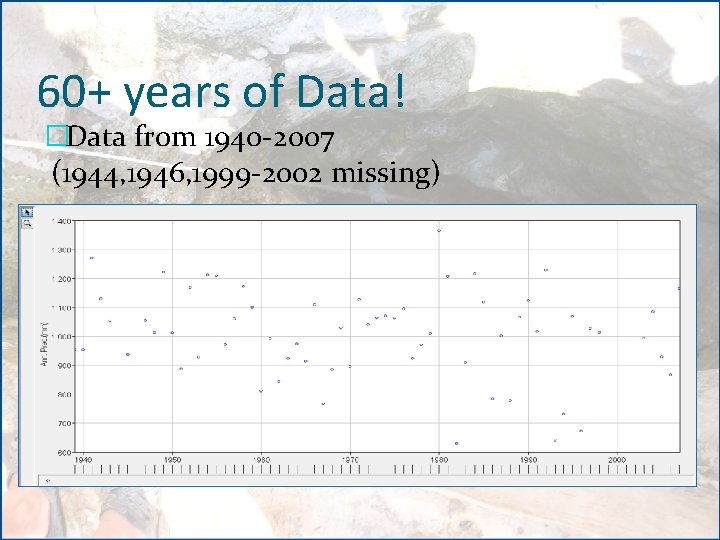
60+ years of Data! �Data from 1940 -2007 (1944, 1946, 1999 -2002 missing)
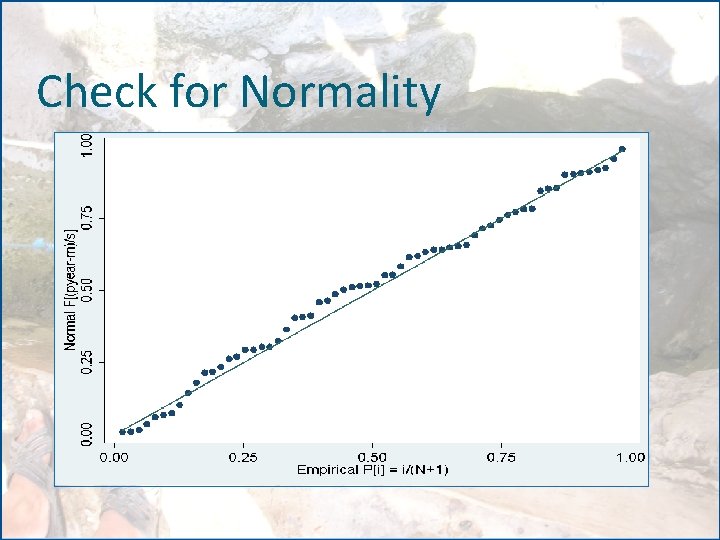
Check for Normality
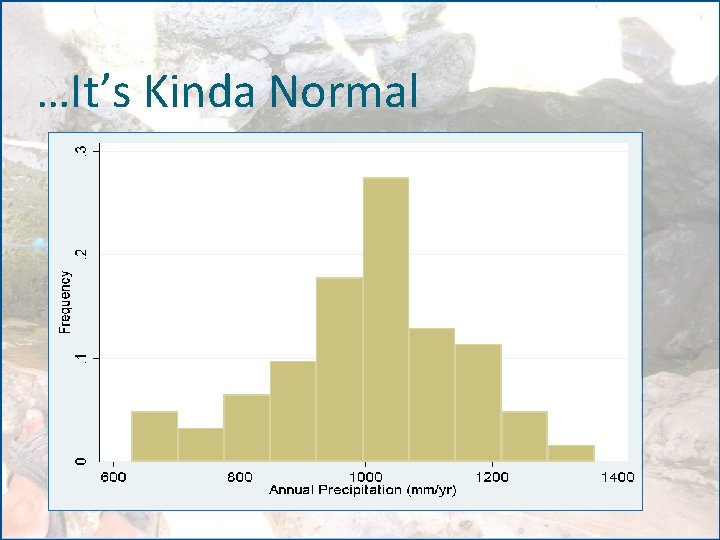
…It’s Kinda Normal
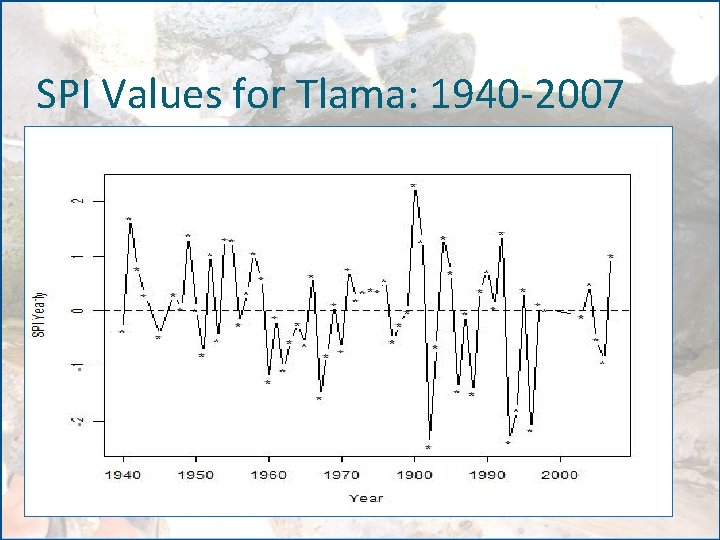
SPI Values for Tlama: 1940 -2007
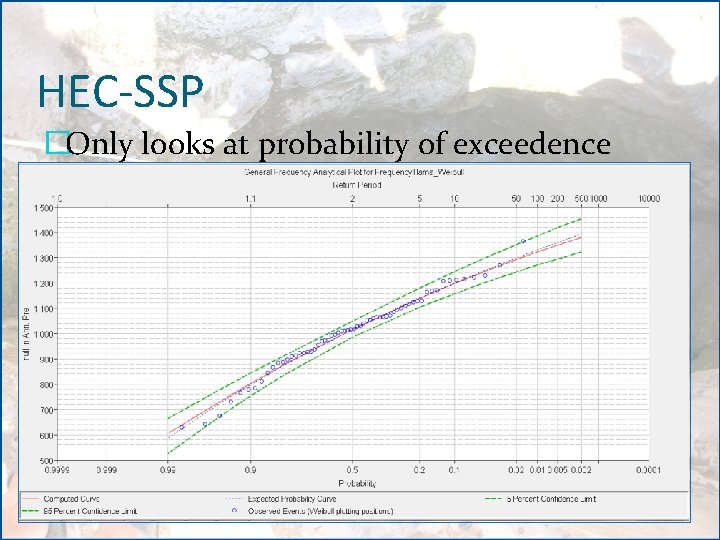
HEC-SSP �Only looks at probability of exceedence
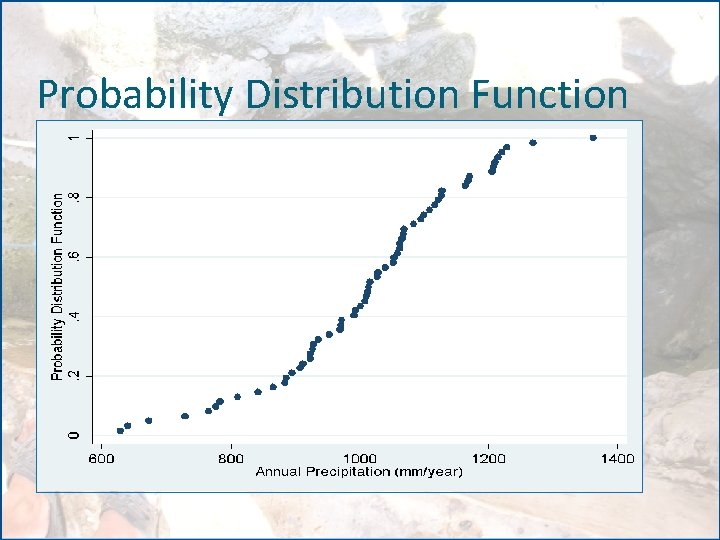
Probability Distribution Function
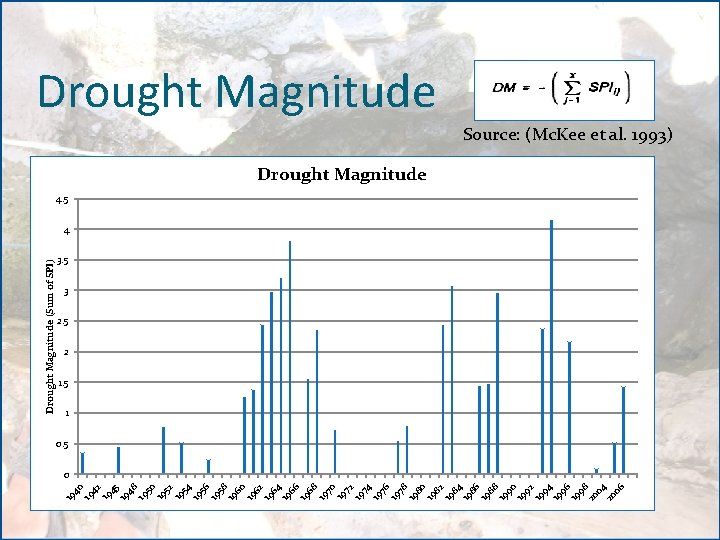
40 19 42 19 45 19 48 19 50 19 52 19 54 19 56 19 58 19 60 19 62 19 64 19 66 19 68 19 70 19 72 19 74 19 76 19 78 19 80 19 82 19 84 19 86 19 88 19 90 19 92 19 94 19 96 19 98 20 04 20 06 19 Drought Magnitude (Sum of SPI) Drought Magnitude Source: (Mc. Kee et al. 1993) Drought Magnitude 4. 5 4 3. 5 3 2. 5 2 1. 5 1 0. 5 0
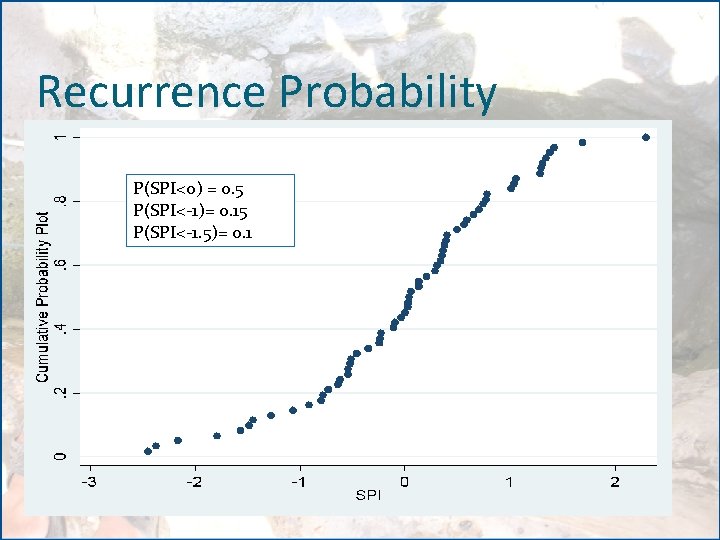
Recurrence Probability P(SPI<0) = 0. 5 P(SPI<-1)= 0. 15 P(SPI<-1. 5)= 0. 1
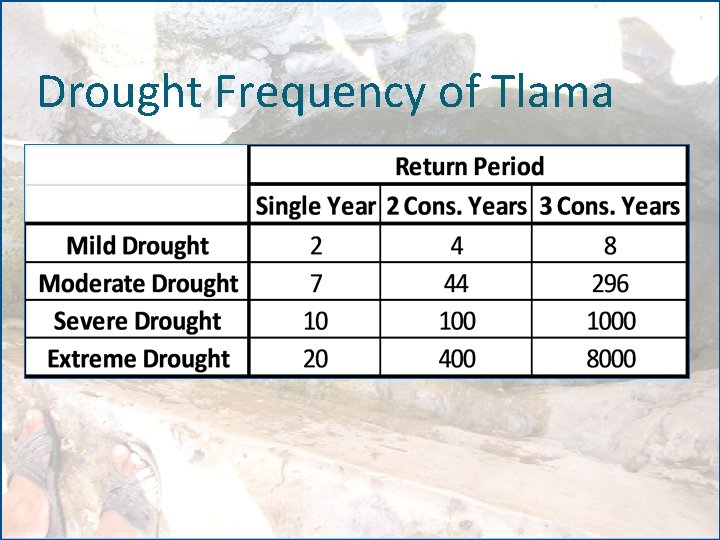
Drought Frequency of Tlama
Future Work �Statistical regression to see the relationship between drought and arsenic levels �Make recommendations for reservoir planning using this drought frequency analysis
- Slides: 20