
Driving Profitable Growth in Todays Global Automotive Industry

Driving Profitable Growth in Today’s Global Automotive Industry Presented by
About Plante Moran 2, 000+ 220+ 400+ 13 th 90 Manufacturing & distribution clients Plastics processor clients Automotive clients Ranked 13 th largest CPA and Consulting firm in the U. S. Number of years since Plante Moran was founded in 1924 North American Plastics Industry Study • North American Plastics Industry Study 2014 Survey Report • • • Plante Moran’s annual benchmarking study since 1995 Survey collects ~250 data points per participant – Financial, Operational, Strategic, HR, Sales No cost to participate Participants receive 80+ page customized report Deep Industry Involvement • • • Society of Plastics Industry Manufacturers Association for Plastics Processors Original Equipment Suppliers Association National Association of Manufacturers American Production and Inventory Control Society National Tooling and Machining Association

About the Speakers Daron Gifford • Partner, Plante Moran Strategy and Automotive Consulting Practice Leader • Over 37 years working in the technology, manufacturing and automotive industries, with over 28 years in management consulting • Prior leadership positions in the management consulting practices of Deloitte, KPMG, and A. T. Kearney Ted Morgan • Senior Manager, Plante Moran Strategy team and Co. Leader of Plastics Industry team • Over 15 years plastics and automotive experience including for manufacturers such as Magna and Meridian Automotive Systems • Strategy, M&A, sales, product launch and financial background
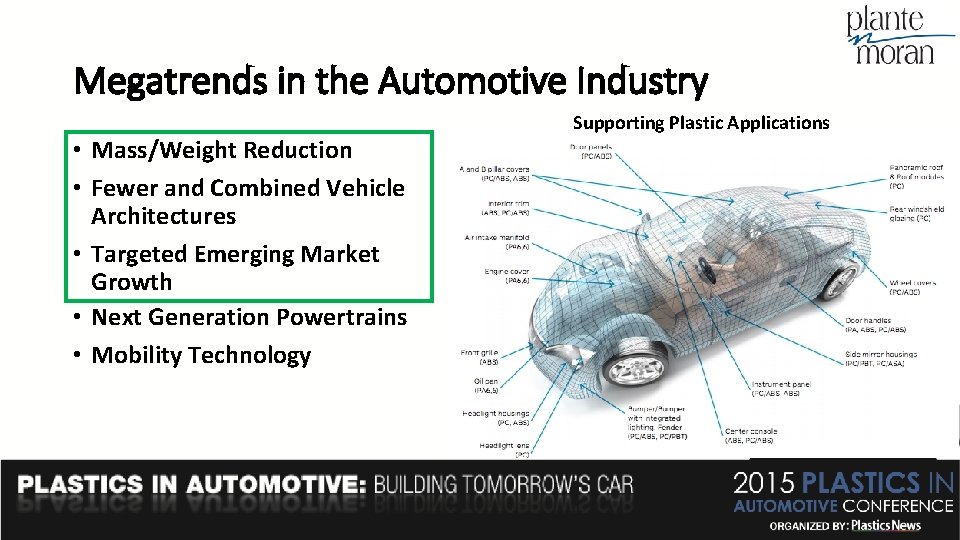
Megatrends in the Automotive Industry • Mass/Weight Reduction • Fewer and Combined Vehicle Architectures • Targeted Emerging Market Growth • Next Generation Powertrains • Mobility Technology Supporting Plastic Applications
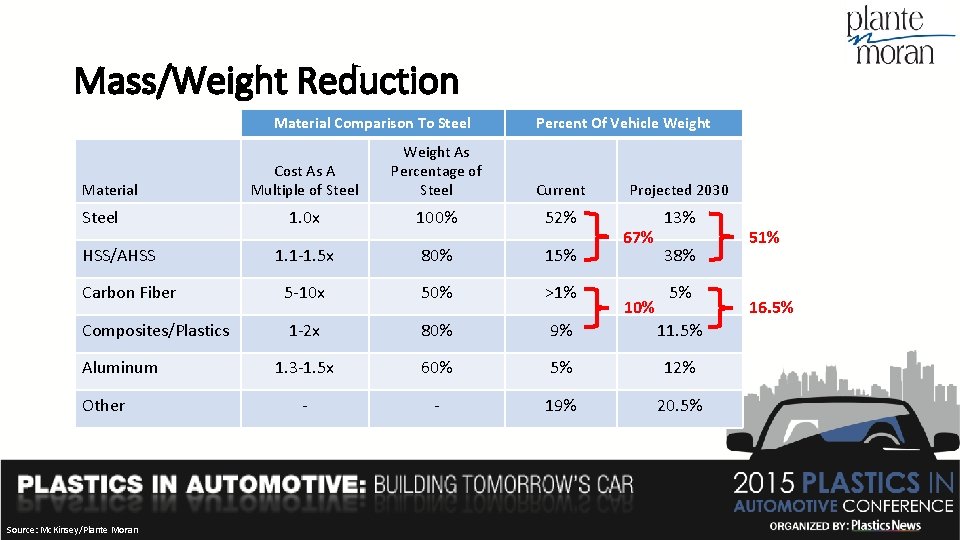
Mass/Weight Reduction Material Comparison To Steel Percent Of Vehicle Weight Cost As A Multiple of Steel Weight As Percentage of Steel Current Projected 2030 1. 0 x 100% 52% 13% 1. 1 -1. 5 x 80% 15% Carbon Fiber 5 -10 x 50% >1% Composites/Plastics 1 -2 x 80% 9% 11. 5% 1. 3 -1. 5 x 60% 5% 12% - - 19% 20. 5% Material Steel HSS/AHSS Aluminum Other Source: Mc. Kinsey/Plante Moran 67% 10% 38% 5% 51% 16. 5%
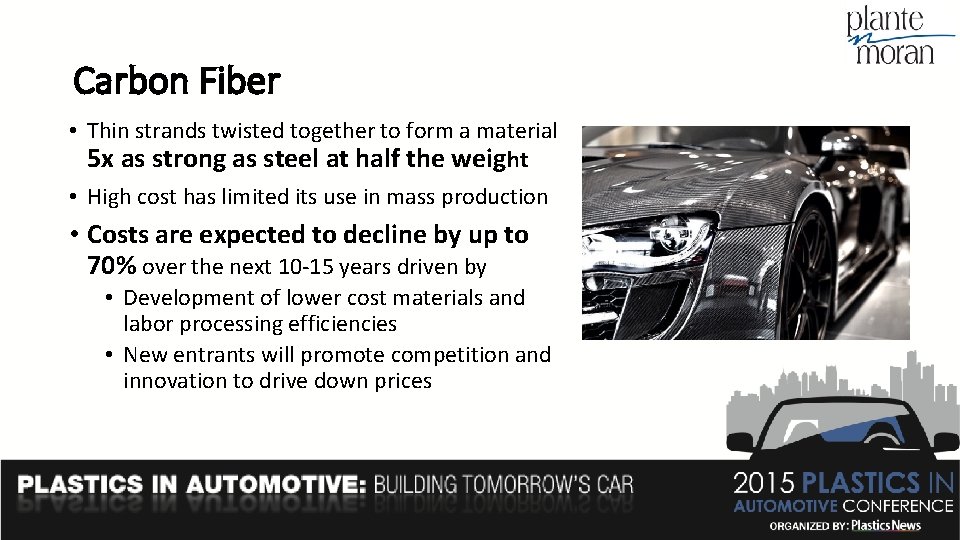
Carbon Fiber • Thin strands twisted together to form a material 5 x as strong as steel at half the weight • High cost has limited its use in mass production • Costs are expected to decline by up to 70% over the next 10 -15 years driven by • Development of lower cost materials and labor processing efficiencies • New entrants will promote competition and innovation to drive down prices
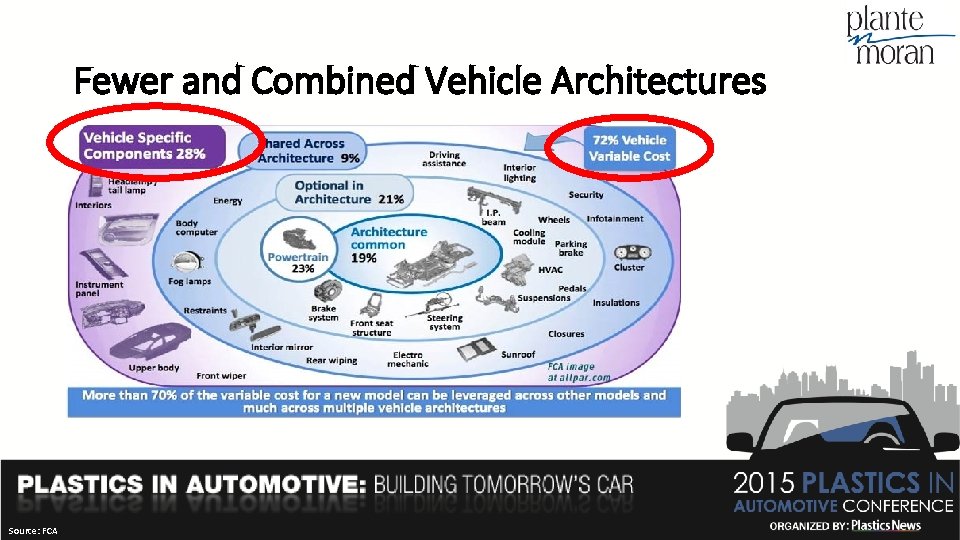
Fewer and Combined Vehicle Architectures Source: FCA
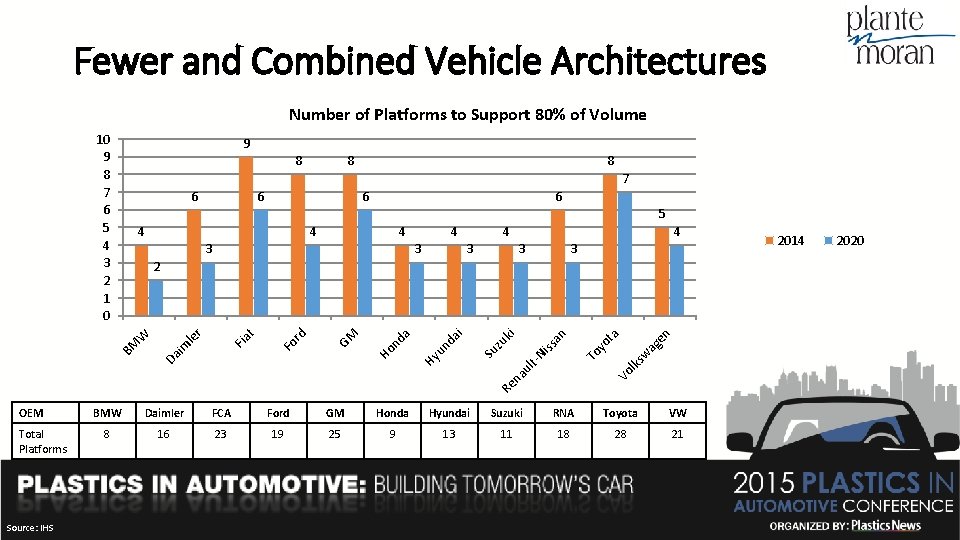
Fewer and Combined Vehicle Architectures Number of Platforms to Support 80% of Volume 10 9 8 7 6 5 4 3 2 1 0 9 8 8 8 7 6 6 5 4 4 4 3 4 3 3 en ta ag w Re Vo lks To yo n ss a Ni na ul t- Su zu ki da i un Hy a Ho nd GM rd Fo t Fia r le im Da BM W 2 OEM Total Platforms Source: IHS BMW Daimler FCA Ford GM Honda Hyundai Suzuki RNA Toyota VW 8 16 23 19 25 9 13 11 18 28 21 2014 2020
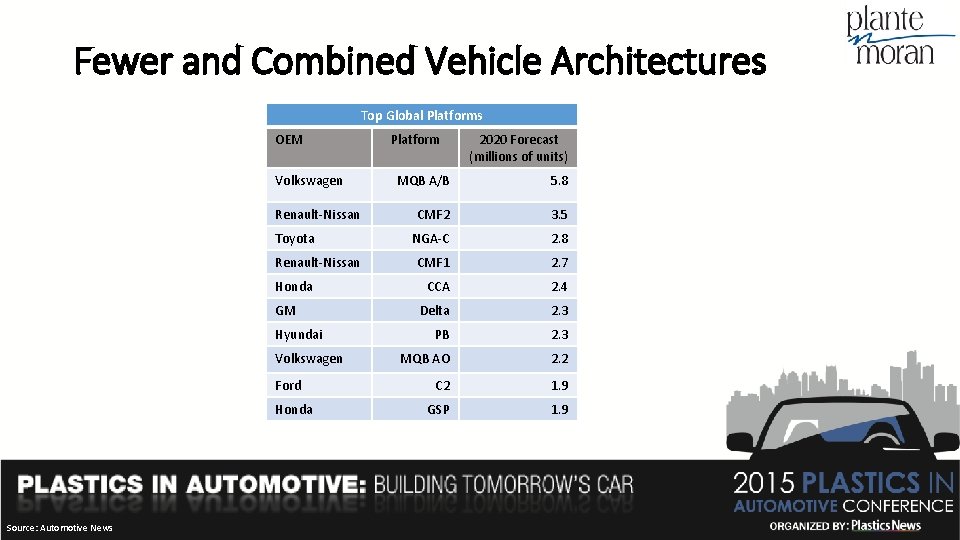
Fewer and Combined Vehicle Architectures Top Global Platforms OEM Volkswagen Renault-Nissan Toyota Renault-Nissan Honda GM Hyundai Volkswagen Ford Honda Source: Automotive News Platform 2020 Forecast (millions of units) MQB A/B 5. 8 CMF 2 3. 5 NGA-C 2. 8 CMF 1 2. 7 CCA 2. 4 Delta 2. 3 PB 2. 3 MQB AO 2. 2 C 2 1. 9 GSP 1. 9
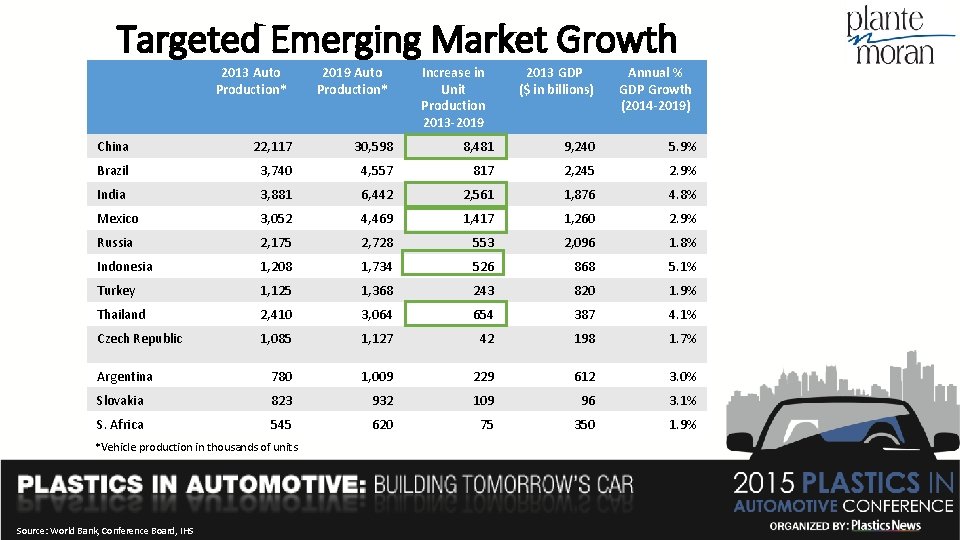
Targeted Emerging Market Growth 2013 Auto Production* 2019 Auto Production* Increase in Unit Production 2013 -2019 2013 GDP ($ in billions) Annual % GDP Growth (2014 -2019) China 22, 117 30, 598 8, 481 9, 240 5. 9% Brazil 3, 740 4, 557 817 2, 245 2. 9% India 3, 881 6, 442 2, 561 1, 876 4. 8% Mexico 3, 052 4, 469 1, 417 1, 260 2. 9% Russia 2, 175 2, 728 553 2, 096 1. 8% Indonesia 1, 208 1, 734 526 868 5. 1% Turkey 1, 125 1, 368 243 820 1. 9% Thailand 2, 410 3, 064 654 387 4. 1% Czech Republic 1, 085 1, 127 42 198 1. 7% Argentina 780 1, 009 229 612 3. 0% Slovakia 823 932 109 96 3. 1% S. Africa 545 620 75 350 1. 9% *Vehicle production in thousands of units Source: World Bank, Conference Board, IHS
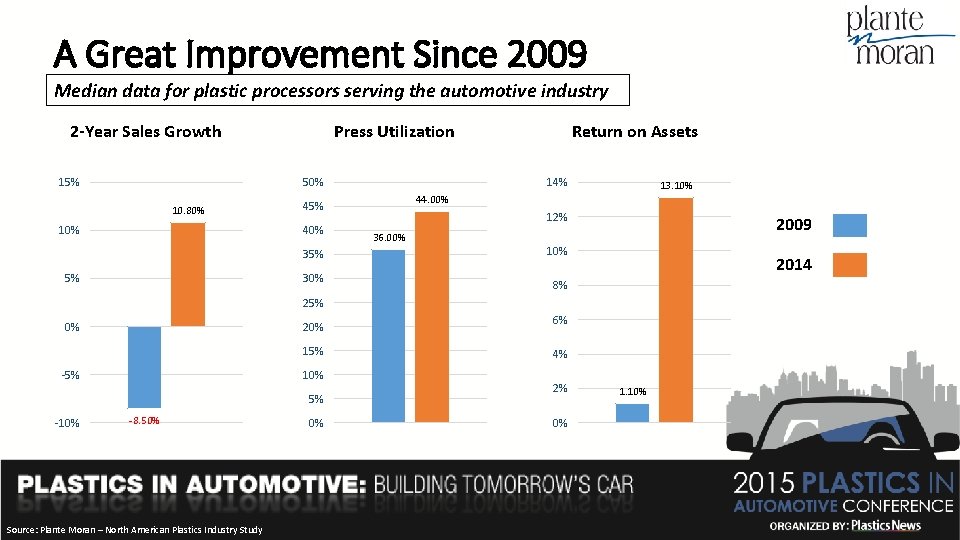
A Great Improvement Since 2009 Median data for plastic processors serving the automotive industry 2 -Year Sales Growth 15% Press Utilization 50% 10. 80% 10% 35% 5% 14% 30% 13. 10% 44. 00% 45% 40% Return on Assets 12% 36. 00% 2009 10% 2014 8% 25% 0% 20% 15% -5% 10% 5% -10% -8. 50% Source: Plante Moran – North American Plastics Industry Study 0% 6% 4% 2% 0% 1. 10%
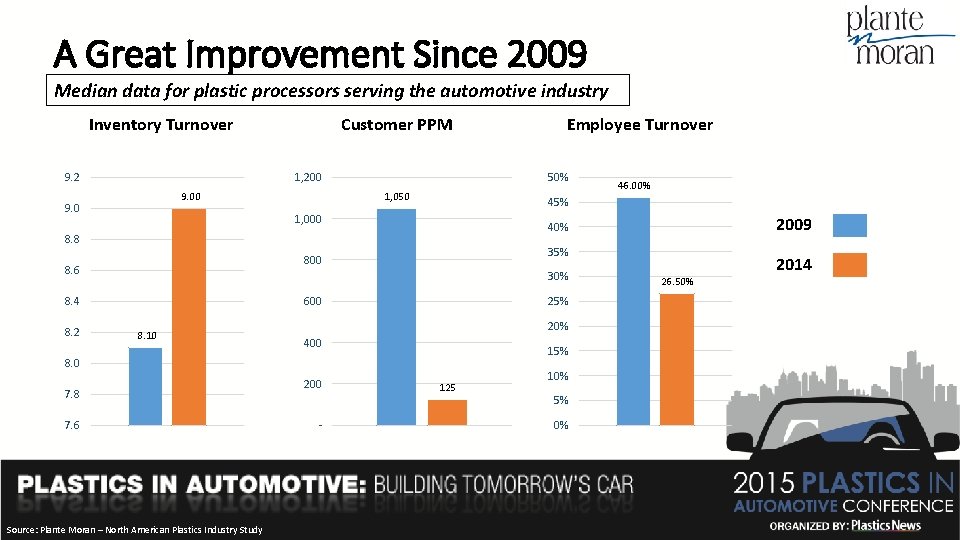
A Great Improvement Since 2009 Median data for plastic processors serving the automotive industry Inventory Turnover 9. 2 Customer PPM 1, 200 9. 0 50% 1, 050 8. 2 35% 800 30% 600 8. 10 25% 20% 400 15% 8. 0 7. 8 7. 6 Source: Plante Moran – North American Plastics Industry Study 200 - 2009 40% 8. 8 8. 4 46. 00% 45% 1, 000 8. 6 Employee Turnover 125 10% 5% 0% 26. 50% 2014
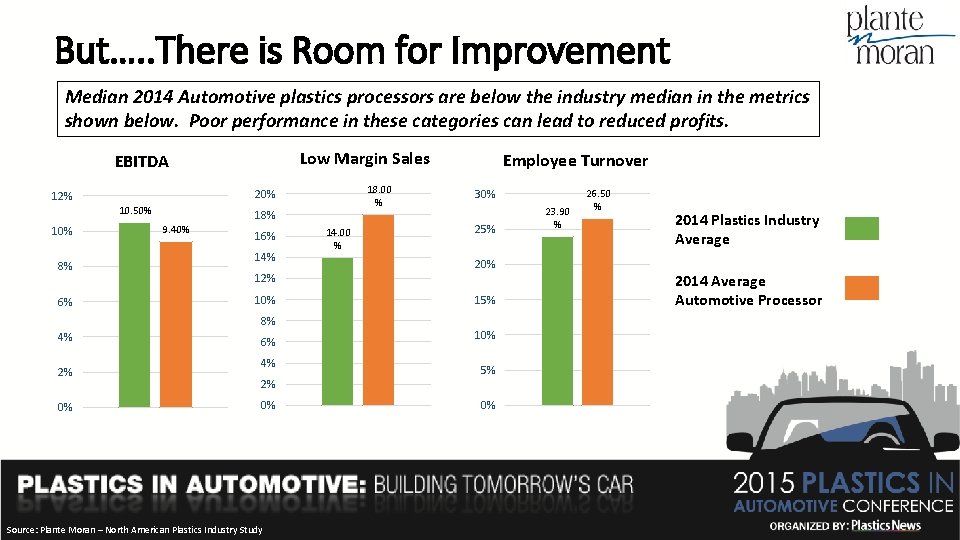
But…. . There is Room for Improvement Median 2014 Automotive plastics processors are below the industry median in the metrics shown below. Poor performance in these categories can lead to reduced profits. Low Margin Sales EBITDA 10. 50% 10% 8% 6% 18% 9. 40% 16% 14% 12% 10% 8% 4% 2% 0% 18. 00 % 20% 12% 6% 4% 2% 0% Source: Plante Moran – North American Plastics Industry Study 14. 00 % Employee Turnover 30% 25% 20% 15% 10% 5% 0% 23. 90 % 26. 50 % 2014 Plastics Industry Average 2014 Average Automotive Processor
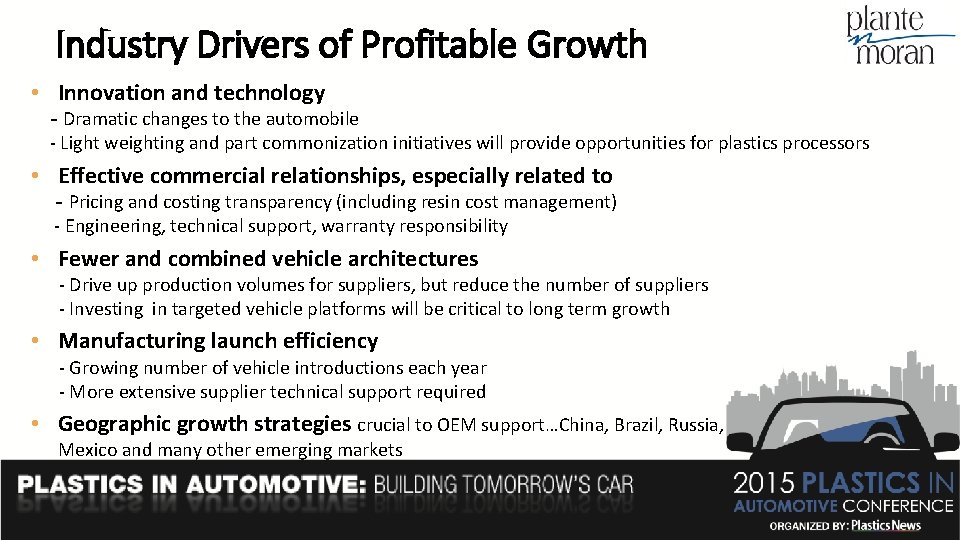
Industry Drivers of Profitable Growth • Innovation and technology - Dramatic changes to the automobile - Light weighting and part commonization initiatives will provide opportunities for plastics processors • Effective commercial relationships, especially related to - Pricing and costing transparency (including resin cost management) - Engineering, technical support, warranty responsibility • Fewer and combined vehicle architectures - Drive up production volumes for suppliers, but reduce the number of suppliers - Investing in targeted vehicle platforms will be critical to long term growth • Manufacturing launch efficiency - Growing number of vehicle introductions each year - More extensive supplier technical support required • Geographic growth strategies crucial to OEM support…China, Brazil, Russia, Mexico and many other emerging markets
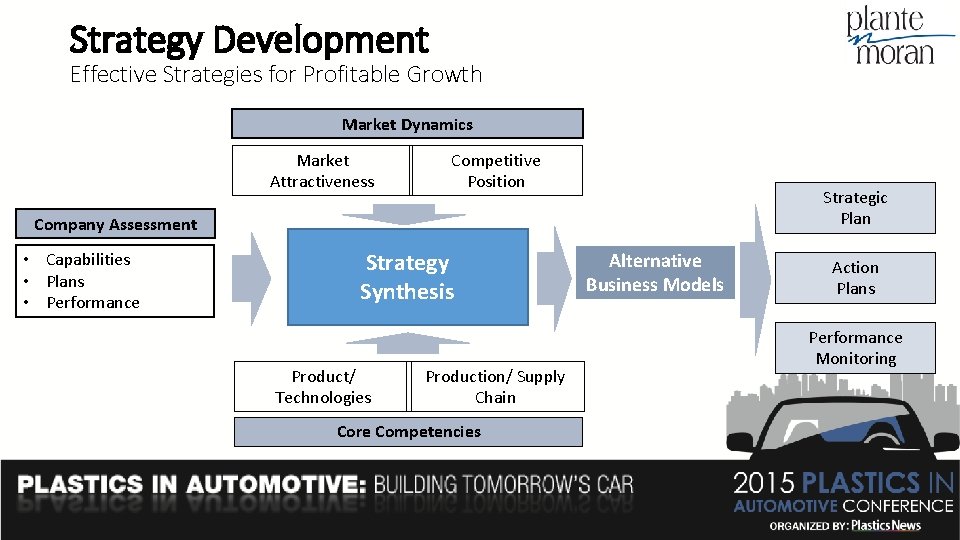
Strategy Development Effective Strategies for Profitable Growth Market Dynamics Market Attractiveness Competitive Position Strategic Plan Company Assessment • Capabilities • Plans • Performance Strategy Synthesis Product/ Technologies Production/ Supply Chain Core Competencies Alternative Business Models Action Plans Performance Monitoring
Daron Gifford • 248. 223. 3709 • Daron. Gifford@plantemoran. com Jeff Mengel • 312. 602. 3515 • Jeff. Mengel@plantemoran. com Ted Morgan • 248. 223. 3575 • Ted. Morgan@plantemoran. com
- Slides: 16