Drives Profits Drives EPS Drives Price Acid Test


- Slides: 7
Drives Profits Drives EPS Drives Price
Acid Test - Beginner “Acid Test “ # 1: Are Sales, Pre-Tax Profits & Earnings Per Share Up, Straight and Parallel? Check the graph on Tab#1 “Acid Test “ # 2: Is company doing better than last year (percent change 5% or better)? Check the Recent quarterly figures box to the right of graph “Acid Test “ # 3: Is Company Making Money (Profit Margin)? Check Data box below graph (Pre-tax Profit (PTP)) Compare last Fiscal Year to 5 year average – Is it higher? Conclusion: Do the stocks you see pass all 3 Acid Tests?
Acid Test - Intermediate “Acid Test “ # 1: Are Sales, PTP & EPS Up, Straight and Parallel for the last 5 years? Check the graph on Tab#1 “Acid Test “ # 2: Is the % of change for sales and EPS equal to or better than that for company size? Check company data last year and turn Millions into Billions Sales Growth Targets: “Acid Test “ # 3: Large Co (>$10 B/yr. ) = 5%-7% Med Co ($1 B-$10 B) = 7%-12% Small Co (< $1 B) = 12% + Is Company Making Money (Profit Margin vs competition)? Check Tab #1 and choose compare peers and check graph Return on Equity (last 5 years) 15% or more - compare last year to 5 year average Debt to Capital (last 5 years) Is it down - compare last year to 5 year average Conclusion: Do the stocks you see pass all 3 Acid Tests?
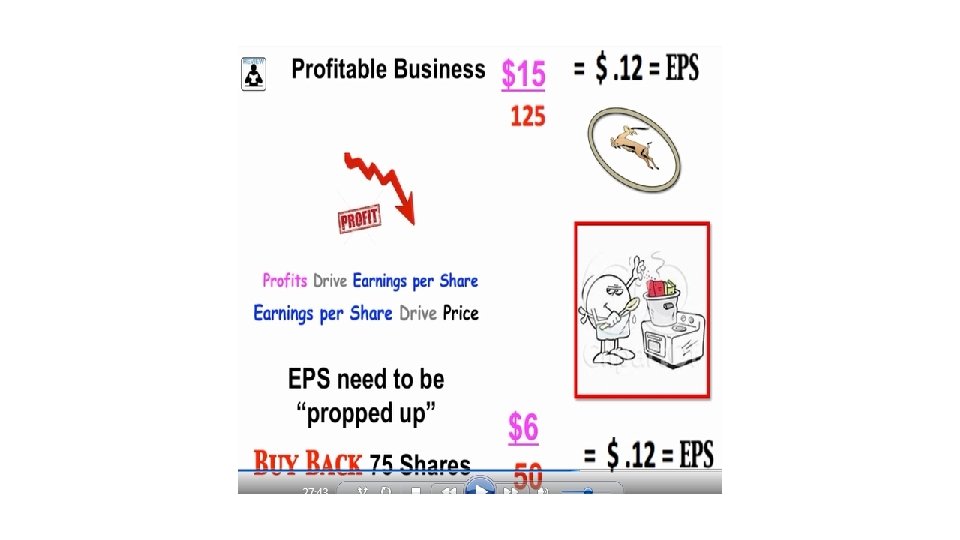
Acid Test - Advanced “Acid Test “ # 1: Are Sales, PTP & EPS Up, Straight and Parallel for the last 4 quarters? Check the graph on Tab#1 “Acid Test “ # 2: Check Data box below graph PTP, last 5 years, for any dips. If yes… Find percent change by going to profit (Tab #3) quarterly, Zero Growth, last five years Touch on sales and EPS to remove and touch on Pre-tax profit to add Is the line trending up, straight or down? Find last dot and hover to get % change If profit margin percent is low and profit drives EPS which is much higher than something else is happening. TIME TO INVESTIGATE! If company is propping up EPS by buying back shares you can check on Tab #1 Click on Shares outstanding to right of graph to get visual. To get data, click on EPS green judgement box to bring up preferred procedure Click on Historical data tab on right for Diluted shares out and check out last 4 qtrs. Decrease means shares are being bought back
Acid Test - Advanced “Acid Test “ # 3: Look for trailing 4 quarter trend (Trend is our friend) Go to Tab #3 quarterly data tab Touch on sales and EPS to remove and touch on Pre-tax profit to add In the Data output click on Trailing 4 quarters, zero growth and last 5 years only. Where is the graph line going, what are the percent change numbers going? Has the trend been going up, down or even…That is the trend Conclusion: Do the stocks you see pass all 3 Acid Tests for Beginner, Intermediate and Advanced? If yes, continue your study, If no, stop put up barbed wire and discard.