Driver Diagram Examples Includes template and definitions Driver


- Slides: 11
Driver Diagram Examples Includes template and definitions
Driver Diagram Definitions: • A Driver Diagram is an improvement tool used to organize theories and ideas in an improvement effort. It displays visually, our theory about why things are the way they are and/or potential areas we can leverage to change the status quo. The driver diagram is often used to scope or size a project and to clarify the plan for reaching the aim. • Primary Drivers: major processes, operating rules, or structures that will contribute to moving towards the aim • Secondary Drivers: elements or portions of the primary drivers. The secondary drivers are system components necessary in order to impact primary drivers, and thus reach project aim. • Specific changes /Change concepts: Specific changes are concrete actionable ideas to take to testing. Change concepts are broad concepts (e. g. move steps in the process closer together) that are not yet specific enough to be actionable but which will be used to generate specific ideas for change. – Note: measures can be indicated on the DD as it becomes more mature.
Driver Diagram
Driver Diagram John W. Young, MBA RN National Association of Public Hospitals and Health System
Ann Brown, Wave 23
Improving Colon Cancer Screening at Internal Medicine Faculty Practice Specific Changes: Primary Drivers: Secondary Drivers: Aim Decrease • Waiting time between referral and colonoscopy • Waiting time for results of colonoscopy Increase • Colon cancer screening rates • Direct colonoscopy referrals through EMR • Results of colon cancer screening in EMR Calie Santana, Wave 21 Identify patients who should have colon cancer screening and have not received it Increase access to colonoscopie s • Link colonoscopy database with EMR for automatic result reporting into the flowsheet Preventive care EMR flowsheet (individual patients @ each visit) Whole panel performance reports Use Direct colonoscopy Navigators (facilitated communication, preps, directions, scheduling) Referral to Direct colonoscopy from inside the EMR Facilitate delivery of evidencebased care in colon cancer screening Communication/care coordination between GI and referring PCP (f/u interval, pathology findings) • Generate bimonthly reports of colon cancer screening rates and actions taken by providers and work toward goal rate of 80% • Create a referral form for Direct colonoscopy in the EMR • Create a benchmark for time from referral to colonoscopy schedule (access to test), and time from referral to Navigator completed all necessary steps (efficiency of program) and work towards benchmark goal • Review current workflowof result communication in the EMR • Develop workflow that minimizes data entry by 9 -22 -07 referring provider IHI
Improve Severe Sepsis Care and Reduce Sepsis Mortality Primary Drivers: Desired Outcomes: Decrease • Mortality • Complications • Costs • LOS Improve • Sepsis/Severe Sepsis Bundle Compliance • Early recognition of severe sepsis/septic shock • Recognizable, reliable language standards for sepsis care Identify severe sepsis early in ED patients Provide appropriate, reliable and timely care to patients with sepsis/severe sepsis using evidence-based therapies Coordination of treatment services Create team process to support sepsis therapies Josephine Melchione, Wave 21 Secondary Drivers: Uniform Sepsis Screening/Sepsis Screening tool Education/communication to frontline staff Sepsis Algorithm and Standard Order Set Bundle elements: Antibiotics within 180 mins and after blood cultures Serum lactate w/in 30 min Fluid challenge eligibility/delivery Contingency team for 1 st 24 hours of sepsis trigger Organized team methodology for patient care transitions Pharmacy Caregiver communication Lab Specific Changes: ? ?
Primary Drivers Knowledge of medications Secondary Drivers Discussing medication benefits and side effects Eliciting concerns and questions Effective communication Communication aids for aphasic patients Change Concepts Specific Change Ideas Focus on the outcome to a customer Script to aid discussion Listen to customers Shared decision making model Reach agreement on expectations Coach customers to use a product/service Optimize level of inspection SALT assessment of identify best means of communication Use reminders Patient/carer satisfaction and experience of medication discussions and usage Follow up compliance check(need to decide OPD, telephone call, home visit, questionnaire, etc) Involve carers Aim Improve Medication compliance in stroke patients by 50% Medication Delivery System For those with cognitive impairment For those with functional limitations Use differentiation Use constraints Use affordances Patient choice Coordination of care Asan Akpan, Wave 21 Document decision of patient/carer Standardization Incorporate into weekly MDT meeting Desensitize Ensure medications dose, frequency, route and patient decisions stated on discharge letter to GP Improve predictions Develop contingency plans Manage uncertainty, not task Match amount to need Documentation of how medications will be taken and delivered Document in case notes Document in discharge letter to GP
Driver Diagram for Reducing In-Patient Falls Aim Reduce Inpatient Falls on 4 Cand 6 WReduce falls to <3. 5/1000 patient days and reduce moderate or higher harm from falls to <0. 1/1000 patient days Outcome Measures -Patient days between falls -Patient days between a harmful fall -The rate of falls per 1000 patient days -The rate of harmful falls per 1000 patient days -$ revenue loss avoided due to fall reduction Adapted from Gavin Sells, NHS Scotland, Wave 24 2011/2012 Used with permission. Primary Drivers Reliable Assessment Process Measure % Pts with falls risk assessment every 8 hrs. Reliable Care Process Measure % of patients with evidence of hourly rounding Patient and Family Centered Care Process Measure: % Pts who can verbalize their role in fall prevention Patient Condition Secondary Drivers Good/reliable tools for assessment Staff trained and know how to use assessment tools Timely assessment Specific Changes to Test Staff awareness/education Falls noticed board/story board Care plans are easy to use Fallsafe Care Bundle Care plans regularly updated Use of pressure pads Appropriate level of monitoring/supervision of patients Willingness of patient and carers to cooperate cctv or mirrors in corridors Use of sitters for some patients Physical strength/stability Mental health Frailty Slipper socks Patient understanding of their own abilities New signs on doors easier to read Patient understanding of their own abilities
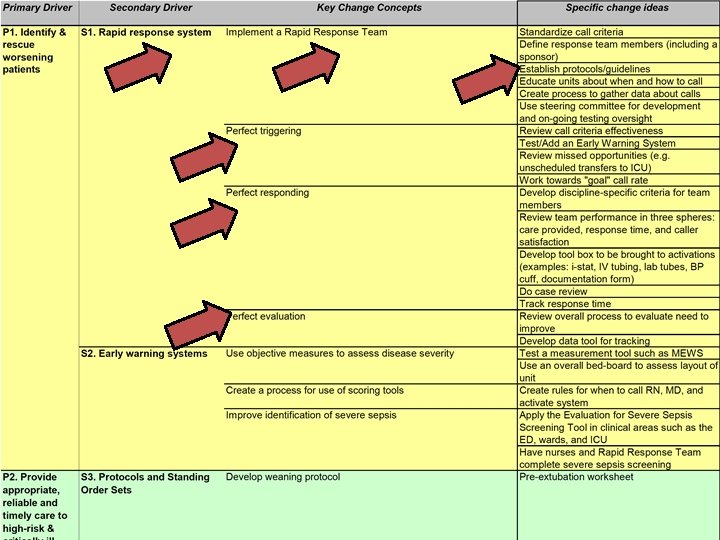
Driver Diagram: Improving Outcomes for High-Risk and Critically Ill Patients Specific Changes: Primary Drivers: Secondary Drivers: Identify & rescue worsening patients Desired Outcomes: Decrease Provide appropriate, reliable and timely care to high-risk and critically ill patients using evidencebased therapies • Mortality • Complications • Costs Improve • Satisfaction Create highly effective multidisciplinary team Integrate patient & family into care so they receive care they want Rapid Response System Early Warning System Protocols and Standing Orders Bundles Care planning Reliable communication Family involvement Clarification of wishes End of life care Consistent care delivery Flow Driver Diagram IG: PP. 286, 412, 429 Develop an infrastructure that promotes quality care See next page Leadership Financial Stewardship Example: Another way to organize change package: Driver Diagram