
Draft staffing norms and standards for districts Ministers

- Slides: 6
Draft staffing norms and standards for districts Minister’s meeting 26 AUGUST 2016
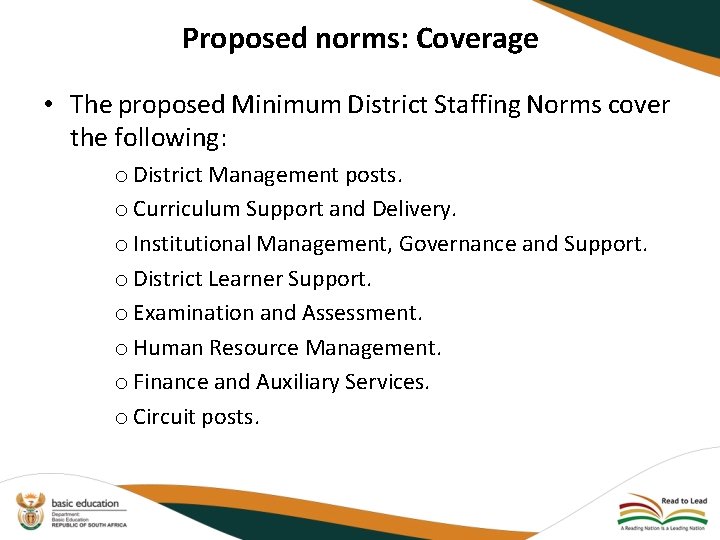
Proposed norms: Coverage • The proposed Minimum District Staffing Norms cover the following: o District Management posts. o Curriculum Support and Delivery. o Institutional Management, Governance and Support. o District Learner Support. o Examination and Assessment. o Human Resource Management. o Finance and Auxiliary Services. o Circuit posts.
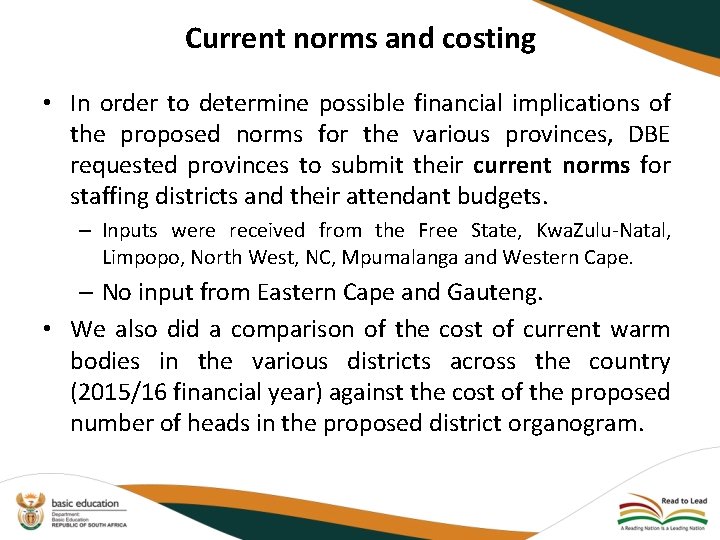
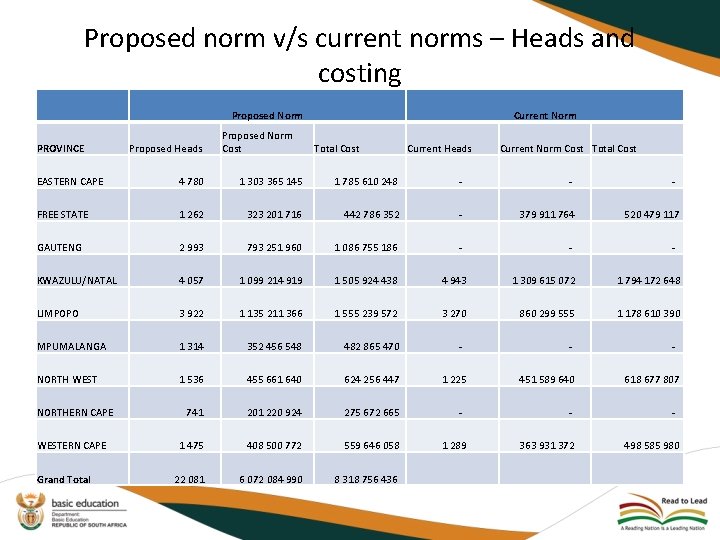
Current norms and costing • In order to determine possible financial implications of the proposed norms for the various provinces, DBE requested provinces to submit their current norms for staffing districts and their attendant budgets. – Inputs were received from the Free State, Kwa. Zulu-Natal, Limpopo, North West, NC, Mpumalanga and Western Cape. – No input from Eastern Cape and Gauteng. • We also did a comparison of the cost of current warm bodies in the various districts across the country (2015/16 financial year) against the cost of the proposed number of heads in the proposed district organogram.
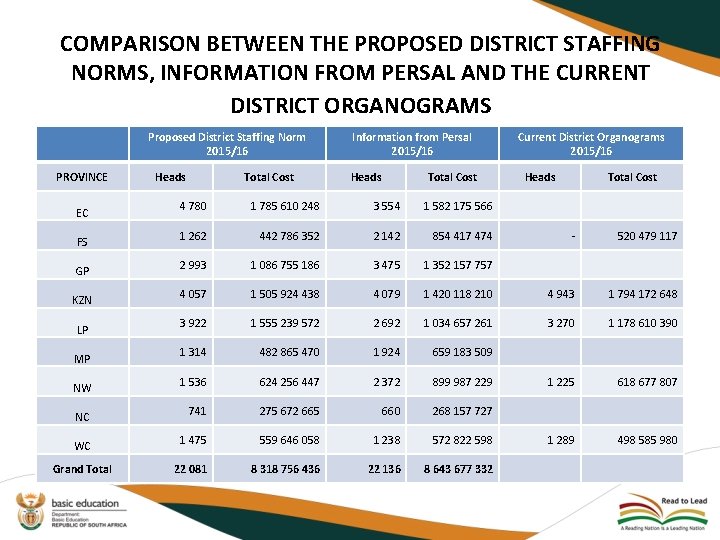
COMPARISON BETWEEN THE PROPOSED DISTRICT STAFFING NORMS, INFORMATION FROM PERSAL AND THE CURRENT DISTRICT ORGANOGRAMS Proposed District Staffing Norm 2015/16 PROVINCE EC FS GP KZN LP MP NW NC WC Grand Total Heads Total Cost Information from Persal 2015/16 Heads Total Cost 4 780 1 785 610 248 3 554 1 582 175 566 1 262 442 786 352 2 142 854 417 474 2 993 1 086 755 186 3 475 1 352 157 757 4 057 1 505 924 438 4 079 3 922 1 555 239 572 1 314 Current District Organograms 2015/16 Heads Total Cost - 520 479 117 1 420 118 210 4 943 1 794 172 648 2 692 1 034 657 261 3 270 1 178 610 390 482 865 470 1 924 659 183 509 1 536 624 256 447 2 372 899 987 229 1 225 618 677 807 741 275 672 665 660 268 157 727 1 475 559 646 058 1 238 572 822 598 1 289 498 585 980 22 081 8 318 756 436 22 136 8 643 677 332
Proposed norm v/s current norms – Heads and costing Proposed Norm PROVINCE Proposed Heads Proposed Norm Cost Current Norm Total Cost Current Heads Current Norm Cost Total Cost EASTERN CAPE 4 780 1 303 365 145 1 785 610 248 - - FREE STATE 1 262 323 201 716 442 786 352 - 379 911 764 520 479 117 GAUTENG 2 993 793 251 960 1 086 755 186 - - KWAZULU/NATAL 4 057 1 099 214 919 1 505 924 438 4 943 1 309 615 072 1 794 172 648 LIMPOPO 3 922 1 135 211 366 1 555 239 572 3 270 860 299 555 1 178 610 390 MPUMALANGA 1 314 352 456 548 482 865 470 - - NORTH WEST 1 536 455 661 640 624 256 447 1 225 451 589 640 618 677 807 NORTHERN CAPE 741 201 220 924 275 672 665 - - WESTERN CAPE 1 475 408 500 772 559 646 058 1 289 363 931 372 498 585 980 Grand Total 6 072 084 990 8 318 756 436 22 081