Draft Maine GHG Inventory 1990 2000 Jennifer Weeks


- Slides: 14
Draft Maine GHG Inventory, 1990 -2000 Jennifer Weeks, NESCAUM December 16, 2003
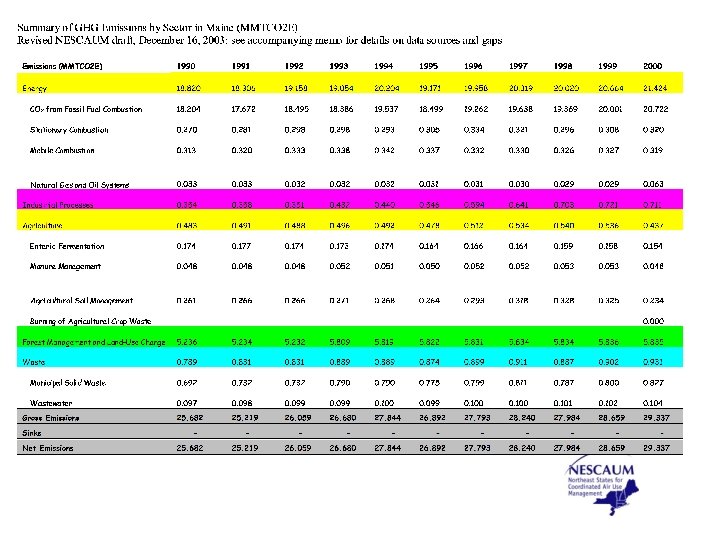
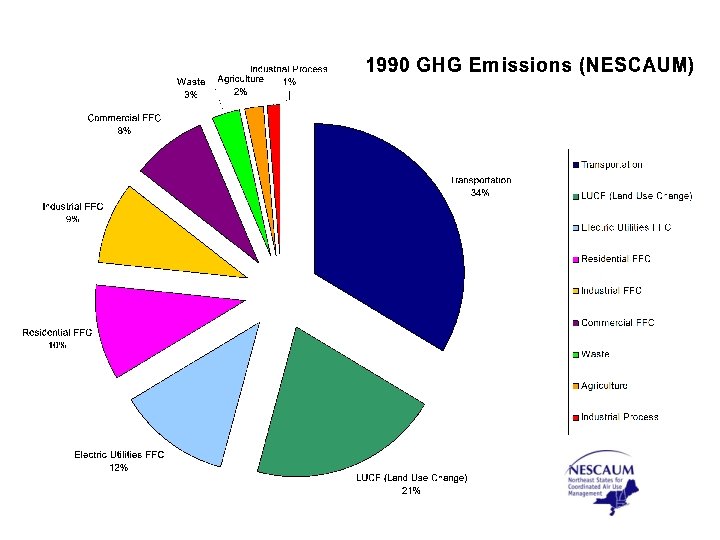
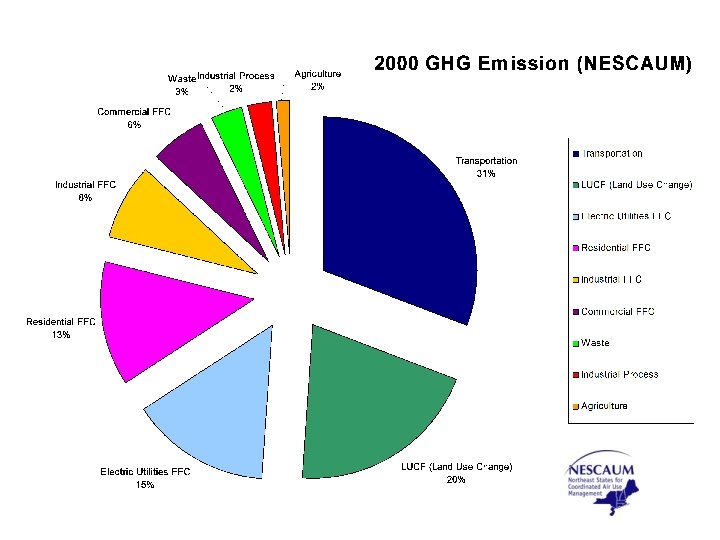
ME GHG Emissions, 1990 -2000 • 1990: 25. 68 MMTCO 2 E • 2000: 29. 34 MMTCO 2 E (net increase = 3. 66 MMTCO 2 E, +14. 2%)
Fossil Fuel Combustion • FFCO 2 is ~70% of state GHG emissions • Transportation dominates • Oil accounts for ~90% of FFCO 2 emissions throughout decade • Electric power estimate includes power from CHP facilities
Fossil Fuel Combustion, cont. • Other gases from fossil fuel combustion (CH 4, N 2 O) in mobile and stationary sources account for ~2. 5% of total ME GHG emissions
Industrial Processes • Emissions rise from 1. 4% of inventory in 1990 to ~2. 4% in 2000, partially from HFCs, PFCs, and SF 6; HFC/PFC use likely to keep rising as U. S. phases out ozonedepleting substances • Sources include refrigeration, insulation, semiconductor manufacturing
Natural Gas and Oil Activities • Natural gas transmission and distribution are only ME activities (no production or processing) • Emissions ~0. 2% of total state GHGs/year in 2000 (not much pipeline and low gas penetration in ME)
Landfills and Waste Combustion • Accounts for 2 -3% of state GHG emissions throughout decade • More data needed on MSW imports/exports to see what fractions ME is sending out of state and receiving from other states • Landfill methane recovery opportunities? (no Federal information available)
Municipal Wastewater Treatment • About 0. 3% of annual GHG emissions through 1990 s • Wastewater emissions from pulp and paper industry should be considered – need annual production data (Already addressed)
Agriculture • Includes enteric fermentation, manure management, soil management (fertilizer application, growth of nitrogen-fixing plants, etc. ) • Total agriculture emissions <2% of annual state emissions throughout decade
Land Use Change and Forestry • Includes practices that alter land use (e. g. , clearing forests, developing wetlands) or affect the amount of carbon or biomass in existing forest or soil stocks (liming of soils, landfilling yard waste, etc. ) • Major activity for ME is forest carbon flux (uptake of carbon in plants, soils, forest floor and debris); based on U. S. Forest Service estimates of carbon stored in forests
Land Use/Forestry, cont. • EPA inventory software estimates forests and land-use change to be a major GHG source for ME (20 -25% of annual GHG emissions throughout decade); may reflect many factors, inc. harvest rates, age of forest stocks, data collection methods • ME DEP is exploring alternate estimation methodologies