
Dont Panic A Critique of Catastrophic ManMade Global
Don’t Panic! A Critique of Catastrophic Man-Made Global Warming Theory
2 Five Key Climate Questions • Is the world warming? • Is that warming due to man’s CO 2? • Will future man-made warming be substantial? • Will we see catastrophic effects from warming? • Do CO 2 abatement laws like AB 32 make sense?
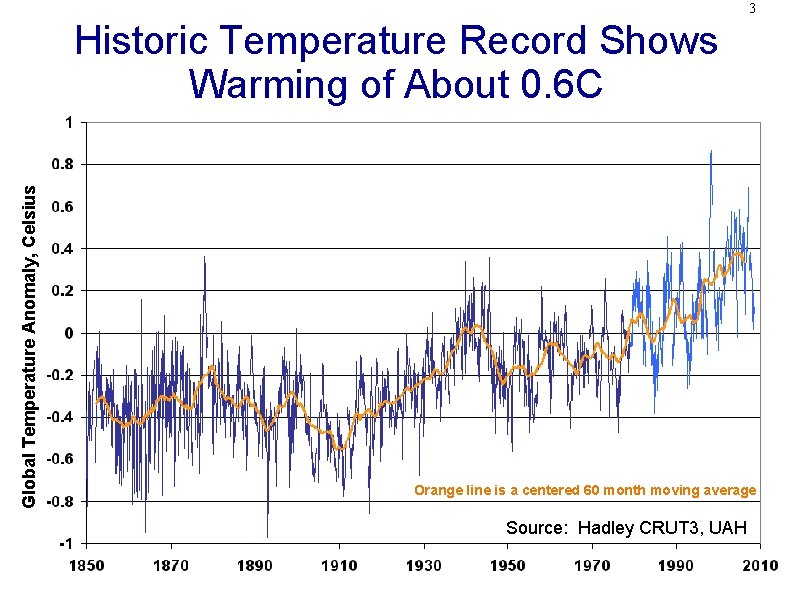
3 Global Temperature Anomaly, Celsius Historic Temperature Record Shows Warming of About 0. 6 C Orange line is a centered 60 month moving average Source: Hadley CRUT 3, UAH
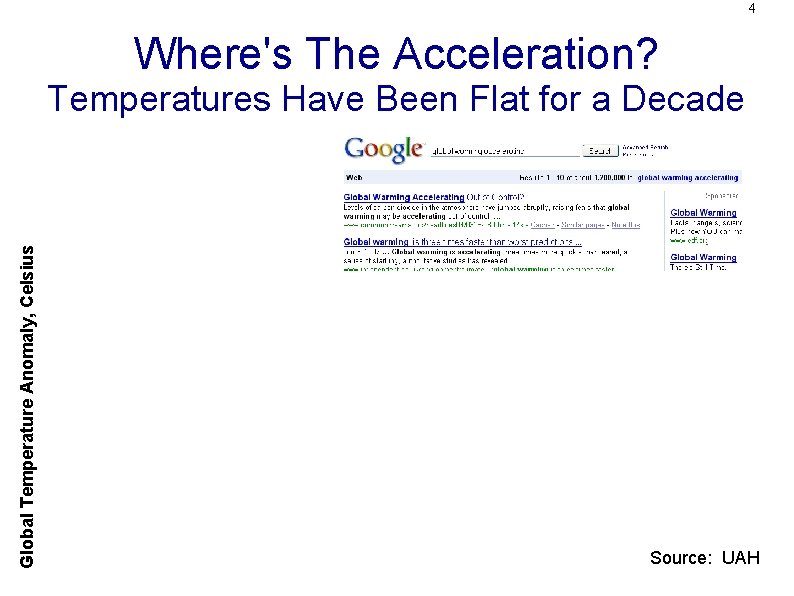
4 Where's The Acceleration? Global Temperature Anomaly, Celsius Temperatures Have Been Flat for a Decade Source: UAH
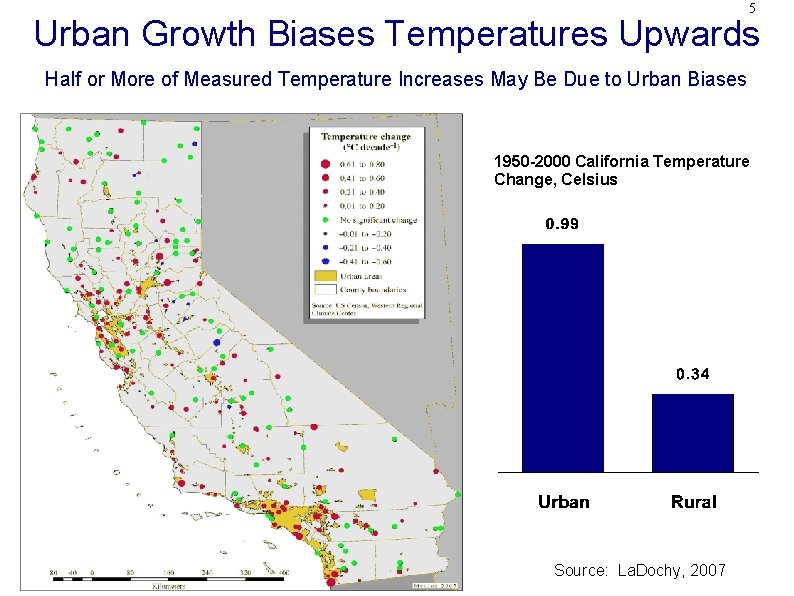
5 Urban Growth Biases Temperatures Upwards Half or More of Measured Temperature Increases May Be Due to Urban Biases 1950 -2000 California Temperature Change, Celsius Source: La. Dochy, 2007
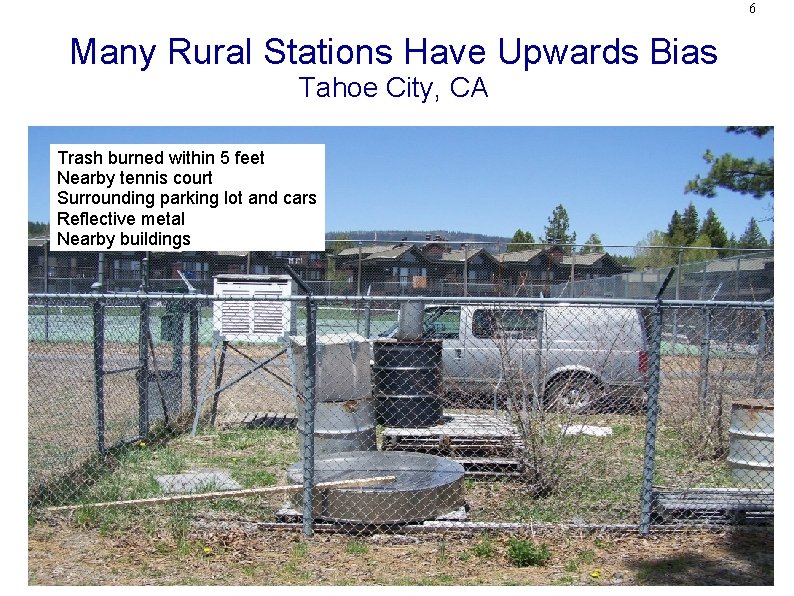
6 Many Rural Stations Have Upwards Bias Tahoe City, CA Trash burned within 5 feet Nearby tennis court Surrounding parking lot and cars Reflective metal Nearby buildings
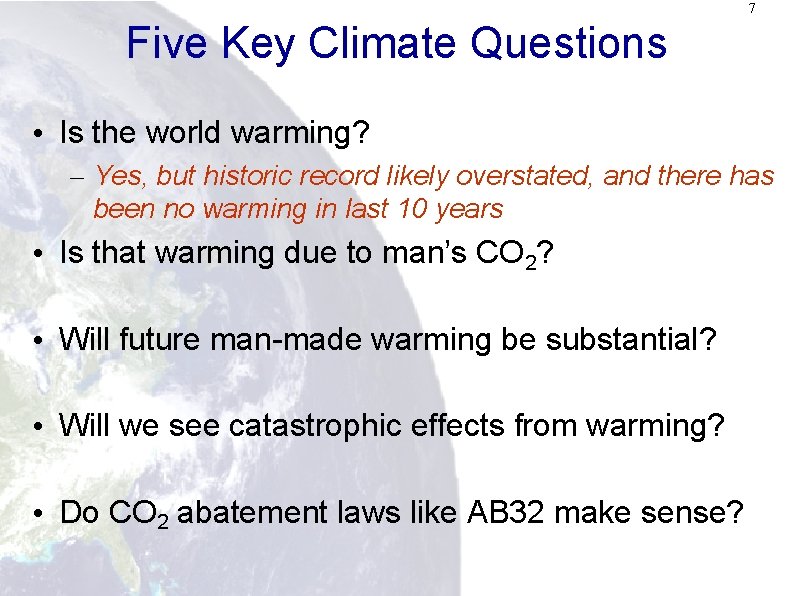
7 Five Key Climate Questions • Is the world warming? – Yes, but historic record likely overstated, and there has been no warming in last 10 years • Is that warming due to man’s CO 2? • Will future man-made warming be substantial? • Will we see catastrophic effects from warming? • Do CO 2 abatement laws like AB 32 make sense?
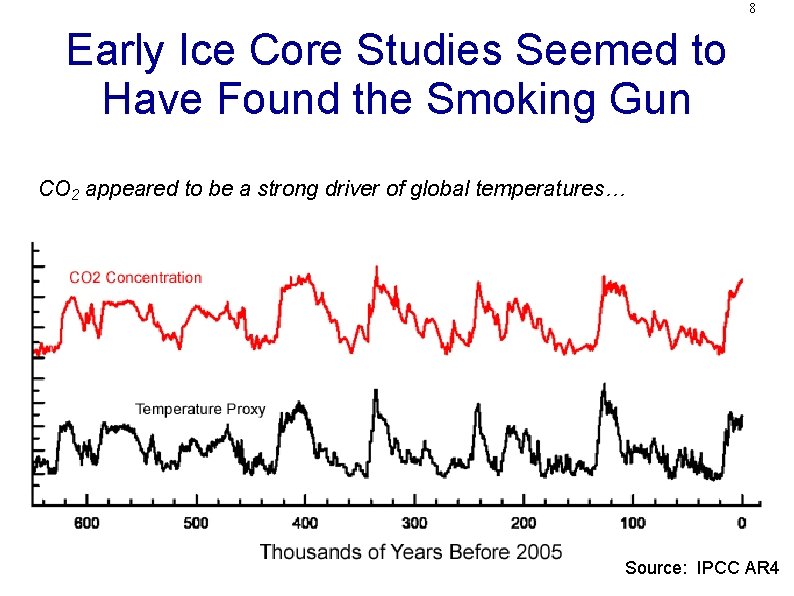
8 Early Ice Core Studies Seemed to Have Found the Smoking Gun CO 2 appeared to be a strong driver of global temperatures… Source: IPCC AR 4
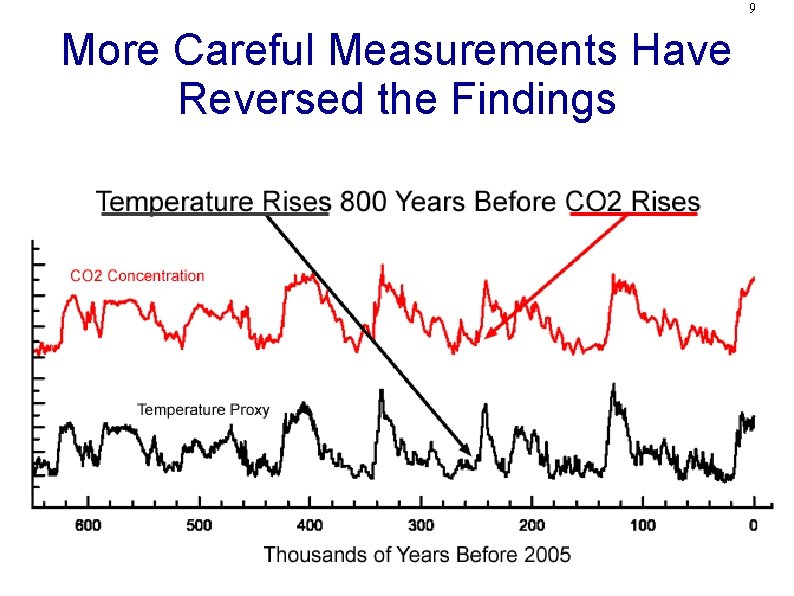
9 More Careful Measurements Have Reversed the Findings
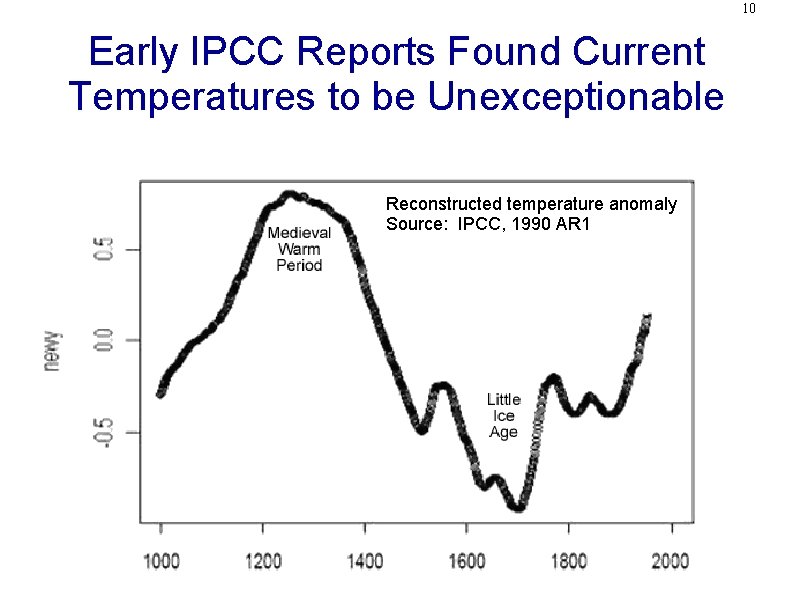
10 Early IPCC Reports Found Current Temperatures to be Unexceptionable Reconstructed temperature anomaly Source: IPCC, 1990 AR 1
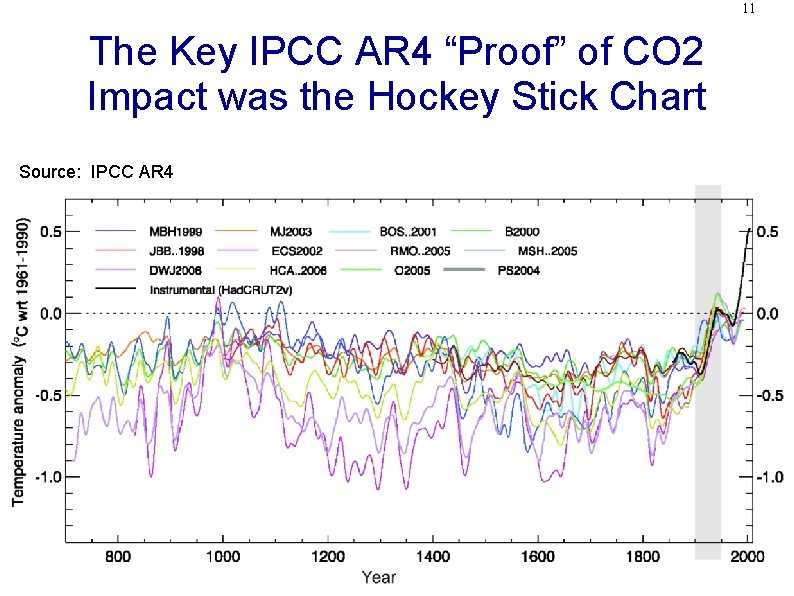
11 The Key IPCC AR 4 “Proof” of CO 2 Impact was the Hockey Stick Chart Source: IPCC AR 4
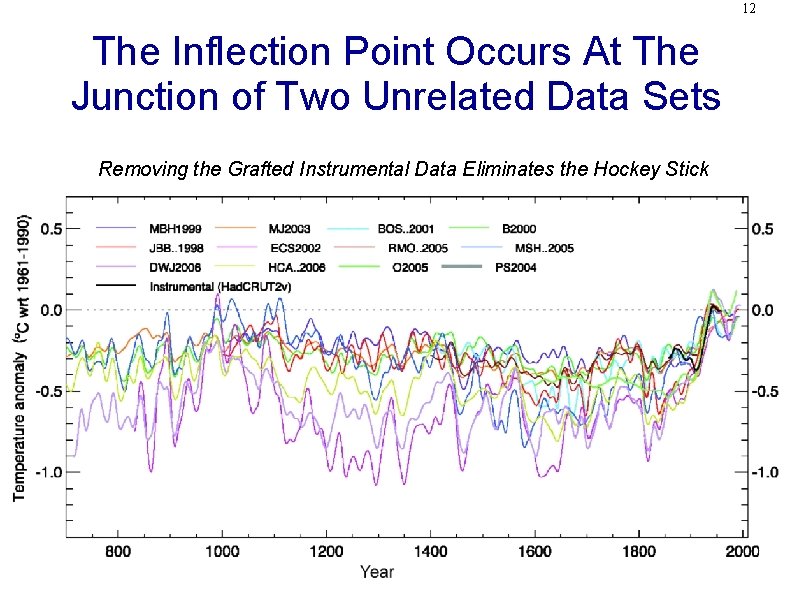
12 The Inflection Point Occurs At The Junction of Two Unrelated Data Sets Removing the Grafted Instrumental Data Eliminates the Hockey Stick
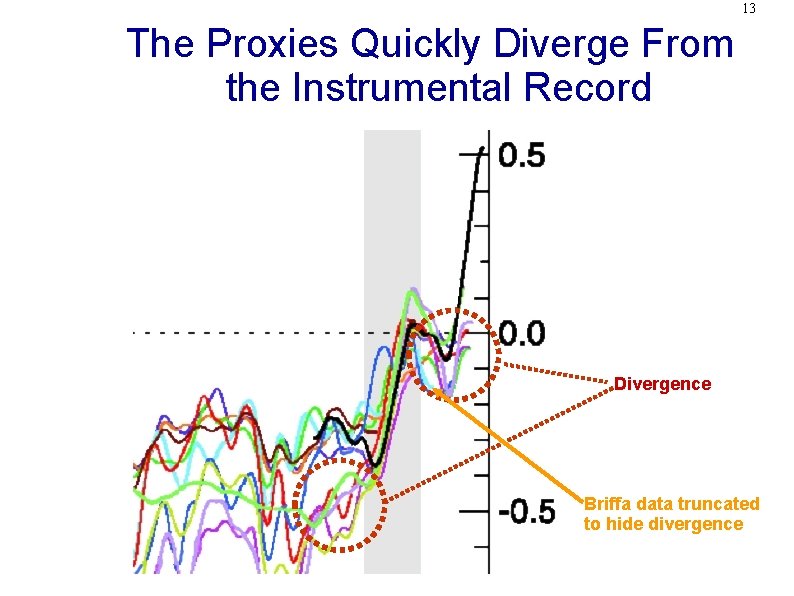
13 The Proxies Quickly Diverge From the Instrumental Record Divergence Briffa data truncated to hide divergence
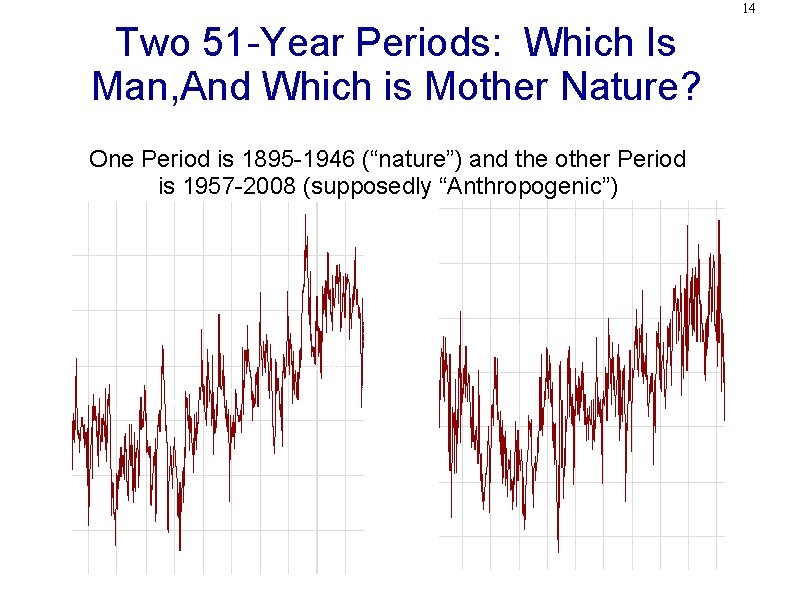
14 Two 51 -Year Periods: Which Is Man, And Which is Mother Nature? One Period is 1895 -1946 (“nature”) and the other Period is 1957 -2008 (supposedly “Anthropogenic”)
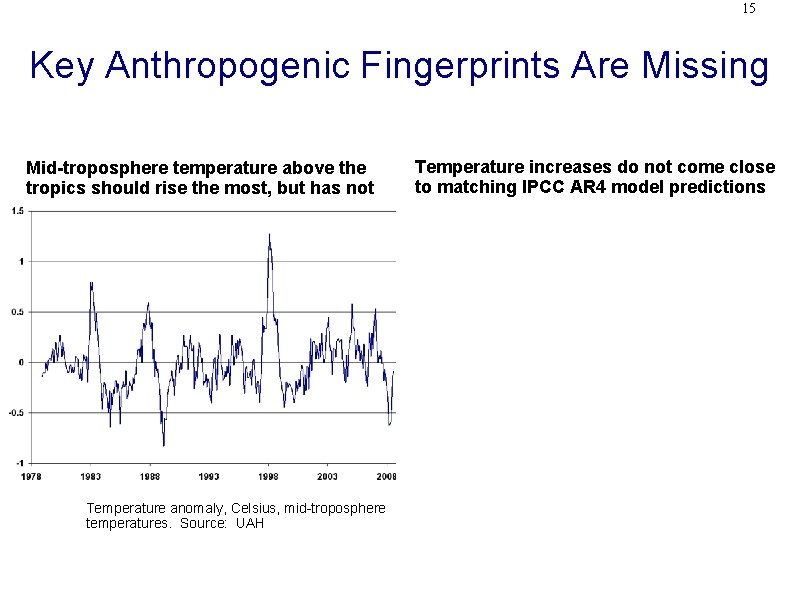
15 Key Anthropogenic Fingerprints Are Missing Mid-troposphere temperature above the tropics should rise the most, but has not Temperature anomaly, Celsius, mid-troposphere temperatures. Source: UAH Temperature increases do not come close to matching IPCC AR 4 model predictions
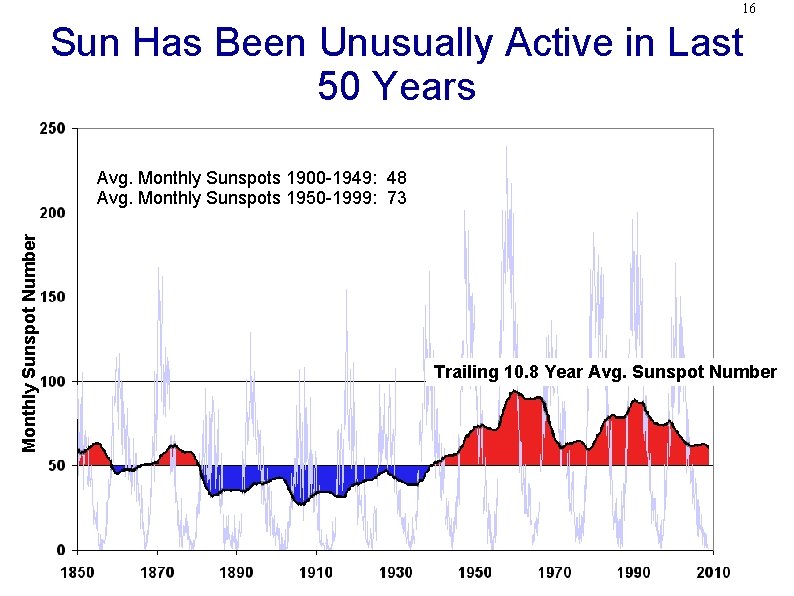
16 Sun Has Been Unusually Active in Last 50 Years Monthly Sunspot Number Avg. Monthly Sunspots 1900 -1949: 48 Avg. Monthly Sunspots 1950 -1999: 73 Trailing 10. 8 Year Avg. Sunspot Number
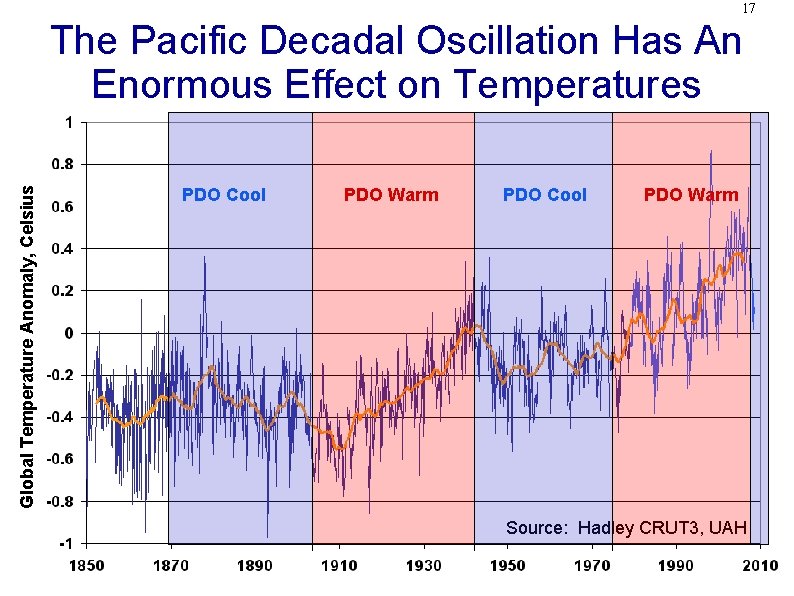
17 Global Temperature Anomaly, Celsius The Pacific Decadal Oscillation Has An Enormous Effect on Temperatures PDO Cool PDO Warm Source: Hadley CRUT 3, UAH
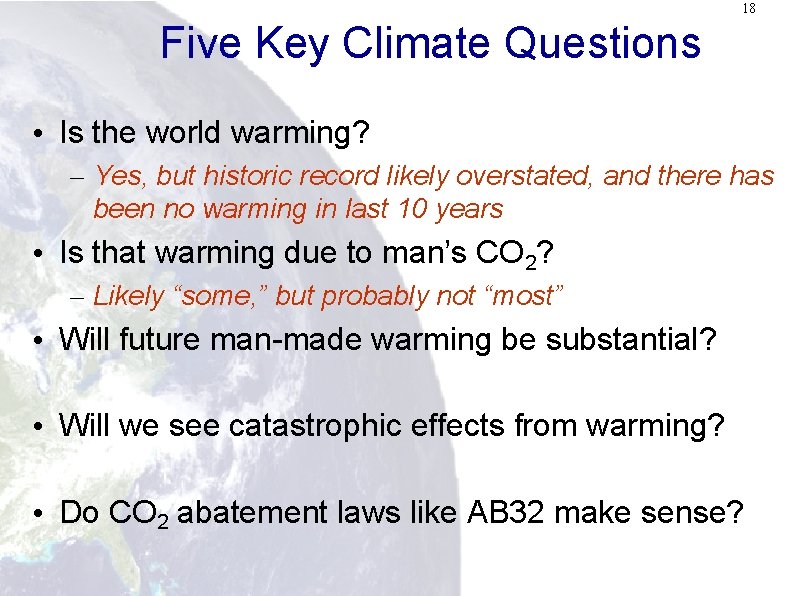
18 Five Key Climate Questions • Is the world warming? – Yes, but historic record likely overstated, and there has been no warming in last 10 years • Is that warming due to man’s CO 2? – Likely “some, ” but probably not “most” • Will future man-made warming be substantial? • Will we see catastrophic effects from warming? • Do CO 2 abatement laws like AB 32 make sense?
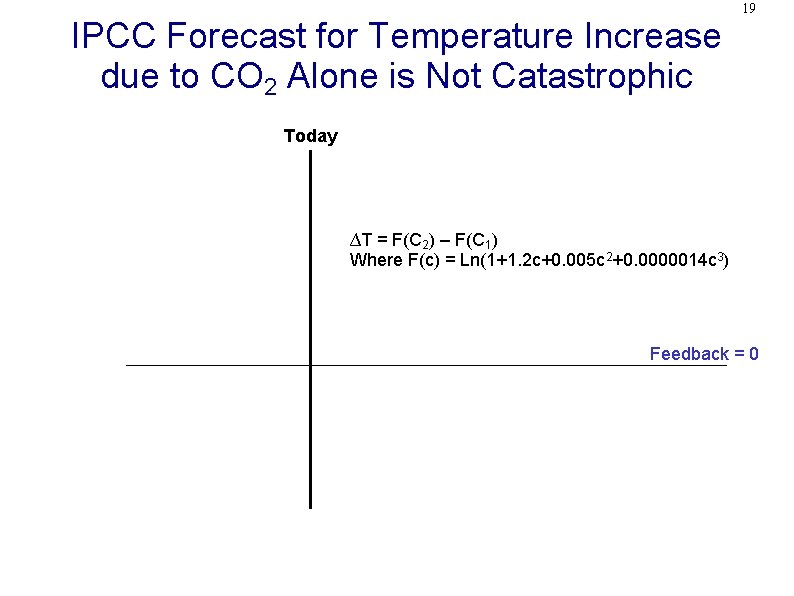
IPCC Forecast for Temperature Increase due to CO 2 Alone is Not Catastrophic 19 Today ∆T = F(C 2) – F(C 1) Where F(c) = Ln(1+1. 2 c+0. 005 c 2+0. 0000014 c 3) Feedback = 0
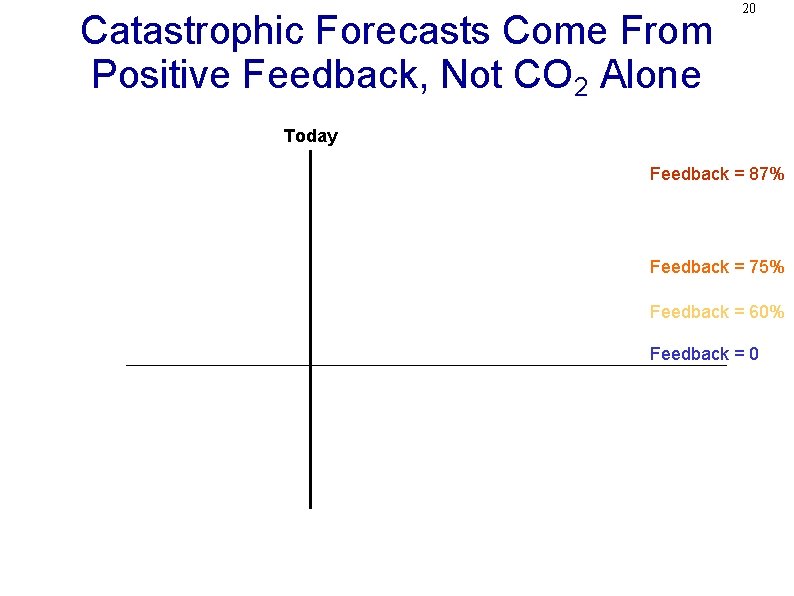
Catastrophic Forecasts Come From Positive Feedback, Not CO 2 Alone 20 Today Feedback = 87% Feedback = 75% Feedback = 60% Feedback = 0
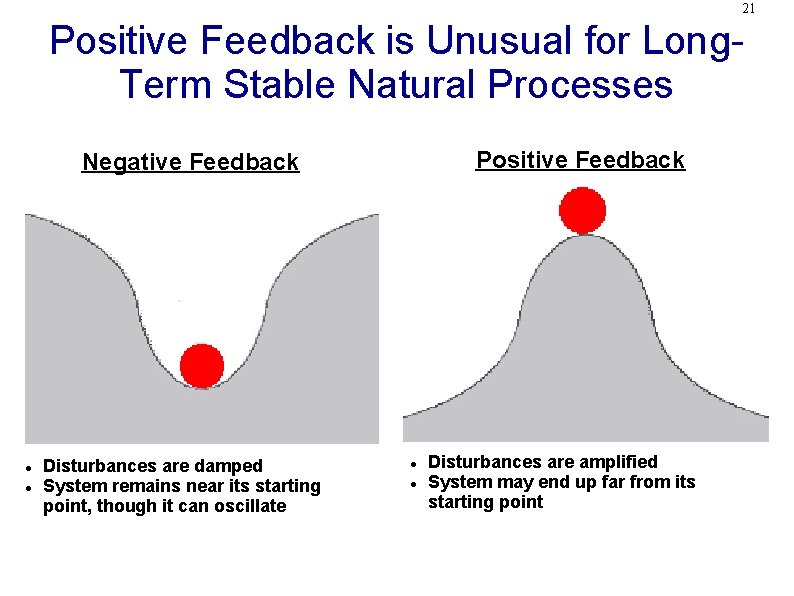
21 Positive Feedback is Unusual for Long. Term Stable Natural Processes Positive Feedback Negative Feedback Disturbances are damped System remains near its starting point, though it can oscillate Disturbances are amplified System may end up far from its starting point
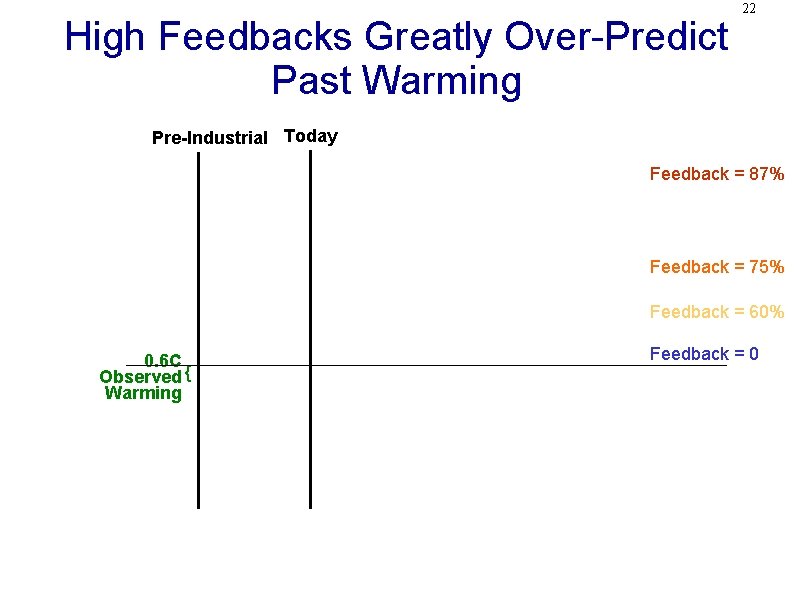
High Feedbacks Greatly Over-Predict Past Warming 22 Pre-Industrial Today Feedback = 87% Feedback = 75% Feedback = 60% 0. 6 C Observed { Warming Feedback = 0
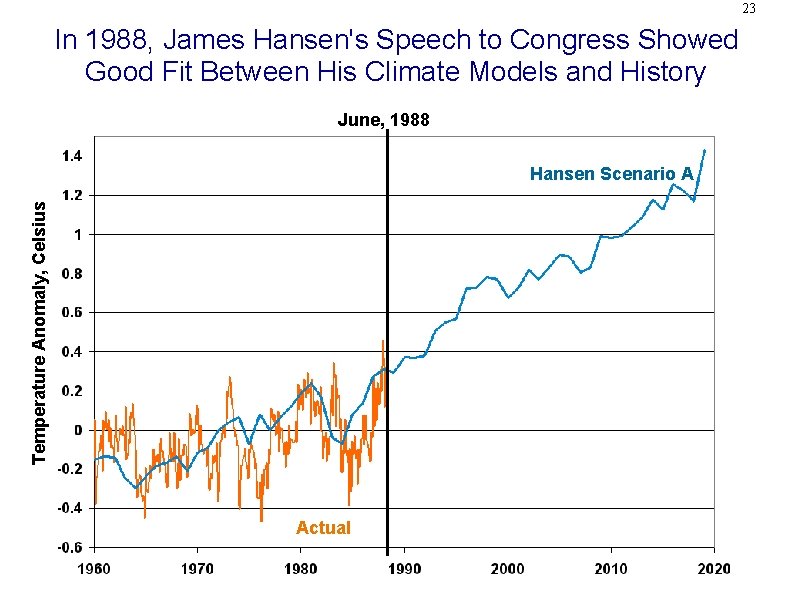
23 In 1988, James Hansen's Speech to Congress Showed Good Fit Between His Climate Models and History June, 1988 Temperature Anomaly, Celsius Hansen Scenario A Actual
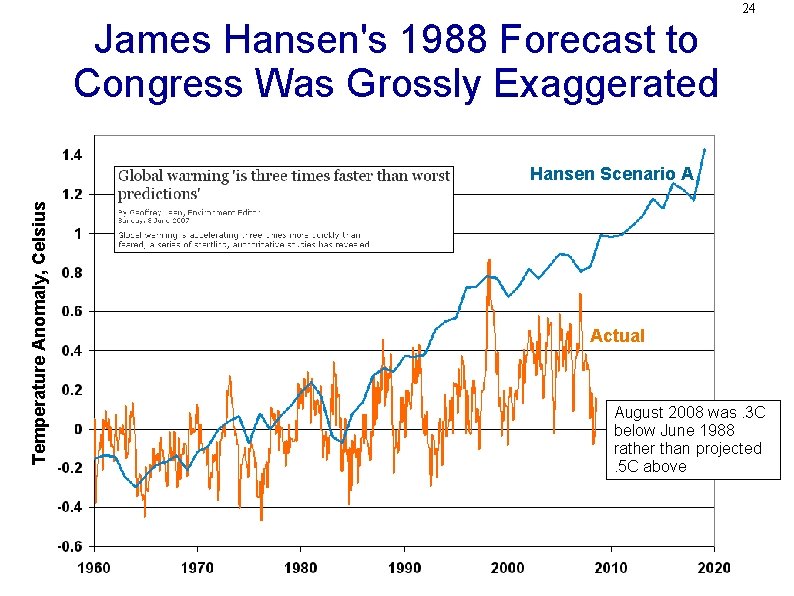
24 James Hansen's 1988 Forecast to Congress Was Grossly Exaggerated Temperature Anomaly, Celsius Hansen Scenario A Actual August 2008 was. 3 C below June 1988 rather than projected. 5 C above
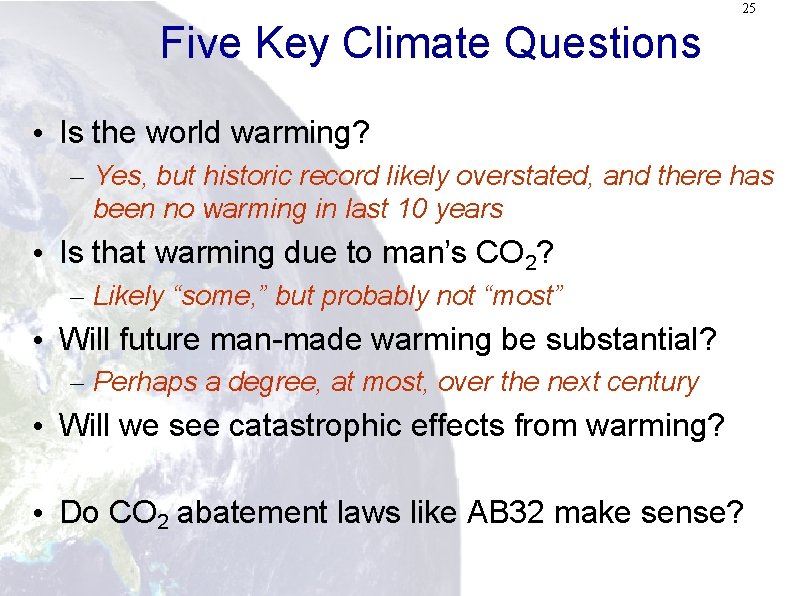
25 Five Key Climate Questions • Is the world warming? – Yes, but historic record likely overstated, and there has been no warming in last 10 years • Is that warming due to man’s CO 2? – Likely “some, ” but probably not “most” • Will future man-made warming be substantial? – Perhaps a degree, at most, over the next century • Will we see catastrophic effects from warming? • Do CO 2 abatement laws like AB 32 make sense?
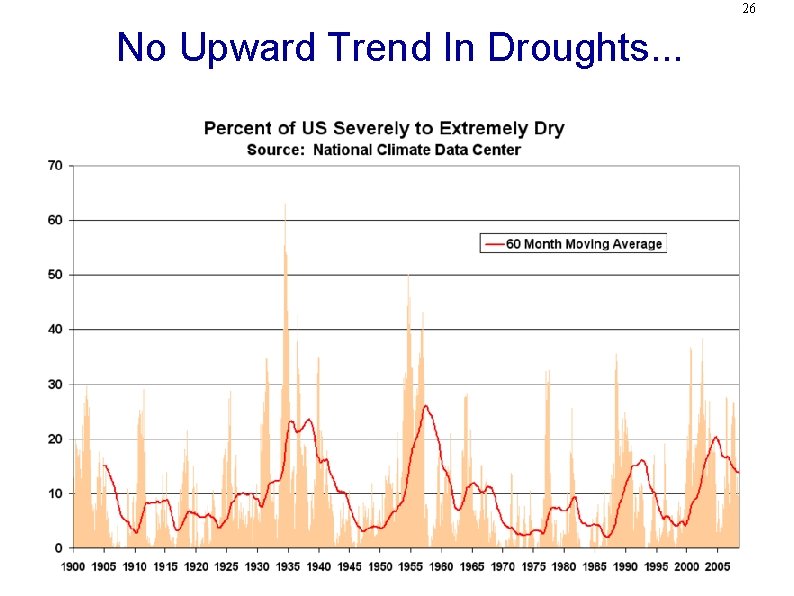
26 No Upward Trend In Droughts. . .
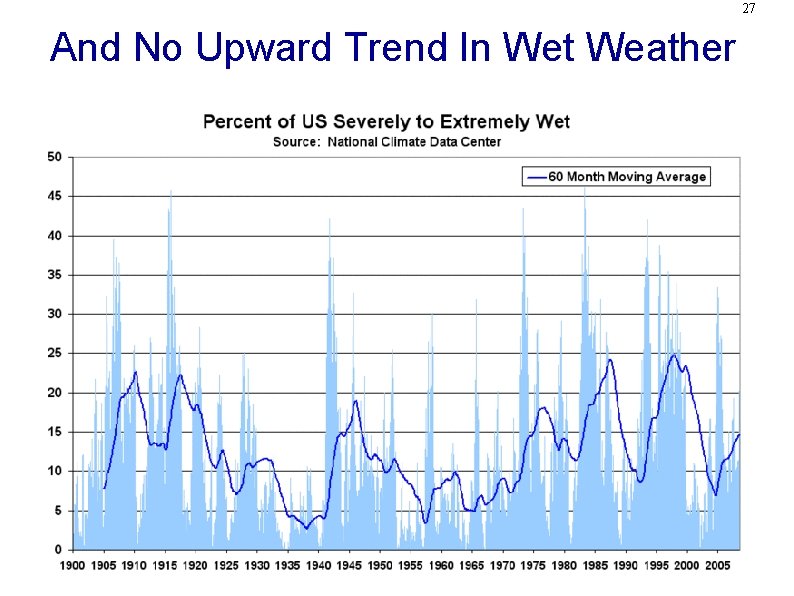
27 And No Upward Trend In Wet Weather
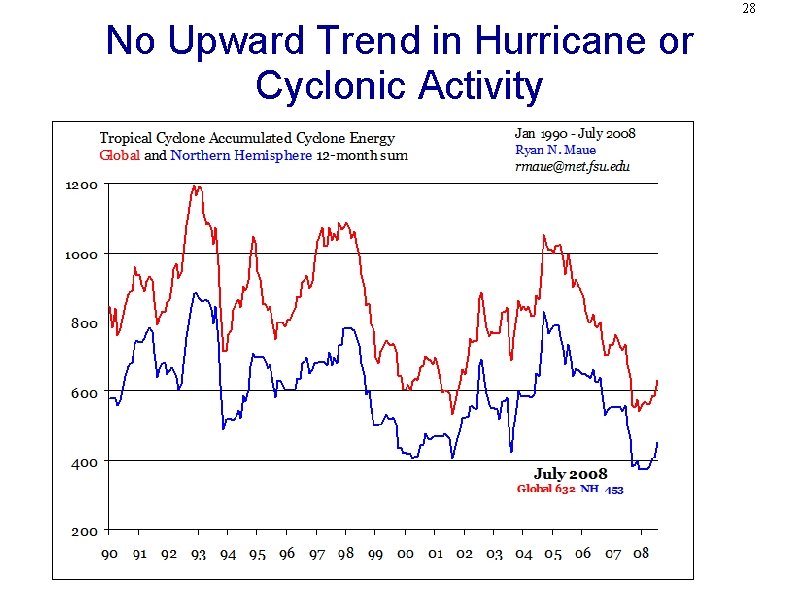
28 No Upward Trend in Hurricane or Cyclonic Activity
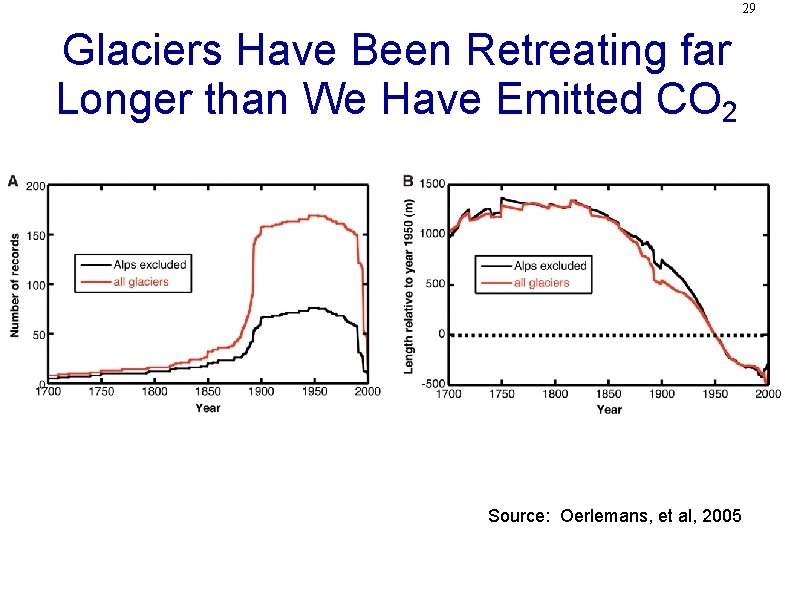
29 Glaciers Have Been Retreating far Longer than We Have Emitted CO 2 Source: Oerlemans, et al, 2005
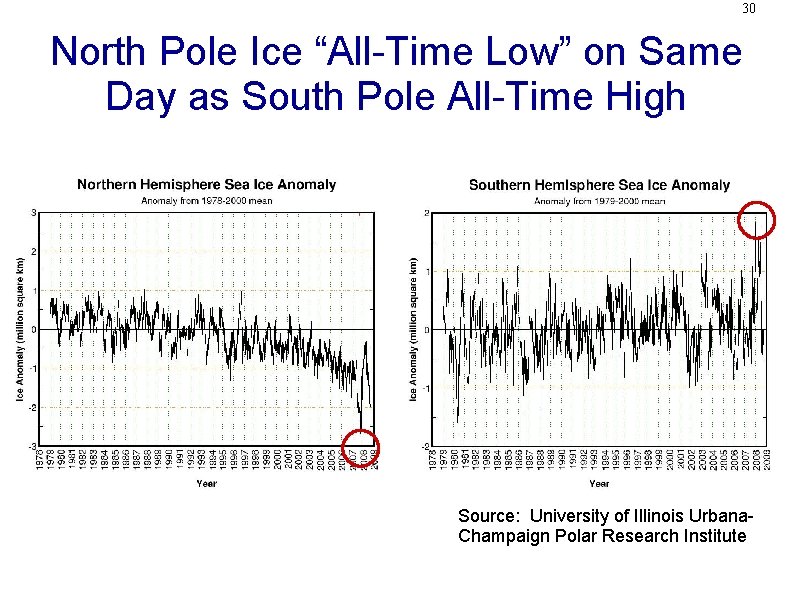
30 North Pole Ice “All-Time Low” on Same Day as South Pole All-Time High Source: University of Illinois Urbana. Champaign Polar Research Institute
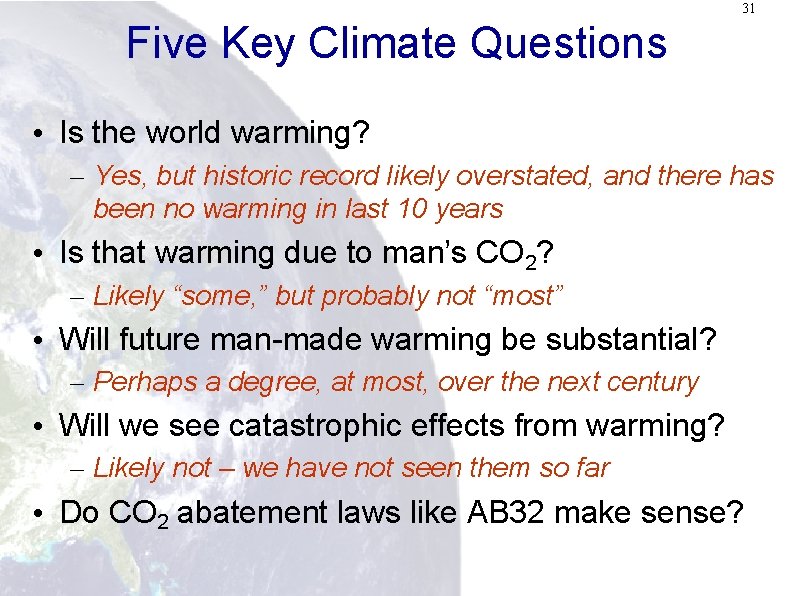
31 Five Key Climate Questions • Is the world warming? – Yes, but historic record likely overstated, and there has been no warming in last 10 years • Is that warming due to man’s CO 2? – Likely “some, ” but probably not “most” • Will future man-made warming be substantial? – Perhaps a degree, at most, over the next century • Will we see catastrophic effects from warming? – Likely not – we have not seen them so far • Do CO 2 abatement laws like AB 32 make sense?
32 Global Warming is Sucking The Oxygen Out of the Environmental Movement Other emissions that are more harmful that still need to be addressed Driving environmentally stupid behavior (e. g. subsidizing corn ethanol) Many other areas where more impact possible for less money
33 Problems with the Precautionary Principle Insurance makes no sense when the premiums are higher than the value of what you are insuring Costs are going to be enormous to really make any kind of impact at all Europeans have $8 -$9 gas and they are not any where near 20% by 2050 type goals California has the lowest per capital electricity use of any state BUT CA has the 8 th highest electricity prices CA has the 10 th smallest industrial sector (as measured by percent of electric demand to industrial users) CA has the 1 st mildest climate (as measured by Cooling + Heating degree days) There is no free lunch on CO 2 abatement
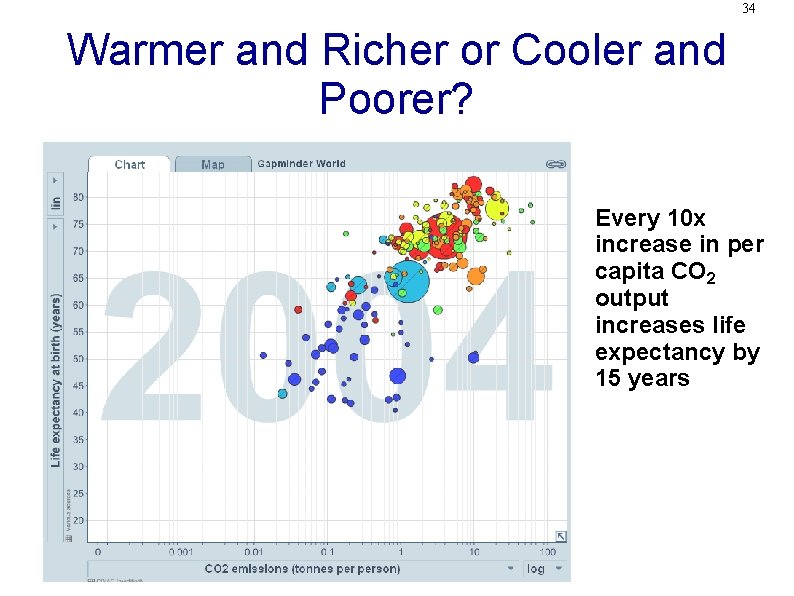
34 Warmer and Richer or Cooler and Poorer? Every 10 x increase in per capita CO 2 output increases life expectancy by 15 years
35 A Plea for Sanity: A Carbon Tax Far Better than Cap and Trade Carbon tax much simpler to administer (the California BOE could do it in their sleep). Emissions accounting is a nightmare Cap and trade is a lobbyist’s dream Nearly infinite space for influence peddling, special deals, exemptions, etc. European cap and trade systems are fraught with faulty accounting Politicians like cap and trade because it allows them to tax without appearing to tax. Have some guts and go with a straight carbon tax.
36 Five Key Climate Questions • Is the world warming? – Yes, but historic record likely overstated, and there has been no warming in last 10 years • Is that warming due to man’s CO 2? – Likely “some, ” but probably not “most” • Will future man-made warming be substantial? – Perhaps a degree, at most, over the next century • Will we see catastrophic effects from warming? – Likely not – we have not seen them so far • Do CO 2 abatement laws like AB 32 make sense? – Costs far more than it helps. Many more important priorities. Carbon tax preferred over cap-and-trade.

Don’t Panic!
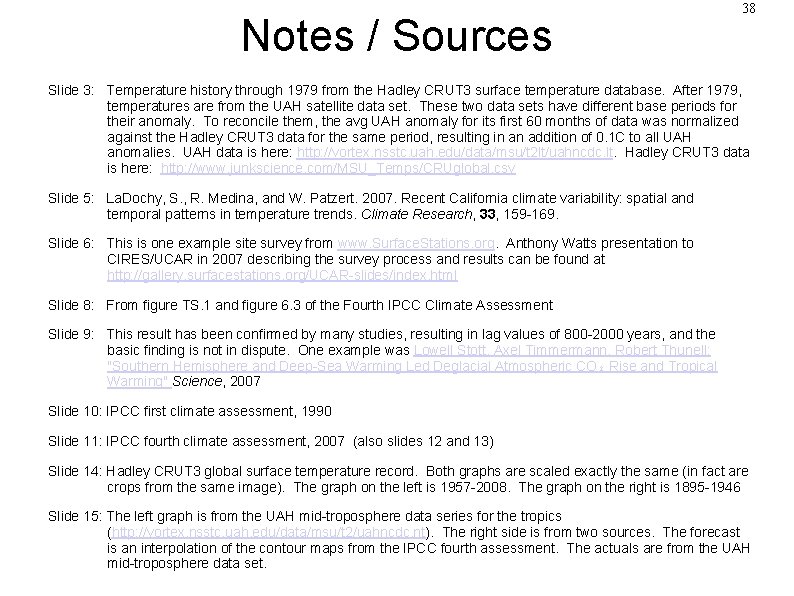
Notes / Sources 38 Slide 3: Temperature history through 1979 from the Hadley CRUT 3 surface temperature database. After 1979, temperatures are from the UAH satellite data set. These two data sets have different base periods for their anomaly. To reconcile them, the avg UAH anomaly for its first 60 months of data was normalized against the Hadley CRUT 3 data for the same period, resulting in an addition of 0. 1 C to all UAH anomalies. UAH data is here: http: //vortex. nsstc. uah. edu/data/msu/t 2 lt/uahncdc. lt. Hadley CRUT 3 data is here: http: //www. junkscience. com/MSU_Temps/CRUglobal. csv Slide 5: La. Dochy, S. , R. Medina, and W. Patzert. 2007. Recent California climate variability: spatial and temporal patterns in temperature trends. Climate Research, 33, 159 -169. Slide 6: This is one example site survey from www. Surface. Stations. org. Anthony Watts presentation to CIRES/UCAR in 2007 describing the survey process and results can be found at http: //gallery. surfacestations. org/UCAR-slides/index. html Slide 8: From figure TS. 1 and figure 6. 3 of the Fourth IPCC Climate Assessment Slide 9: This result has been confirmed by many studies, resulting in lag values of 800 -2000 years, and the basic finding is not in dispute. One example was Lowell Stott, Axel Timmermann, Robert Thunell: "Southern Hemisphere and Deep-Sea Warming Led Deglacial Atmospheric CO₂ Rise and Tropical Warming" Science, 2007 Slide 10: IPCC first climate assessment, 1990 Slide 11: IPCC fourth climate assessment, 2007 (also slides 12 and 13) Slide 14: Hadley CRUT 3 global surface temperature record. Both graphs are scaled exactly the same (in fact are crops from the same image). The graph on the left is 1957 -2008. The graph on the right is 1895 -1946 Slide 15: The left graph is from the UAH mid-troposphere data series for the tropics (http: //vortex. nsstc. uah. edu/data/msu/t 2/uahncdc. nt). The right side is from two sources. The forecast is an interpolation of the contour maps from the IPCC fourth assessment. The actuals are from the UAH mid-troposphere data set.
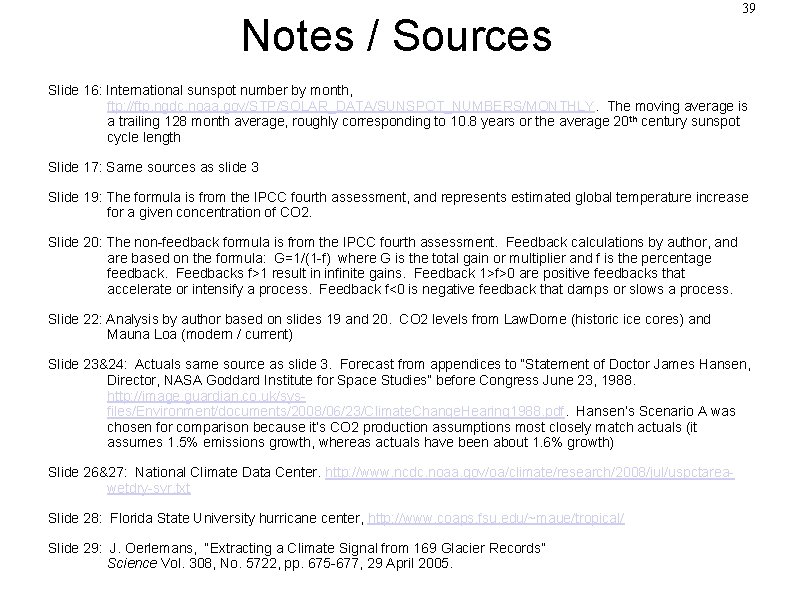
Notes / Sources 39 Slide 16: International sunspot number by month, ftp: //ftp. ngdc. noaa. gov/STP/SOLAR_DATA/SUNSPOT_NUMBERS/MONTHLY. The moving average is a trailing 128 month average, roughly corresponding to 10. 8 years or the average 20 th century sunspot cycle length Slide 17: Same sources as slide 3 Slide 19: The formula is from the IPCC fourth assessment, and represents estimated global temperature increase for a given concentration of CO 2. Slide 20: The non-feedback formula is from the IPCC fourth assessment. Feedback calculations by author, and are based on the formula: G=1/(1 -f) where G is the total gain or multiplier and f is the percentage feedback. Feedbacks f>1 result in infinite gains. Feedback 1>f>0 are positive feedbacks that accelerate or intensify a process. Feedback f<0 is negative feedback that damps or slows a process. Slide 22: Analysis by author based on slides 19 and 20. CO 2 levels from Law. Dome (historic ice cores) and Mauna Loa (modern / current) Slide 23&24: Actuals same source as slide 3. Forecast from appendices to “Statement of Doctor James Hansen, Director, NASA Goddard Institute for Space Studies” before Congress June 23, 1988. http: //image. guardian. co. uk/sysfiles/Environment/documents/2008/06/23/Climate. Change. Hearing 1988. pdf. Hansen’s Scenario A was chosen for comparison because it’s CO 2 production assumptions most closely match actuals (it assumes 1. 5% emissions growth, whereas actuals have been about 1. 6% growth) Slide 26&27: National Climate Data Center. http: //www. ncdc. noaa. gov/oa/climate/research/2008/jul/uspctareawetdry-svr. txt Slide 28: Florida State University hurricane center, http: //www. coaps. fsu. edu/~maue/tropical/ Slide 29: J. Oerlemans, “Extracting a Climate Signal from 169 Glacier Records” Science Vol. 308, No. 5722, pp. 675 -677, 29 April 2005.

Notes / Sources 40 Slide 30: University of Illinois Champaign-Urbana Polar Research Group, http: //arctic. atmos. uiuc. edu/cryosphere/ Slide 33: Data on California Electricity Use from the Energy Information Administration, http: //www. eia. doe. gov/az_index/Energya-z_a. html Slide 34. Gapminder. com
- Slides: 40