
Donation after BrainStem Death DBD Dr Farrel Igielman
Donation after Brain-Stem Death DBD Dr Farrel Igielman Dr Dale Gardiner Dr Gerlinde Mandersloot 4 th June 2013 Organ Donation Past, Present and Future 1
Session Objectives • Present regional data for DBD • Understand that DBD gives better organs than DCD • Increase rate of neurological confirmation of death by increasing confidence in the Diagnosis of Death • Increase quality of DBD organs – adoption of extended care bundle and compliance with the six early interventions in donor optimisation – collaboration in Scout pilot Organ Donation Past, Present and Future 2
LONDON Regional Data Dr Farrel Igielman Clinical Lead Organ Donation Queens and King George Hospitals Organ Donation Past, Present and Future 3
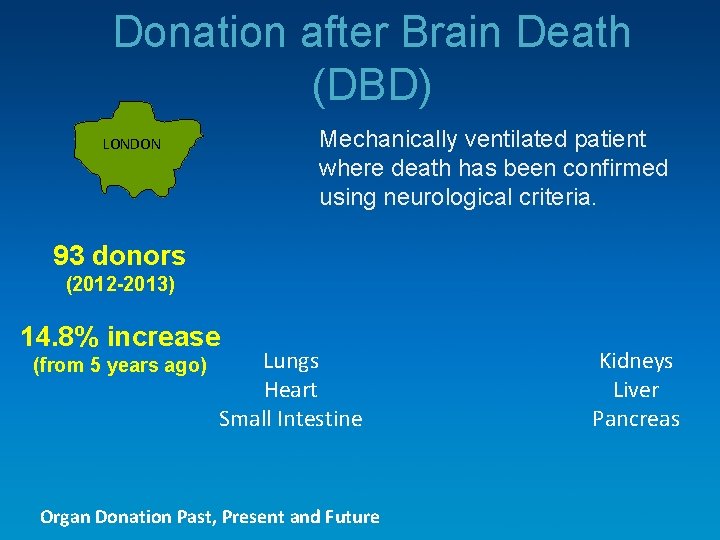
Donation after Brain Death (DBD) Mechanically ventilated patient where death has been confirmed using neurological criteria. LONDON 93 donors (2012 -2013) 14. 8% increase (from 5 years ago) Lungs Heart Small Intestine Organ Donation Past, Present and Future Kidneys Liver Pancreas
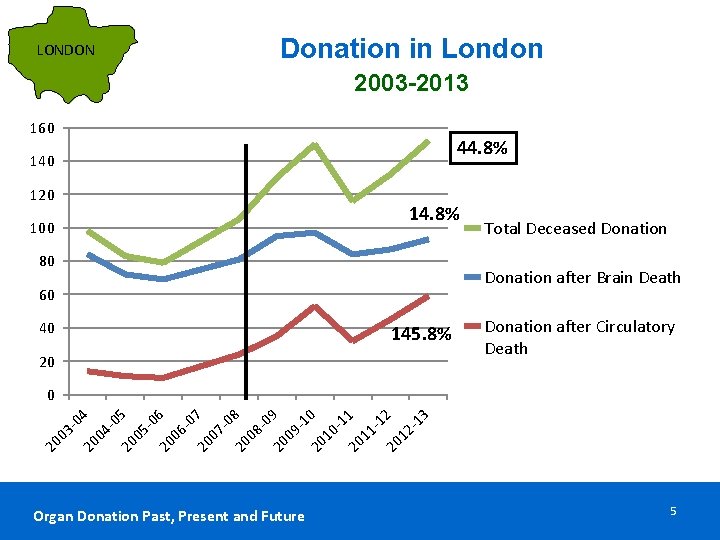
LONDON Donation in London 2003 -2013 160 44. 8% 140 120 100 14. 8% 80 Donation after Brain Death 60 40 Total Deceased Donation 145. 8% 20 Donation after Circulatory Death 20 03 -0 20 4 04 -0 20 5 05 -0 20 6 06 -0 20 7 07 -0 20 8 08 -0 20 9 09 -1 20 0 10 -1 20 1 11 -1 20 2 12 -1 3 0 Organ Donation Past, Present and Future 5
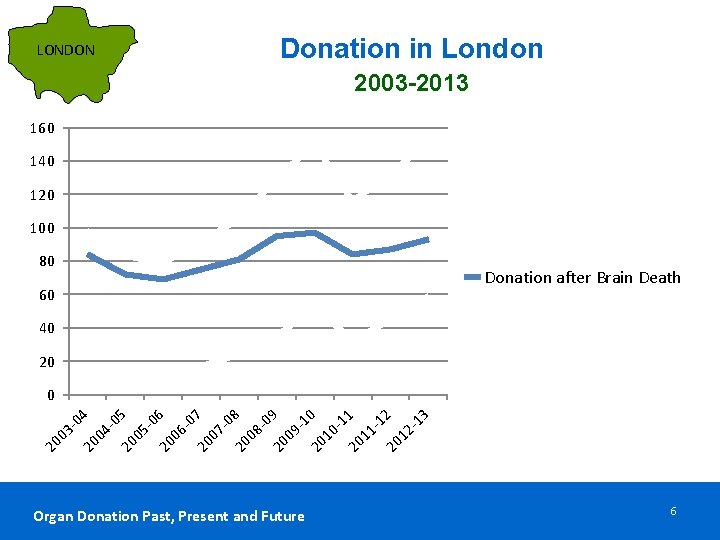
LONDON Donation in London 2003 -2013 160 140 120 100 80 60 40 20 Total Deceased Donation after Brain Death Donation after Circulatory Death 20 03 -0 20 4 04 -0 20 5 05 -0 20 6 06 -0 20 7 07 -0 20 8 08 -0 20 9 09 -1 20 0 10 -1 20 1 11 -1 20 2 12 -1 3 0 Organ Donation Past, Present and Future 6
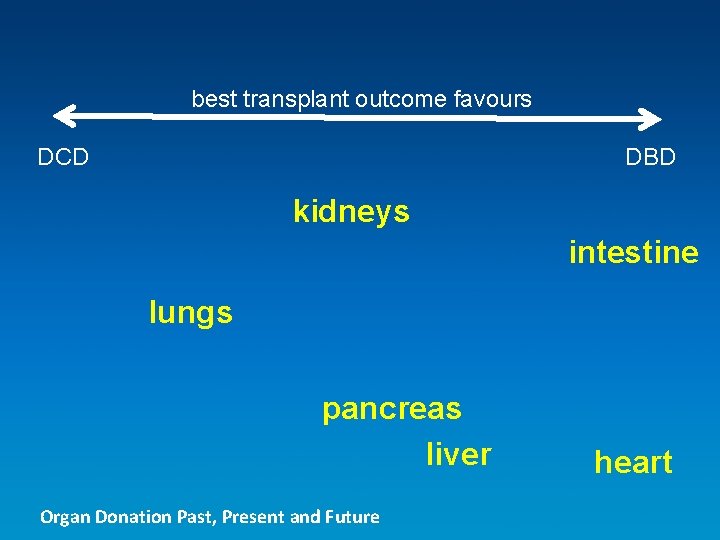
best transplant outcome favours DCD DBD kidneys intestine lungs pancreas liver Organ Donation Past, Present and Future heart
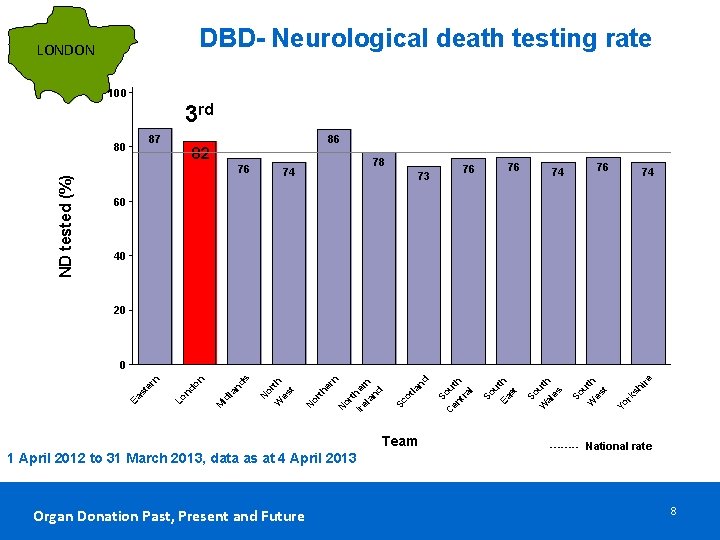
DBD- Neurological death testing rate LONDON 100 3 rd 87 ND tested (%) 80 86 82 76 78 74 76 76 73 76 74 74 60 40 20 Organ Donation Past, Present and Future sh ire rk Yo h t ut es So W So u Ea th st So W uth al es C Team 1 April 2012 to 31 March 2013, data as at 4 April 2013 So en uth tr al nd la ot Sc or t Ire her la n nd er n N N or th o W rth es t N s nd la M id on nd Lo Ea st er n 0 ---- National rate 8
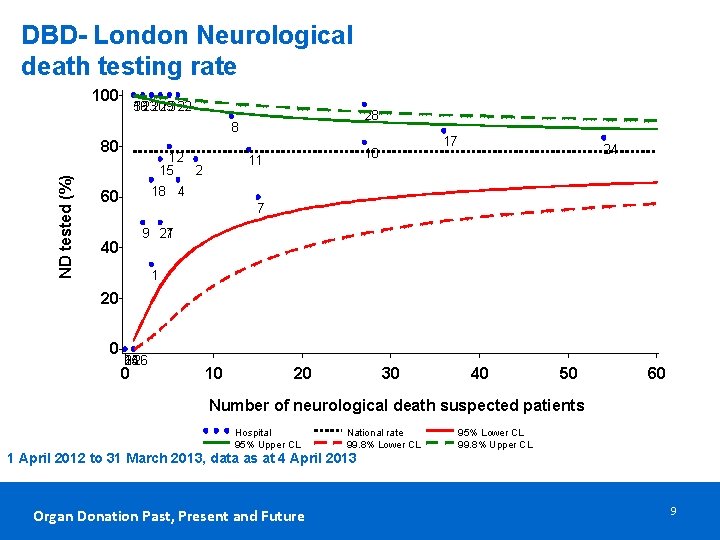
DBD- London Neurological death testing rate 100 1623 19 30 5 1320293 22 28 8 ND tested (%) 80 12 15 2 17 10 11 24 18 4 60 7 9 27 21 40 1 20 0 1426 25 6 0 10 20 30 40 50 60 Number of neurological death suspected patients Hospital 95% Upper CL National rate 99. 8% Lower CL 1 April 2012 to 31 March 2013, data as at 4 April 2013 Organ Donation Past, Present and Future 95% Lower CL 99. 8% Upper CL 9
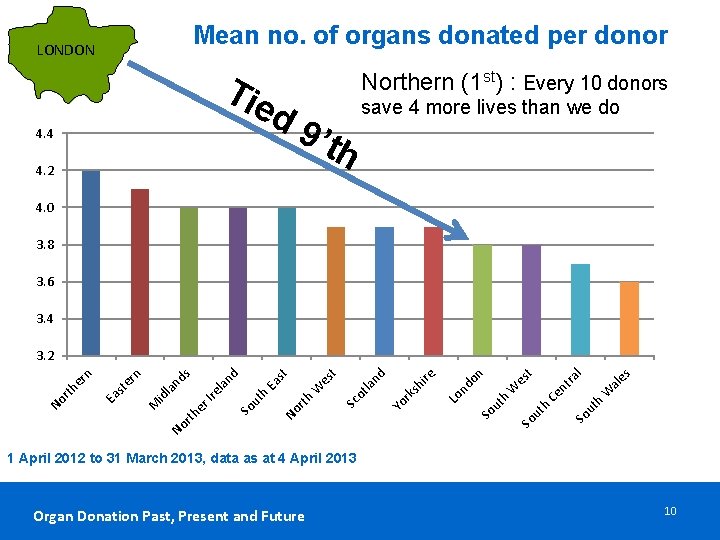
Mean no. of organs donated per donor LONDON Tie Northern (1 st) : Every 10 donors d 9 4. 4 save 4 more lives than we do ’th 4. 2 4. 0 3. 8 3. 6 3. 4 es W h So ut Ce n ut h al tra l t es W So So u th do n Lo n re rk sh i Yo nd la Sc ot W es t st No rth Ea h So ut la No rth er M id Ire la nd nd s n er st Ea No rth er n 3. 2 1 April 2012 to 31 March 2013, data as at 4 April 2013 Organ Donation Past, Present and Future 10
- Slides: 10