Dominant Factor Controlling Leaf Reflectance 2 70 Water


")


 Biomass in South Carolina")

 and Derived Biomass Map")
 to red")


- Slides: 19
Dominant Factor Controlling Leaf Reflectance 2. 70 Water absorption bands: 0. 97 mm 1. 19 mm 1. 45 mm 1. 94 mm-mm
Cross-section Through A Hypothetical and Real Leaf Revealing the Major Structural Components that Determine the Spectral Reflectance of Vegetation
Absorption Spectra of Chlorophyll a and b, b-carotene, Pycoerythrin, and Phycocyanin Pigments Chlorophyll a peak absorption is at 0. 43 and 0. 66 mm. Chlorophyll b peak absorption is at 0. 45 and 0. 65 mm. Optimum chlorophyll absorption windows are: 0. 45 - 0. 52 mm and 0. 63 0. 69 mm
. Spectral Reflectance Characteristics of Sweetgum Leaves (Liquidambar styraciflua L. )
Hemispherical Reflectance, transmittance, and Absorption Characteristics of Big Bluestem Grass
Distribution of Pixels in a Scene in Red and Near-infrared Multispectral Feature Space.
Predicted Percent Cloud Cover in Four Areas in the United States
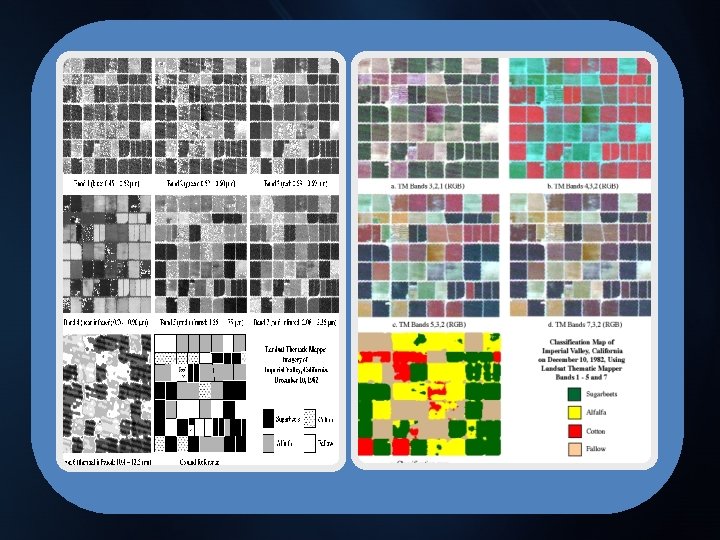
Phenological Cycles of San Joaquin. and Imperial Valley, California Crops and Landsat Multispectral Scanner Images of One Field During A Growing Season
Phenological Cycle of Cattails and Waterlilies in Par Pond, S. C. .
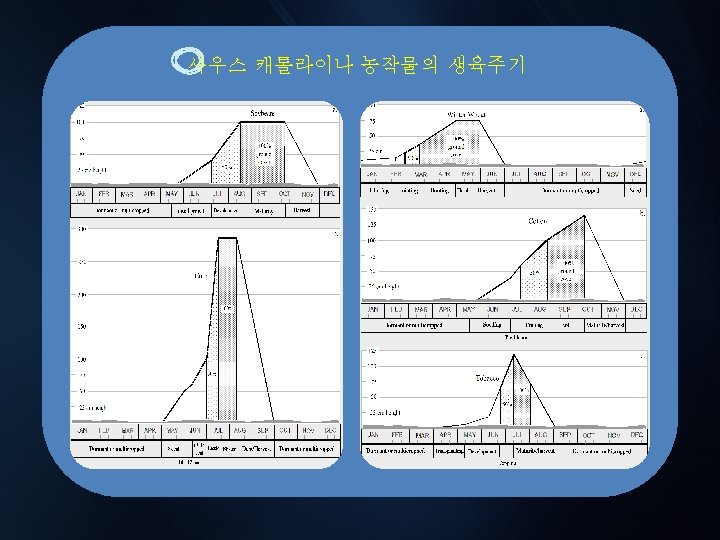
Phenological Cycle of Smooth Cordgrass (Spartina alterniflora) Biomass in South Carolina
In Situ Ceptometer Leaf-Area-Index Measurement • LAI may be computed using a Decagon Accupar Ceptometer™ that consists of a linear array of 80 adjacent 1 cm 2. photosynthetically active radiation (PAR) sensors along a bar. • Incident sunlight above the canopy, Qa, and the amount of direct solar energy incident to the ceptometer, Qb, when it was laid at the bottom of the canopy directly on the mud is used to compute LAI.
NASA Calibrated Airborne Multispectral Scanner Imagery (3 x 3 m) and Derived Biomass Map of a Portion of Murrells Inlet, South Carolina on August 2, 1997
Normalized Difference Vegetation Index Infrared/Red Ratio Vegetation Index . The near-infrared (NIR) to red simple ratio (SR) is the first true vegetation index: It takes advantage of the inverse relationship between chlorophyll absorption of red radiant energy and increased reflectance of near -infrared energy for healthy plant canopies (Cohen, 1991). . . The generic normalized difference vegetation index (NDVI): has provided a method of estimating net primary production over varying biome types (e. g. Lenney et al. , 1996), identifying ecoregions (Ramsey et al. , 1995), monitoring phenological patterns of the earth’s vegetative surface, and of assessing the length of the growing season and dry-down periods (Huete and Liu, 1994).
984 1 f o s erie Time S 88 NDVI and 19 ments e Measur from Derived lobal G AVHRR erage v o C a Are (GAC) ion g e R e or th f a t a D beid, O l E around an, Sud ran a h a S in Sub Africa
Landscape Ecology Metrics.
Q&A THANK YOU♡