Does Colony Loss Reduce Honey Yield Peyton Ferrier


 Real Rev Growth – 626% Real Price – 158% CA")


")
")


 are strongly significant and positive as")


- Slides: 20
Does Colony Loss Reduce Honey Yield? Peyton Ferrier, Economic Research Service, USDA Applied Social Science Association Meeting, Atlanta, GA, January 5 -7, 2019 Disclaimer: The findings and conclusions in this preliminary presentation have not been formally disseminated by the U. S. Department of Agriculture and should not be construed to represent any Agency determination or policy. This research was supported in part by the intramural research program of the U. S. Department of Agriculture, Economic Research Service.
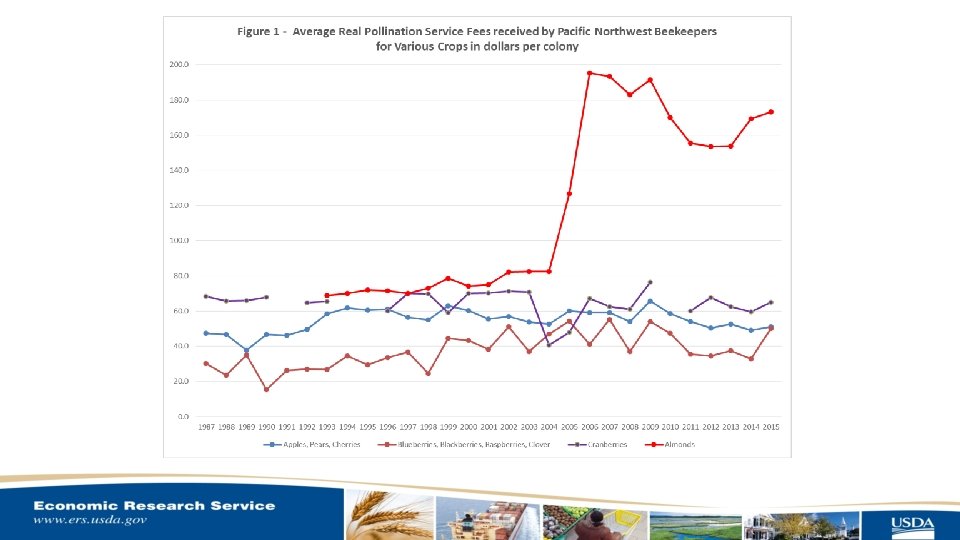
Introduction • Since 2000, beekeeping has experienced three big shifts: 1. Colony loss rates have doubled - average 28. 7 percent 2007 -2016 2. Honey yields fell 29. 3 percent 3. Pollination service income rose from 11 to 41 percent between 1988 and 2016 • In 2016, almonds accounted for 82 % of pollination services fees, 60% of colony rentals, and 52 % of paid pollinated acres. • Massive acreage, high fees, highly pollinator-dependent, distant for BK (only in CA), blooms in late winter, almond honey tastes bad and not sold. • Most concern over the effect of pollinator loss on ag production (Morse and Calderone, 2000; Gallai et al. , 2009)
CA Almonds (2000 -14) Real Rev Growth – 626% Real Price – 158% CA Almonds (2000 -17) Acreage Growth – 96% Production – 223% Real Value (2017 Base) 2000 - $ 949 Million 2014 - $7, 650 Million 2007 - $5, 603 Million Real Prices (2017 Base) 2000 - 1. 38 $/lb 2014 - 4. 14 $/lb 2007 - 2. 53 $/lb Source: USDA NASS California Almond Report (2017) Source: USDA ERS Fruit and Tree Nut Yearbook (2017)
Avg U. S. Honey Yields 1986 -88 – 66. 5 lb/col 1998 -00 – 81. 4 lb/col 2015 -17 - 53. 7 lb/col Honey Producing Cols 1986 – 3. 2 million 2000 – 2. 6 million 2017 – 2. 7 million Real Honey Price 1986 -2000 = 1. 02 $/lb 2001 -2002 = 1. 83 $/lb (2001 antidumping tariff) 2003 -2007 = 1. 26 $/lb 2008 -2010 = 1. 70 $/lb 2011 -2017 = 2. 14 $/lb Source: USDA ERS Sugars and Sweeteners Yearbook (2017)
. 0 6 09. 190. 0 6 50 10. 190 : 00: 0. 0 6 50 0 11. 190 : 00: 0. 0 6 50 0 12. 190 : 00: 0. 0 6 50 0 13. 190 : 00: 0. 0 6. 5 0: 0 14 90 0: 0. 0 6 50 0 15. 190 : 00: 0. 0 6 50 0 16. 190 : 00: 0. 0 6 50 0 17. 190 : 00: 0. 0 6. 5 0: 0 18 90 0: 0. 0 6 50 0 19. 190 : 00: 0. 0 6 50 0 20. 190 : 00: 0. 0 6. 5 0: 0 1 0 21 90 0: 0. 0 6. 5 0: 0 1 0 22 90 0: 0. 0 6 50 0 23. 190 : 00: 0. 0 6 50 0 24. 190 : 00: 0. 0 6. 5 0: 0 1 0 25 90 0: 0. 0 6. 5 0: 0 1 0 26 90 0: 0. 0 6 50 0 27. 190 : 00: 0. 0 6 50 0 28. 190 : 00: 0. 0 6. 5 0: 0 1 0 29 90 0: 0. 0 6 50 0 30. 190 : 00: 0. 0 6 50 0 01. 190 : 00: 0. 0 7 50 0 02. 190 : 00: 0. 0 7. 5 0: 0 1 0 03 90 0: 0. 0 7 50 0 04. 190 : 00: 0. 0 7 50 0 05. 190 : 00: 0. 0 7 50 0 06. 190 : 00: 0. 0 7. 5 0: 0 1 0 07 90 0: 0. 0 7 50 0 08. 190 : 00: 0. 0 7 50 0 09. 190 : 00: 0. 0 7. 5 0: 0 19 00 05 : 0 00 : 0 0 08 Z-Scores for Honey Yield (St. Devs from State Mean Yield) 3 2 1 United States California North Dakota Florida Texas Michigan 0 -1 -2 -3 Source: USDA ERS Sugars and Sweeteners Yearbook (2017)
Background on Colony Loss • Causes • Abiotic – weather, poor forage/lack of nutrition, pesticide exposure, colony movement • Biotic Stressors – Varroa mite, viruses (deformed wing, etc. ), Wax Moths, Small Hive Beetle, Nosema Ceranae, etc. • Movement likely facilitates the transmission of biotic stressors when colonies are concentrated in staging areas. • BK replace loss colonies primarily through splitting healthy colonies so that new colonies are smaller. • If bee populations are equals size, two small colonies produce less honey than one big one.
Two reasons why honey yields might fall: •
Data • NASS Honey Production – annual BK survey of prod, colonies, yield. • 4 years (2014 -2017) • y – yield • size – lagged colonies • NASS Colony Loss – quarterly BK survey of colonies, losses, additions, requeenings, and stressors. Lists state locations of colonies. • 10 Quarters (2015 Q 1 -2017 Q 2) • • loss – 2 -quarter loss rate (sum of Q 1 and Q 2 losses/sum of Q 1 and Q 2 colonies) cali – max share of colonies in California in Q 1 and Q 2 move – difference of average colony distance to California in Q 1 and Q 3 ey – expected yield • 1. Find BK share of colonies in each state in 3 rd quarter (honey season) • 2. Multiply state shares by state average yields
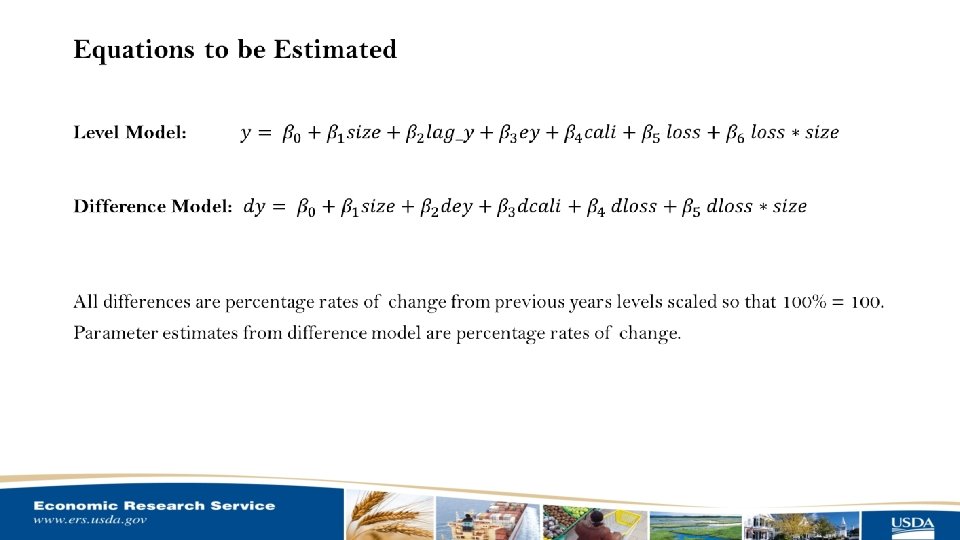
Estimating the effect on honey yields of colony loss and almond pollination • Pooled model – data too short for BK fixed effects • Early share of colonies in CA is proxy for almond pollination • Controls for productivity BK • Size, Lagged yields, Difference model • Controls for market shocks/regional productivity shifters • Expected yields • Instrument for loss rate using IT 2 SLS to avoid measurement error bias (colonies appears in the denominators of both yield and loss rate) • Weighted regression - Size Interacted with Loss
Source: NASS Honey Product and Colony Loss Data (2014 -17)
Source: NASS Honey Product and Colony Loss Data (2014 -17)
Source: Author’s Calculations based on NASS Data
Source: Author’s Calculations based on NASS Data
Results • Productivity Controls (Lagged Yield, Expected Yield) are strongly significant and positive as expected. • A 10 percentage point increase in CA share decreases yield by: • 0. 77 pounds (or 1. 46 percent) in the yield model • 2. 96 percent (or 1. 56 pounds) in the difference model • Effect of loss dissipates with increasing size of operations. • A 1 percentage point increase in the loss rate* decreases yields by: • . 362 pounds (or 0. 69 percent) in the yield model • -0. 347 percent (or. 347 pounds) in the difference model • Yield is assumed to be 52. 7 pounds in calculations
Source: Author’s Calculations based on NASS Data
Implications • Overwinter loss rates of colonies is thought to have increased 15 percentage points above its historic average, a change corresponding to a 7. 5 percentage point increase in our 2 -quarter loss rate. This change in loss rate reduces yields by 2. 7 pounds or 5. 2 percent. • A 30 percent point increase in the share of colonies in California in Q 1 would reduce yields by 2. 32 pounds or 4. 4 percent. • Collectively, elevated colony loss and movement in service of almond pollination are estimated to reduce honey yields by 9. 6 percent or 33 percent of the 29. 3 percent total reduction in yields.
Conclusions • Colony loss reduces honey yield, but the incentive of high almond fees play a large role as well. • High almond pollination service fees can reduce yields through multiple channels. Our model does not sort out the specific mechanism. • Other factors may affecting honey yield are not addressed here • Forage loss, weather, sub-lethal effects of stressors.
Contact Information Peyton Ferrier Economics Research Service, USDA 202 -694 -7470 pferrier@ers. usda. gov