
DO STUDENTS REALLY WANT TO KNOW INVESTIGATING THE
- Slides: 23
DO STUDENTS REALLY WANT TO KNOW? INVESTIGATING THE RELATIONSHIP BETWEEN LEARNING ANALYTICS DASHBOARDS AND STUDENT MOTIVATION Danny Toohey Tanya Mc. Gill Tuesday, July 2, 2019 In. SITE 2019 AN ANINFORMINGSCIENCEINSTITUTECONFERENCEJune 3030 - July 5, 5, 2019 Jerusalem,
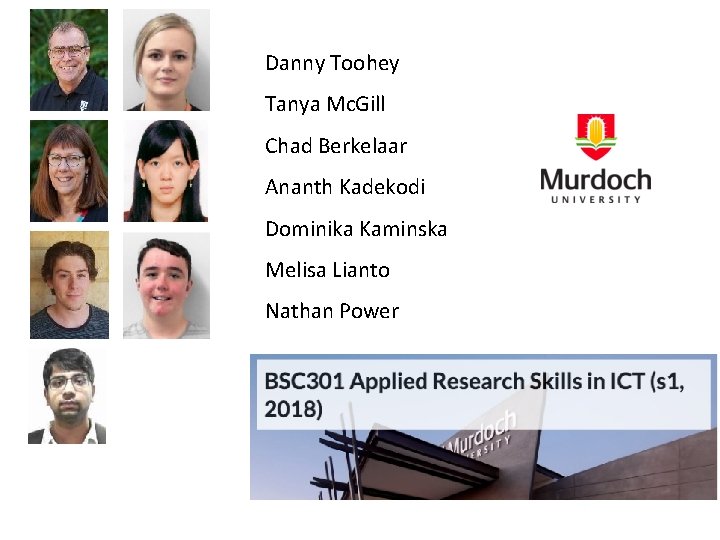
Danny Toohey Tanya Mc. Gill Chad Berkelaar Ananth Kadekodi Dominika Kaminska Melisa Lianto Nathan Power
Student-facing learning analytics dashboards • • • Background Purpose Method Results Implications In. SITE 2019 AN INFORMING SCIENCE INSTITUTE CONFERENCE June 30 - July 5, 2019 Jerusalem,
STUDENT-FACING LEARNING ANALYTICS DASHBOARDS AND STUDENT MOTIVATION - BACKGROUND In. SITE 2019 AN ANINFORMINGSCIENCEINSTITUTECONFERENCEJune 3030 - July 5, 5, 2019 Jerusalem,
Previous Research • Learning analytics (LA) involves collection, analysis and presentation of data about students’ engagement with various L&T systems • Dashboards can be used to present this data – Focus has been on staff dashboards – Less on student-facing dashboards and results have been mixed
Students and LA Dashboards • Previous research suggests: – Students want to see their results online, but not necessarily compared with other students (Reimers and Neovesky, 2015) – Showing rankings has been reported to • …increase students’ motivation, and • …decrease students’ motivation (DomíNguez et al. 2013) In. SITE 2019 AN INFORMING SCIENCE INSTITUTE CONFERENCE June 30 - July 5, 2019 Jerusalem,
PURPOSE In. SITE 2019 AN ANINFORMINGSCIENCEINSTITUTECONFERENCEJune 3030 - July 5, 5, 2019 Jerusalem,
Purpose • Academic motivation is important in academic performance (Abeysekera & Dawson, 2015) • Understanding more about student-facing LADs and academic motivation has the potential to improve outcomes for students. • This project aimed to: – explore the perceptions of IT students about studentfacing LADs that display student ranking information – investigate how their academic motivation would be influenced by the use of these dashboards In. SITE 2019 AN INFORMING SCIENCE INSTITUTE CONFERENCE June 30 - July 5, 2019 Jerusalem,
METHOD In. SITE 2019 AN ANINFORMINGSCIENCEINSTITUTECONFERENCEJune 3030 - July 5, 5, 2019 Jerusalem,
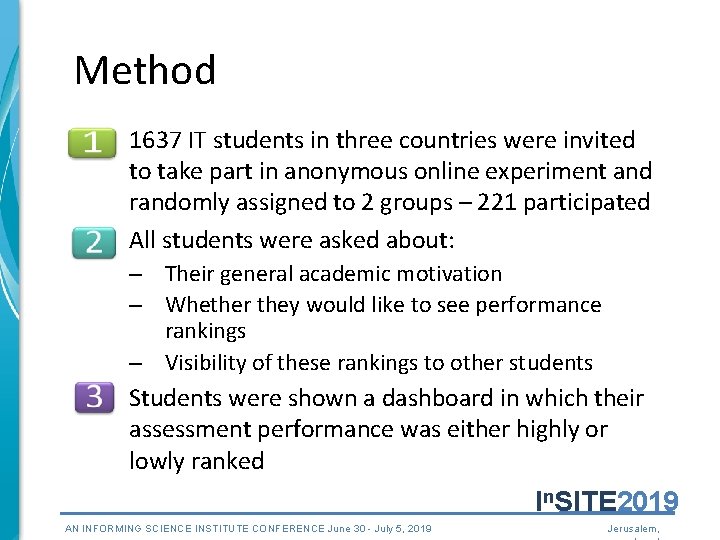
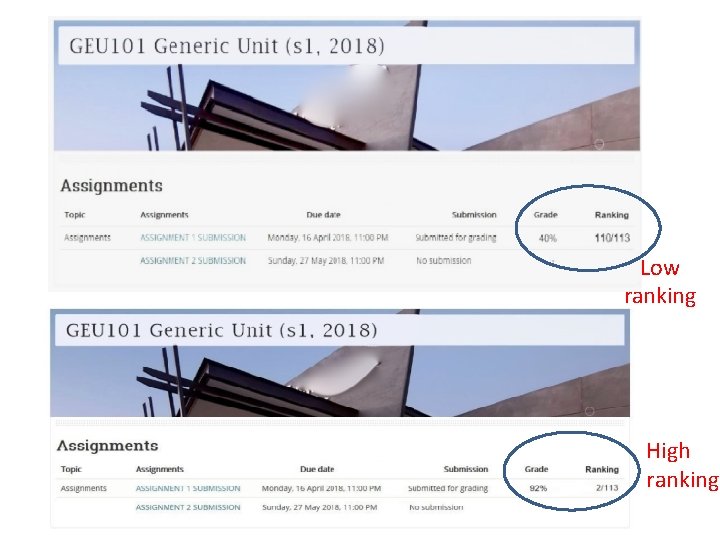
Method 1637 IT students in three countries were invited to take part in anonymous online experiment and randomly assigned to 2 groups – 221 participated All students were asked about: – Their general academic motivation – Whether they would like to see performance rankings – Visibility of these rankings to other students Students were shown a dashboard in which their assessment performance was either highly or lowly ranked In. SITE 2019 AN INFORMING SCIENCE INSTITUTE CONFERENCE June 30 - July 5, 2019 Jerusalem,
Dashboards Low ranking High ranking
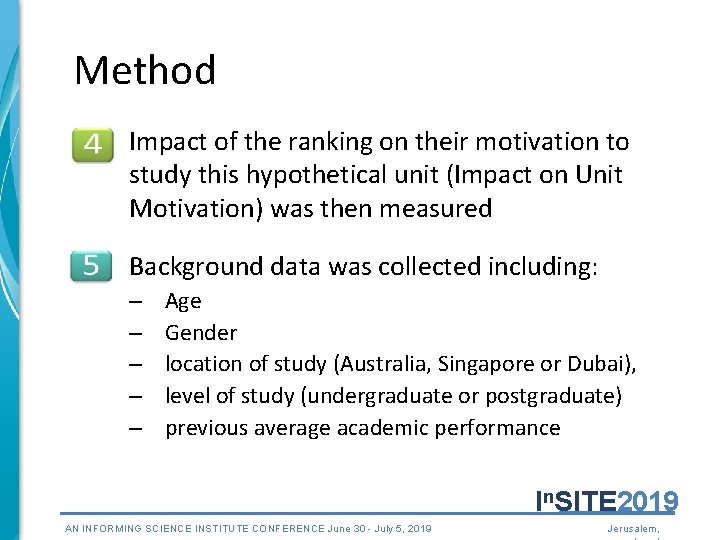
Method Impact of the ranking on their motivation to study this hypothetical unit (Impact on Unit Motivation) was then measured Background data was collected including: – – – Age Gender location of study (Australia, Singapore or Dubai), level of study (undergraduate or postgraduate) previous average academic performance In. SITE 2019 AN INFORMING SCIENCE INSTITUTE CONFERENCE June 30 - July 5, 2019 Jerusalem,
RESULTS In. SITE 2019 AN ANINFORMINGSCIENCEINSTITUTECONFERENCEJune 3030 - July 5, 5, 2019 Jerusalem,
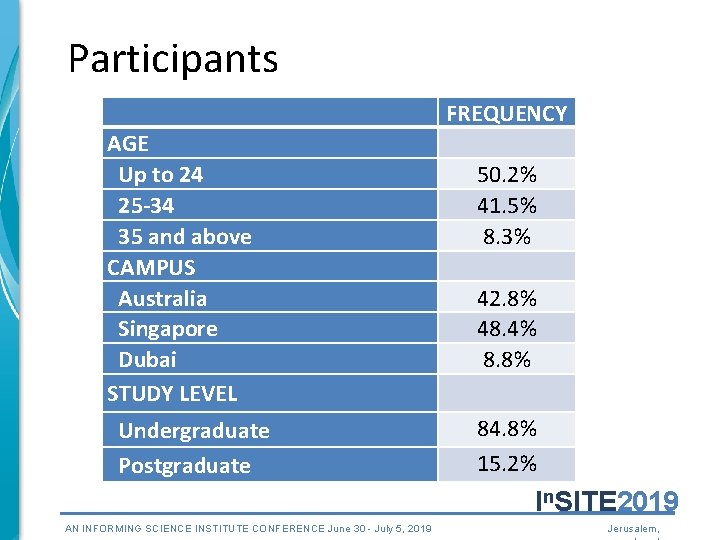
Participants AGE Up to 24 25 -34 35 and above CAMPUS Australia Singapore Dubai STUDY LEVEL Undergraduate Postgraduate FREQUENCY 50. 2% 41. 5% 8. 3% 42. 8% 48. 4% 8. 8% 84. 8% 15. 2% In. SITE 2019 AN INFORMING SCIENCE INSTITUTE CONFERENCE June 30 - July 5, 2019 Jerusalem,
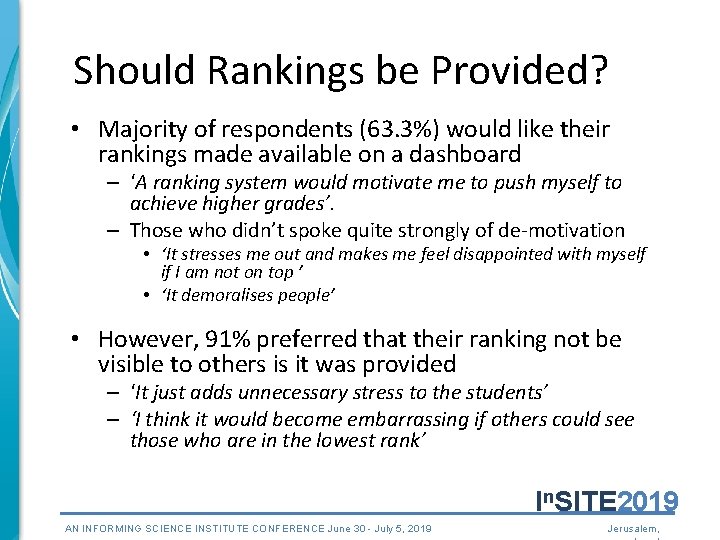
Should Rankings be Provided? • Majority of respondents (63. 3%) would like their rankings made available on a dashboard – ‘A ranking system would motivate me to push myself to achieve higher grades’. – Those who didn’t spoke quite strongly of de-motivation • ‘It stresses me out and makes me feel disappointed with myself if I am not on top ’ • ‘It demoralises people’ • However, 91% preferred that their ranking not be visible to others is it was provided – ‘It just adds unnecessary stress to the students’ – ‘I think it would become embarrassing if others could see those who are in the lowest rank’ In. SITE 2019 AN INFORMING SCIENCE INSTITUTE CONFERENCE June 30 - July 5, 2019 Jerusalem,
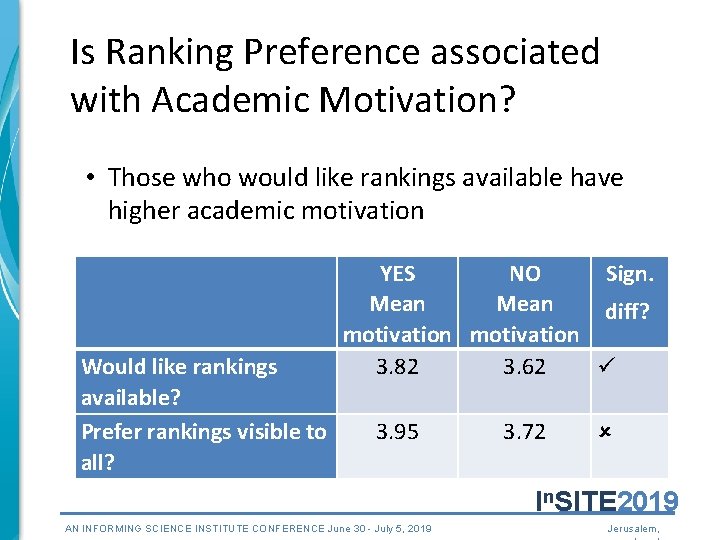
Is Ranking Preference associated with Academic Motivation? • Those who would like rankings available have higher academic motivation Would like rankings available? Prefer rankings visible to all? YES NO Sign. Mean diff? motivation 3. 82 3. 62 3. 95 3. 72 In. SITE 2019 AN INFORMING SCIENCE INSTITUTE CONFERENCE June 30 - July 5, 2019 Jerusalem,
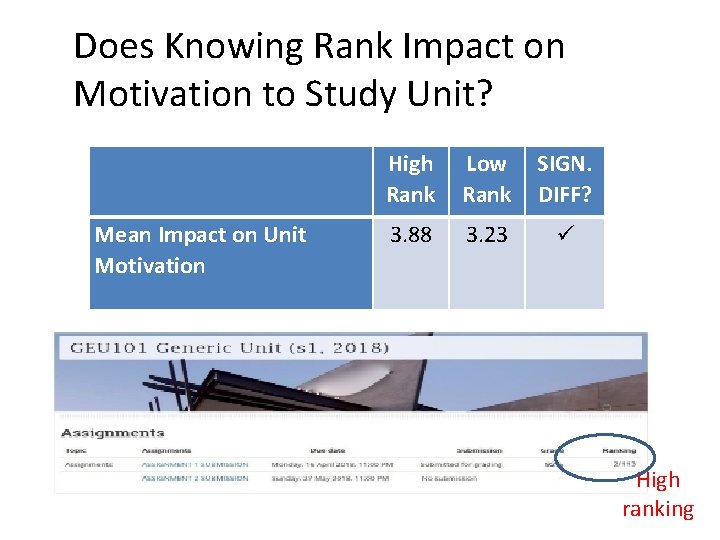
Does Knowing Rank Impact on Motivation to Study Unit? Mean Impact on Unit Motivation High Low Rank 3. 88 3. 23 SIGN. DIFF? High ranking
IMPLICATIONS In. SITE 2019 AN ANINFORMINGSCIENCEINSTITUTECONFERENCEJune 3030 - July 5, 5, 2019 Jerusalem,
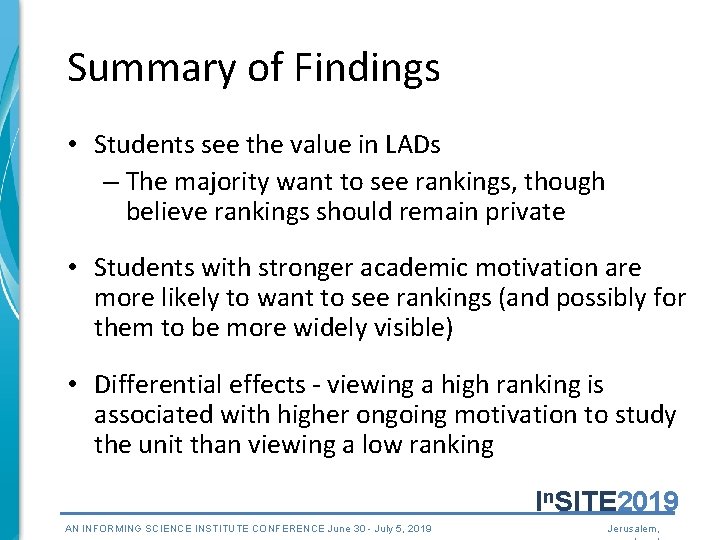
Summary of Findings • Students see the value in LADs – The majority want to see rankings, though believe rankings should remain private • Students with stronger academic motivation are more likely to want to see rankings (and possibly for them to be more widely visible) • Differential effects - viewing a high ranking is associated with higher ongoing motivation to study the unit than viewing a low ranking In. SITE 2019 AN INFORMING SCIENCE INSTITUTE CONFERENCE June 30 - July 5, 2019 Jerusalem,
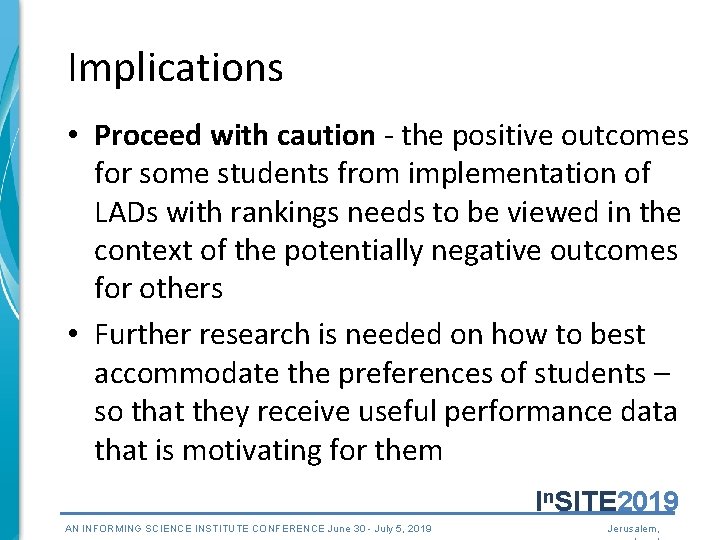
Implications • Proceed with caution - the positive outcomes for some students from implementation of LADs with rankings needs to be viewed in the context of the potentially negative outcomes for others • Further research is needed on how to best accommodate the preferences of students – so that they receive useful performance data that is motivating for them In. SITE 2019 AN INFORMING SCIENCE INSTITUTE CONFERENCE June 30 - July 5, 2019 Jerusalem,
QUESTIONS? In. SITE 2019 AN ANINFORMINGSCIENCEINSTITUTECONFERENCEJune 3030 - July 5, 5, 2019 Jerusalem,
Performance Rankings • No significant differences for different levels of academic performance In. SITE 2019 AN INFORMING SCIENCE INSTITUTE CONFERENCE June 30 - July 5, 2019 Jerusalem,
References • Abeysekera, L. , & Dawson, P. (2015). Motivation and cognitive load in the flipped classroom: definition, rationale and a call for research. Higher Education Research & Development, 34(1), 1 -14. • DomíNguez, A. , Saenz-De-Navarrete, J. , De-Marcos, L. , FernáNdez-Sanz, L. , PagéS, C. , & MartíNez-HerráIz, J. -J. (2013). Gamifying learning experiences: Practical implications and outcomes. Computers & Education, 63, 380392. • Reimers, G. , & Neovesky, A. (2015). Student focused dashboards. Proceedings of the 7 th International Conference on Computer Supported Education (pp. 399 -404). In. SITE 2019 AN INFORMING SCIENCE INSTITUTE CONFERENCE June 30 - July 5, 2019 Jerusalem,