
Do plant functional traits predict carbon sequestration in
Do plant functional traits predict carbon sequestration in grasslands? Katja Klumpp Marie-Terese Sebastia Jean François Soussana
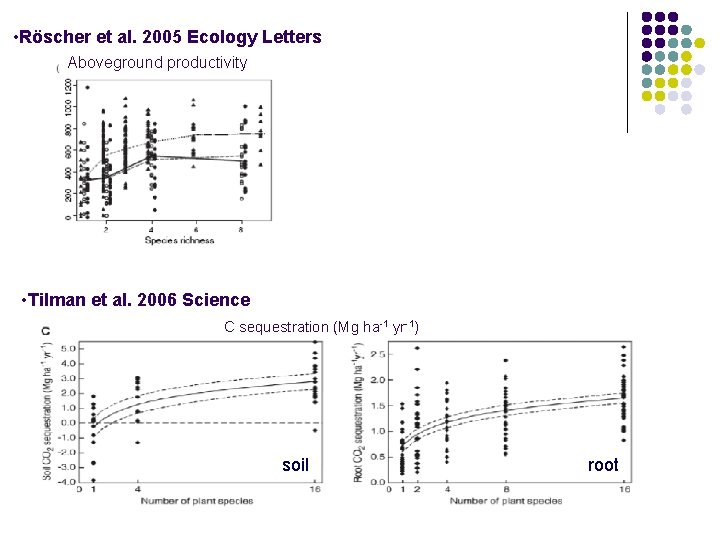
• Röscher et al. 2005 Ecology Letters Aboveground productivity • Tilman et al. 2006 Science C sequestration (Mg ha-1 yr-1) soil root
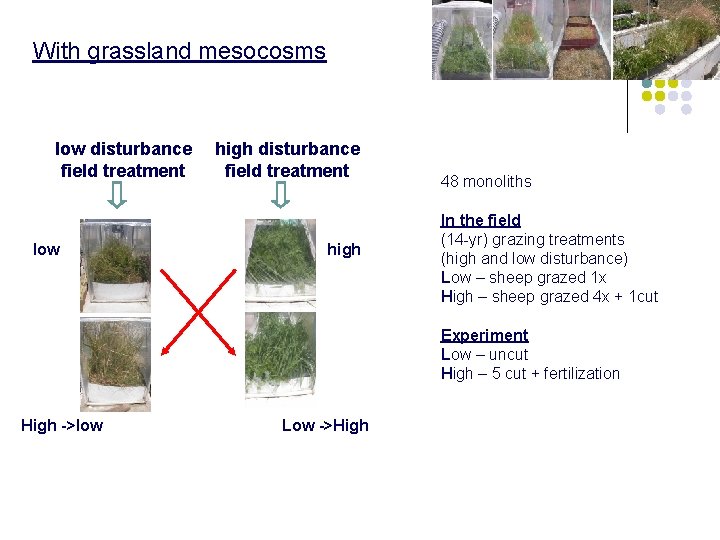
With grassland mesocosms low disturbance field treatment low high disturbance field treatment high 48 monoliths In the field (14 -yr) grazing treatments (high and low disturbance) Low – sheep grazed 1 x High – sheep grazed 4 x + 1 cut Experiment Low – uncut High – 5 cut + fertilization High ->low Low ->High
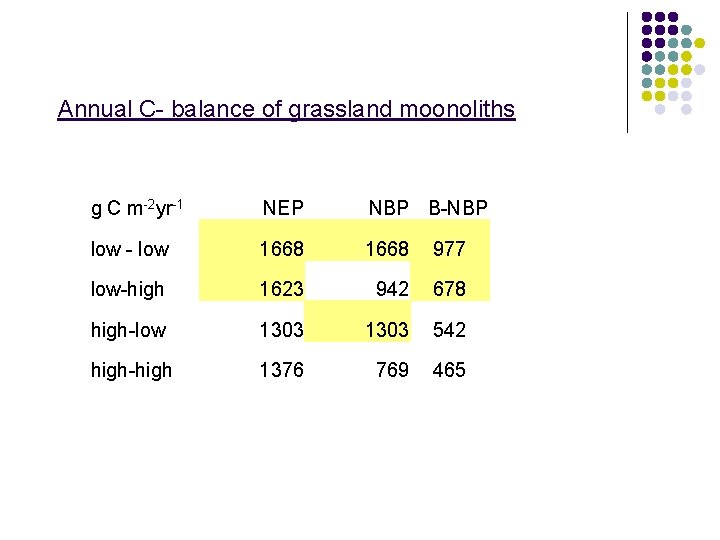
Annual C- balance of grassland moonoliths g C m-2 yr-1 NEP NBP B-NBP low - low 1668 977 low-high 1623 942 678 high-low 1303 542 high-high 1376 769 465
Below-ground C storage versus NEP and ANPP Trade off!! Increased soil C storage and declined ANPP at low compard to high disturbance. Klumpp et al. 2007 AGEE
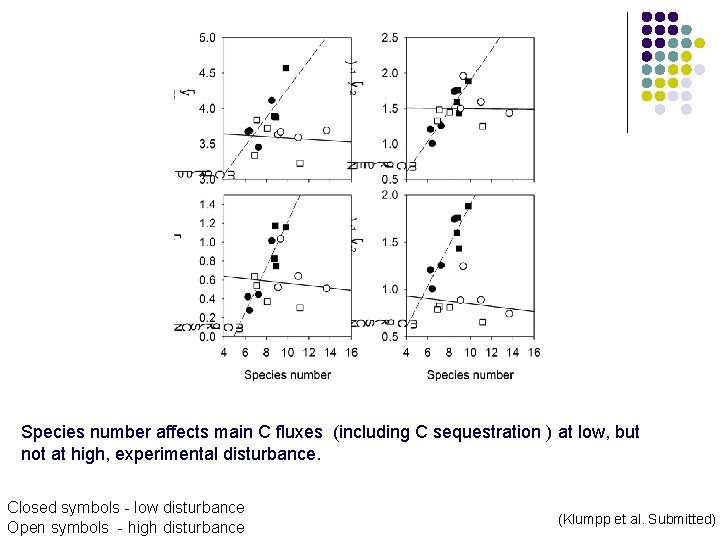
Species number affects main C fluxes (including C sequestration ) at low, but not at high, experimental disturbance. Closed symbols - low disturbance Open symbols - high disturbance (Klumpp et al. Submitted)
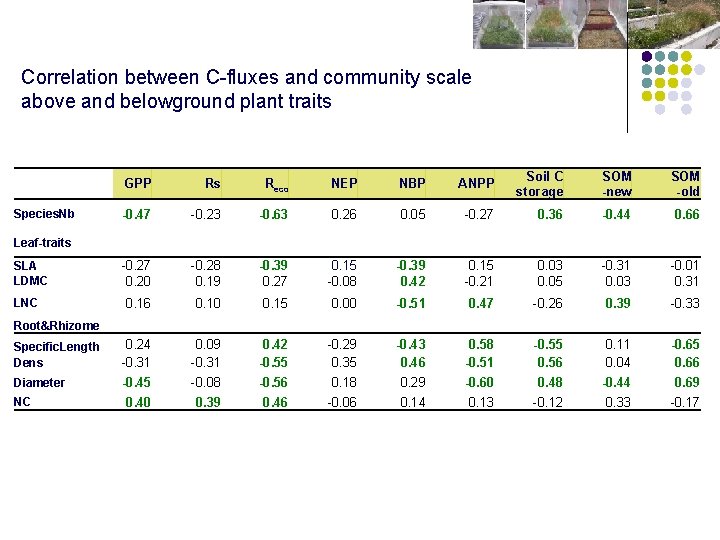
Correlation between C-fluxes and community scale above and belowground plant traits GPP Rs Reco NEP NBP ANPP Soil C storage SOM -new SOM -old -0. 47 -0. 23 -0. 63 0. 26 0. 05 -0. 27 0. 36 -0. 44 0. 66 -0. 27 0. 20 -0. 28 0. 19 -0. 39 0. 27 0. 15 -0. 08 -0. 39 0. 42 0. 15 -0. 21 0. 03 0. 05 -0. 31 0. 03 -0. 01 0. 31 0. 16 0. 10 0. 15 0. 00 -0. 51 0. 47 -0. 26 0. 39 -0. 33 Specific. Length Dens 0. 24 -0. 31 0. 09 -0. 31 0. 42 -0. 55 -0. 29 0. 35 -0. 43 0. 46 0. 58 -0. 51 -0. 55 0. 56 0. 11 0. 04 -0. 65 0. 66 Diameter -0. 45 -0. 08 -0. 56 0. 18 0. 29 -0. 60 0. 48 -0. 44 0. 69 0. 40 0. 39 0. 46 -0. 06 0. 14 0. 13 -0. 12 0. 33 -0. 17 Species. Nb Leaf-traits SLA LDMC LNC Root&Rhizome NC
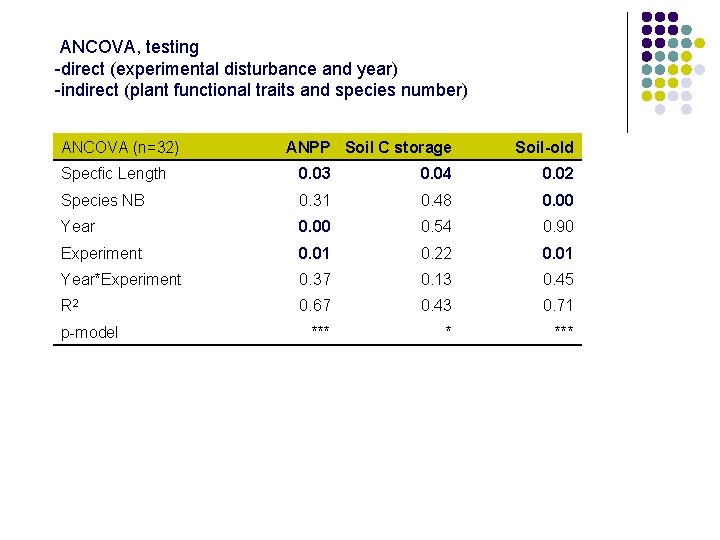
ANCOVA, testing -direct (experimental disturbance and year) -indirect (plant functional traits and species number) ANCOVA (n=32) ANPP Soil C storage Soil-old Specfic Length 0. 03 0. 04 0. 02 Species NB 0. 31 0. 48 0. 00 Year 0. 00 0. 54 0. 90 Experiment 0. 01 0. 22 0. 01 Year*Experiment 0. 37 0. 13 0. 45 R 2 0. 67 0. 43 0. 71 *** * *** p-model
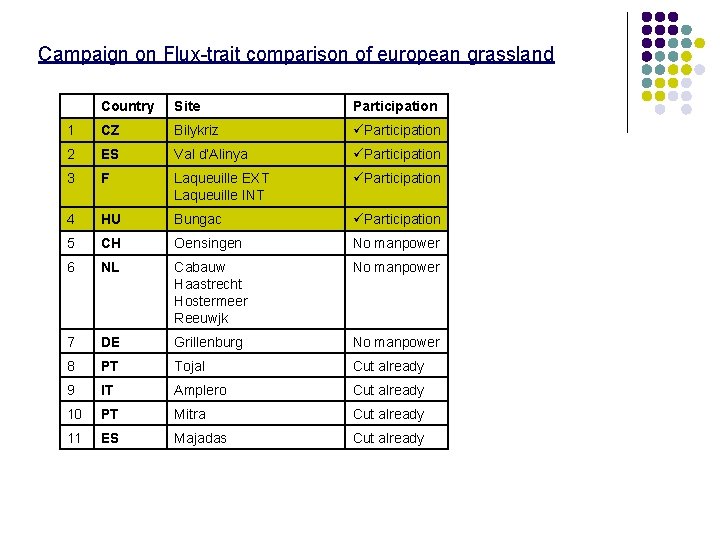
Campaign on Flux-trait comparison of european grassland Country Site Participation 1 CZ Bilykriz Participation 2 ES Val d’Alinya Participation 3 F Laqueuille EXT Laqueuille INT Participation 4 HU Bungac Participation 5 CH Oensingen No manpower 6 NL Cabauw Haastrecht Hostermeer Reeuwjk No manpower 7 DE Grillenburg No manpower 8 PT Tojal Cut already 9 IT Amplero Cut already 10 PT Mitra Cut already 11 ES Majadas Cut already
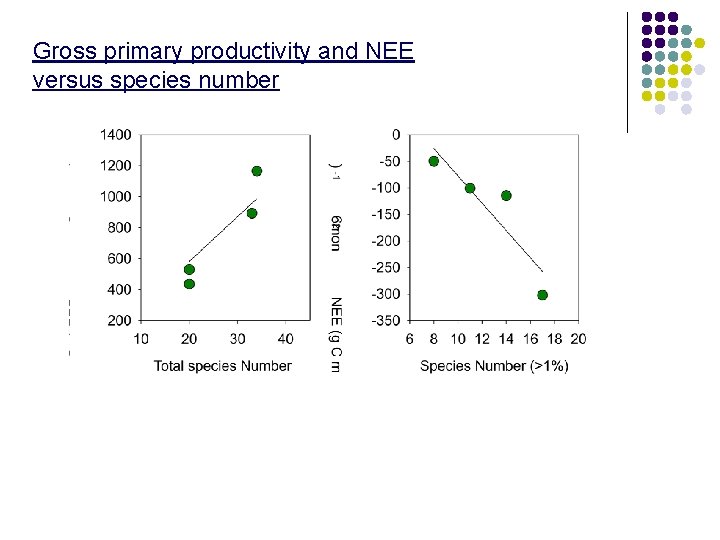
Gross primary productivity and NEE versus species number

On species level: SLA versus leaf dry matter content and leaf N content ☻ community scale

Gross primary productivity and NEE versus community scale traits GPP NEE

NEXT Steps
- Slides: 13