Do Now 416 OBJECTIVE 1 Describe the characteristics

Do Now 4/16 OBJECTIVE: 1. Describe the characteristics of populations using the terms size, density, dispersion, and age structure. 2. Describe and compare linear growth and exponential growth. TASK: Answer, don’t copy: There approximately 640, 000 people that reside in Baltimore City The land area of Baltimore is about 200 km 2 (about 80 mi 2) What is the human population density of Baltimore? 1. In people / km 2 2. In people / mi 2

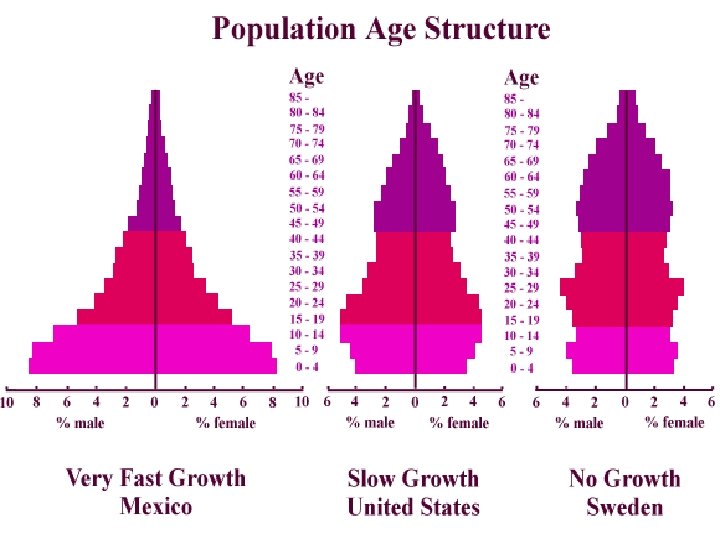
Measuring Populations • Population size: how many organisms are in the population • Population density: how many organisms there are per unit area (i. e. square km) • Population dispersion: how individual organisms are arranged in the population • Age structure: the relative distribution of organisms by age in the population

Population Size • How many organisms are there? – Simple count – Sampling and average. • A microbiologist samples a population of bacteria by counting the number of cells in 1 m. L of the liquid they’re in, with the following results – Sample 1: 27 individuals – Sample 2: 33 individuals – Sample 3: 30 individuals • What is the population size if there are 100 m. L of solution all together?

Population Density = Number/Area • There approximately 640, 000 people that reside in Baltimore City • The land area of Baltimore is about 200 km 2 (about 80 mi 2) • What is the human population density of Baltimore?

Population Dispersion: How a population is distributed

Human Population Dispersion

Population Growth Rates Growth Rate: The amount by which the size of a population changes in a given time Birth Immigration Emigration Death / Mortality

Growth Curves Logistical / Linear Exponential Logistical / Linear

Exponential Growth

Human Population Growth In the 15 years since this graph the human population has Grown by over 1, 000, 000 people.

• Populations will grow until there is something that limits them – Food, water, or other resources – Predators, parasites, disease, etc. • Carrying Capacity: The maximum population that is sustainable for long periods of time in an ecosystem. Resource Limits One limiting resource constrains growth: Leibig’s Law of the Minimum

Typical Growth Curve

Survivorship Curves • 3 Strategies for success: – Type I: low # of offspring, high survival rate of young. – Type III: high # of offspring, low survival rate of young. – Type II: moderate # of offspring and survival rate of young.

Total area = 3 km 2 Blue = young, white = old, turquoise = middle aged Find size, density, dispersion, and age structure of this population.

Population Growth Classwork / Homework • Practice worksheet • Reading on Syllabus
- Slides: 16