
Do Now 1 2 3 4 What is



- Slides: 42
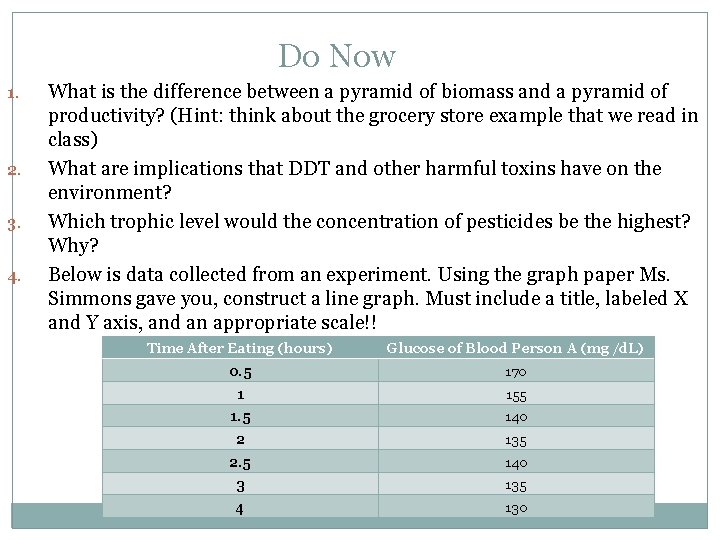
Do Now 1. 2. 3. 4. What is the difference between a pyramid of biomass and a pyramid of productivity? (Hint: think about the grocery store example that we read in class) What are implications that DDT and other harmful toxins have on the environment? Which trophic level would the concentration of pesticides be the highest? Why? Below is data collected from an experiment. Using the graph paper Ms. Simmons gave you, construct a line graph. Must include a title, labeled X and Y axis, and an appropriate scale!! Time After Eating (hours) Glucose of Blood Person A (mg /d. L) 0. 5 170 1 155 1. 5 140 2 135 2. 5 140 3 135 4 130
Looking Ahead �End of quarter is October 22 nd �All missing assignments are due by next Monday, October 19 th �Yes. I know I’ve been slacking. I will get your project grades in before the quarter ends. �IA (Internal Assessment) Components: (2) Data Collection & Processing and (3) Discussion, Evaluation, & Conclusion Rough draft due on November 3 rd Final draft due November 5 th �Next week we will discuss IA rubric and lab report expectations
2. 3 Measuring Biotic Components
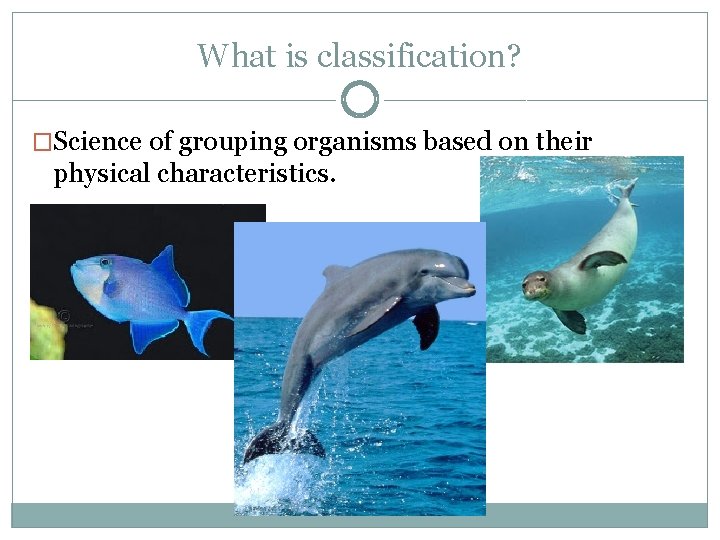
What is classification? �Science of grouping organisms based on their physical characteristics.
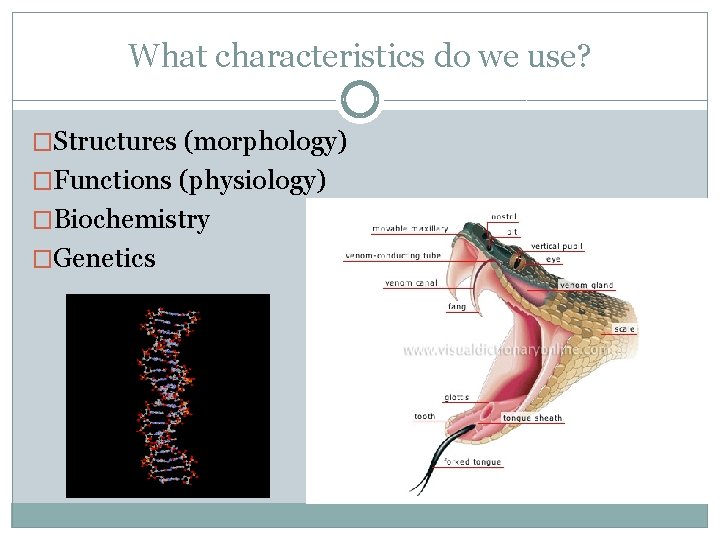
What characteristics do we use? �Structures (morphology) �Functions (physiology) �Biochemistry �Genetics
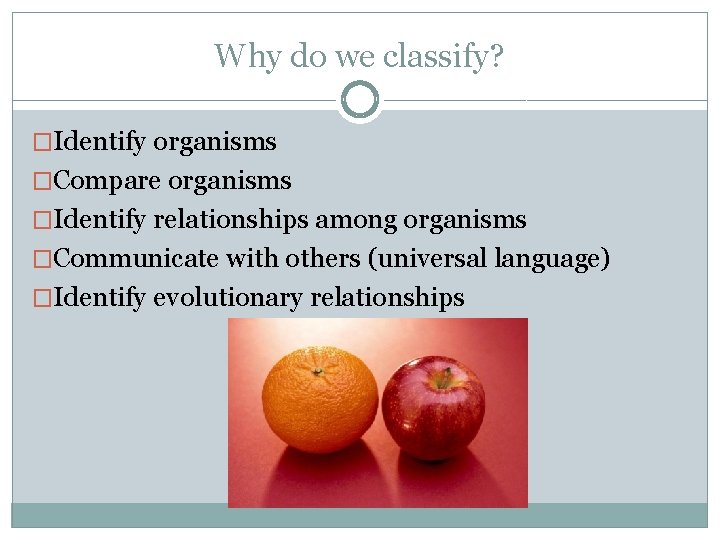
Why do we classify? �Identify organisms �Compare organisms �Identify relationships among organisms �Communicate with others (universal language) �Identify evolutionary relationships
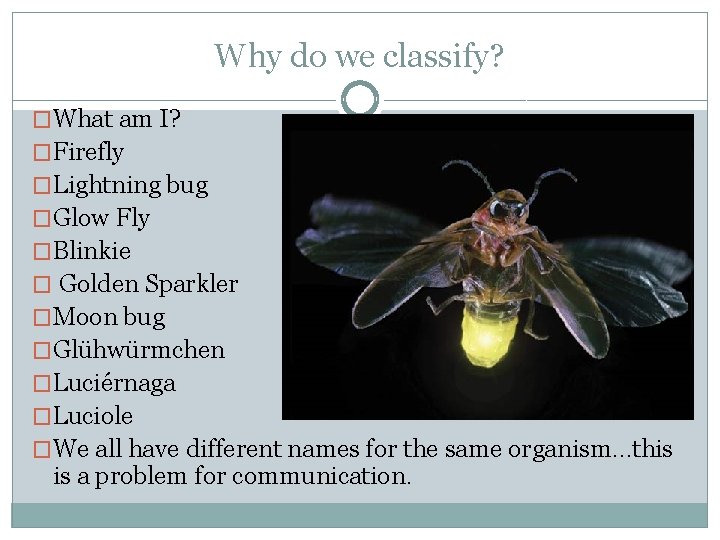
Why do we classify? �What am I? �Firefly �Lightning bug �Glow Fly �Blinkie � Golden Sparkler �Moon bug �Glühwürmchen �Luciérnaga �Luciole �We all have different names for the same organism…this is a problem for communication.
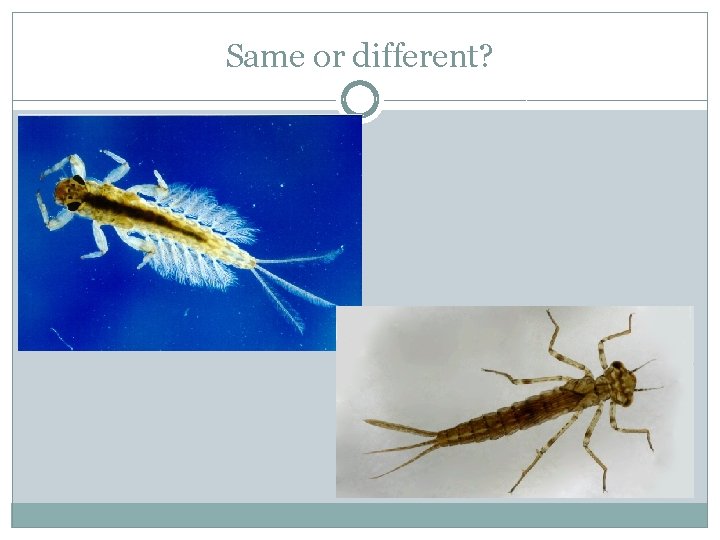
Same or different?
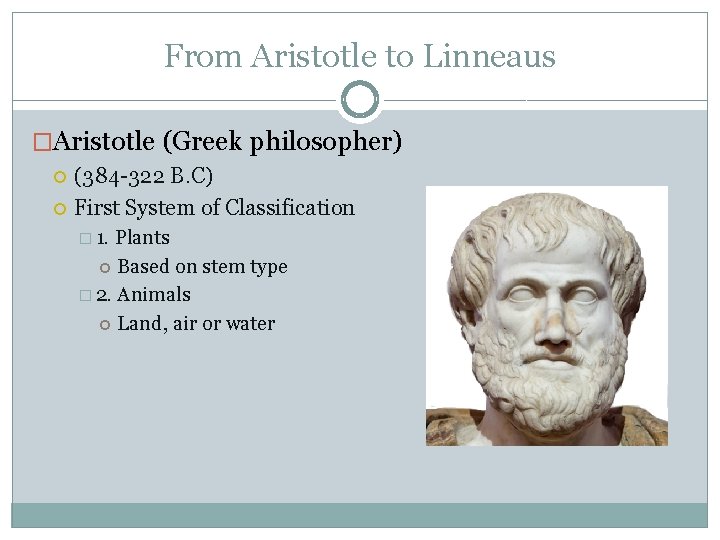
From Aristotle to Linneaus �Aristotle (Greek philosopher) (384 -322 B. C) First System of Classification � 1. Plants Based on stem type � 2. Animals Land, air or water
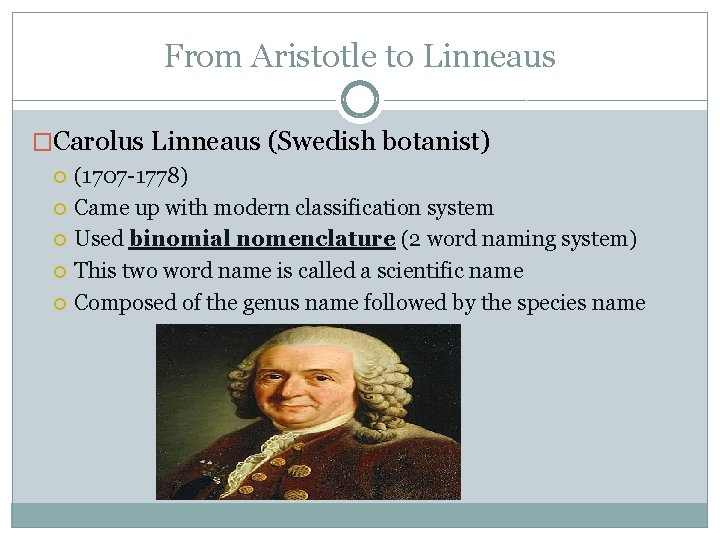
From Aristotle to Linneaus �Carolus Linneaus (Swedish botanist) (1707 -1778) Came up with modern classification system Used binomial nomenclature (2 word naming system) This two word name is called a scientific name Composed of the genus name followed by the species name
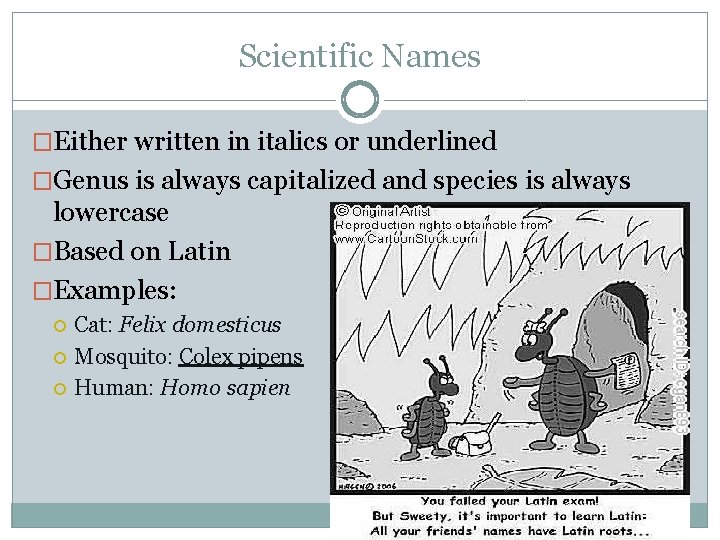
Scientific Names �Either written in italics or underlined �Genus is always capitalized and species is always lowercase �Based on Latin �Examples: Cat: Felix domesticus Mosquito: Colex pipens Human: Homo sapien
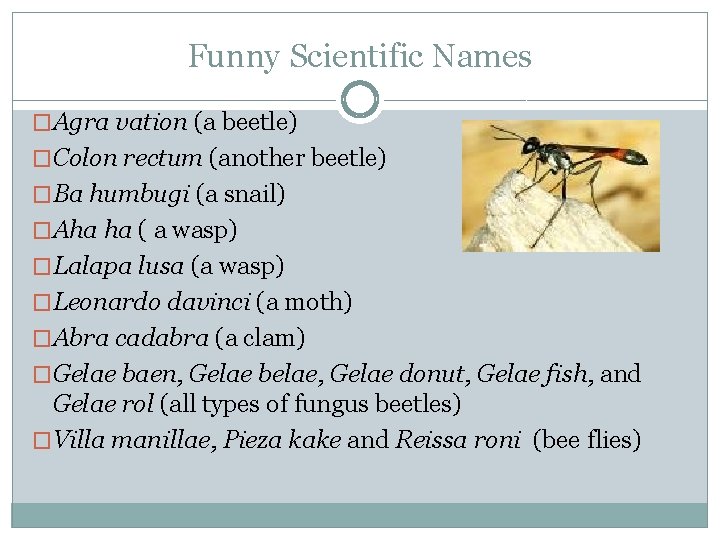
Funny Scientific Names �Agra vation (a beetle) �Colon rectum (another beetle) �Ba humbugi (a snail) �Aha ha ( a wasp) �Lalapa lusa (a wasp) �Leonardo davinci (a moth) �Abra cadabra (a clam) �Gelae baen, Gelae belae, Gelae donut, Gelae fish, and Gelae rol (all types of fungus beetles) �Villa manillae, Pieza kake and Reissa roni (bee flies)
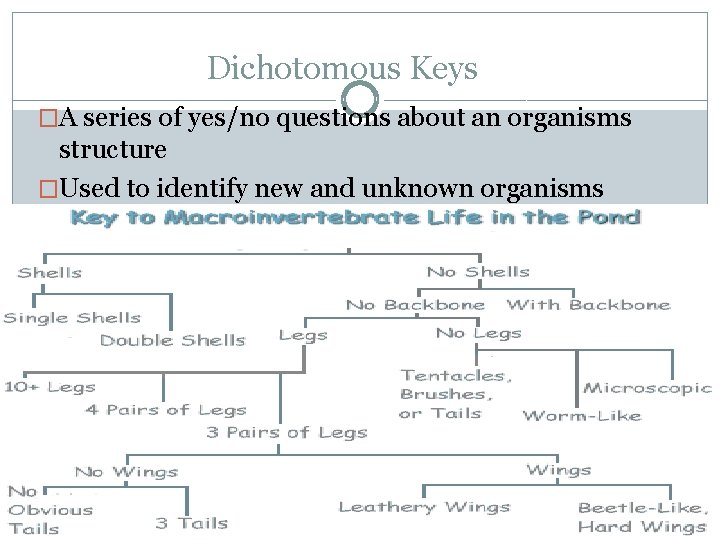
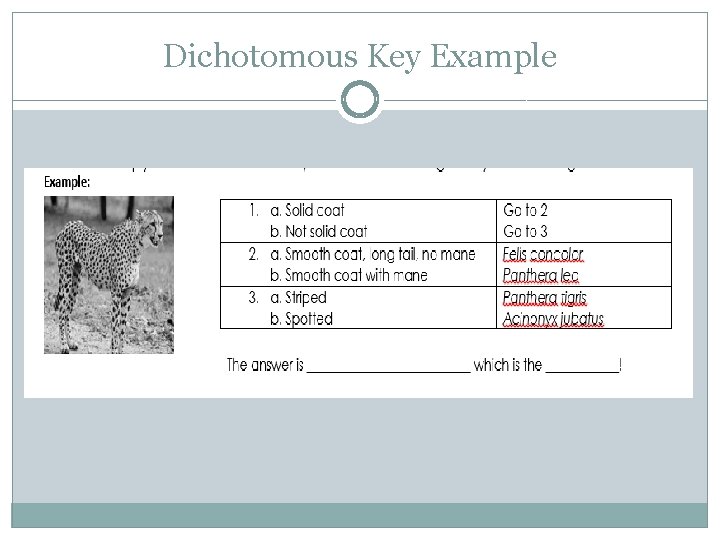
Dichotomous Keys �A series of yes/no questions about an organisms structure �Used to identify new and unknown organisms
Dichotomous Key Example
Dichotomous Key Practice �Alien Dichotomous Worksheet �Due next class �Must finish creating your own key today and trade with a partner
Do Now 1. Take out your Alien Dichotomous Worksheets 2. You have 5 minutes to add any detail to your key that you created 3. Remember, this is a grade! 4. Wait for further instruction
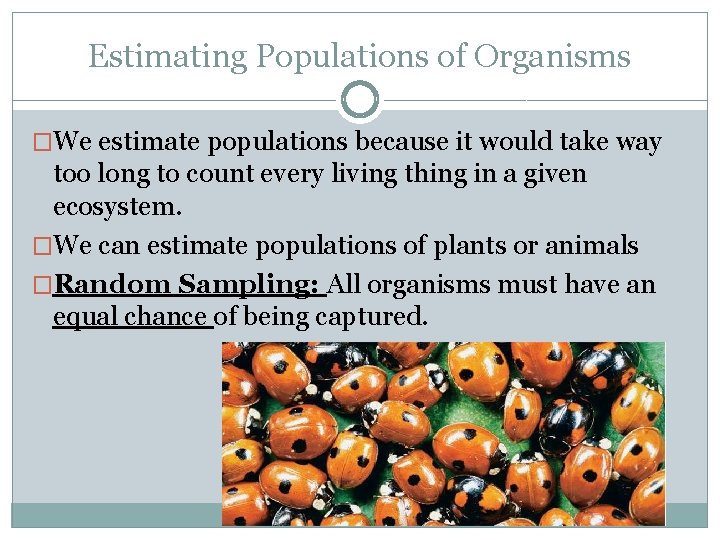
Estimating Populations of Organisms �We estimate populations because it would take way too long to count every living thing in a given ecosystem. �We can estimate populations of plants or animals �Random Sampling: All organisms must have an equal chance of being captured.
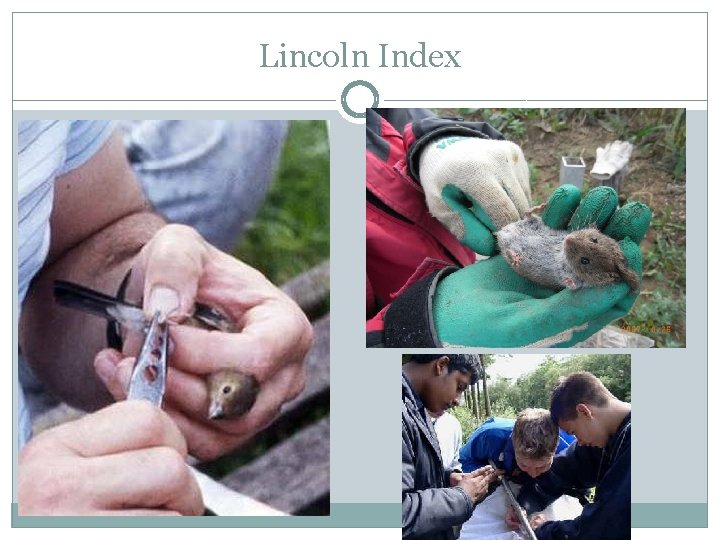
Estimating Populations of Animals �Lincoln index (capture-mark-release-recapture) n 1 x n 2 N = n 3 • N = Total number of population • n 1 = Number of animals first (mark all of them) • n 2= Number of animals captured in second sample • n 3= Number of marked animals in second sample Ex. 40 mice were caught, marked (tail tattoo) and released. Later, 10 mice were recaptured, 4 of which had tattoo marks.
Lincoln Index
Lincoln Index Practice Problem �An ornithologist captured 450 finches, marked them with an ankle band released them. One week later she recaptured 237 finches, 50 of which had ankle bands. What is the total finch population?
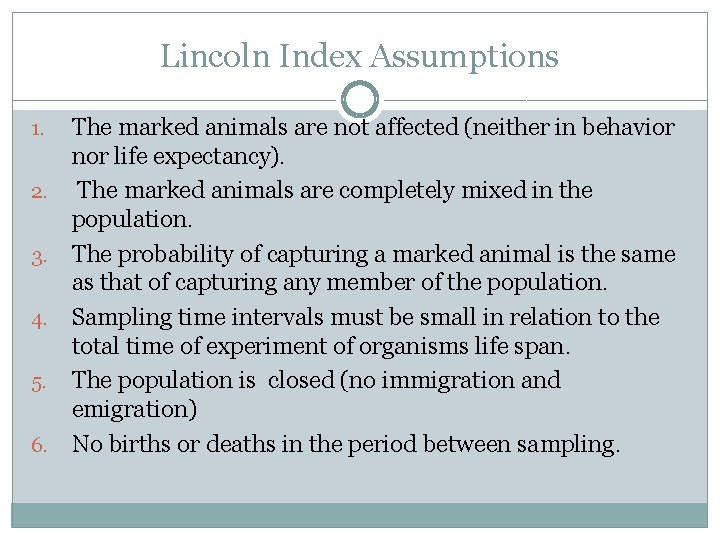
Lincoln Index Assumptions 1. 2. 3. 4. 5. 6. The marked animals are not affected (neither in behavior nor life expectancy). The marked animals are completely mixed in the population. The probability of capturing a marked animal is the same as that of capturing any member of the population. Sampling time intervals must be small in relation to the total time of experiment of organisms life span. The population is closed (no immigration and emigration) No births or deaths in the period between sampling.
Lincoln Index Bean Lab
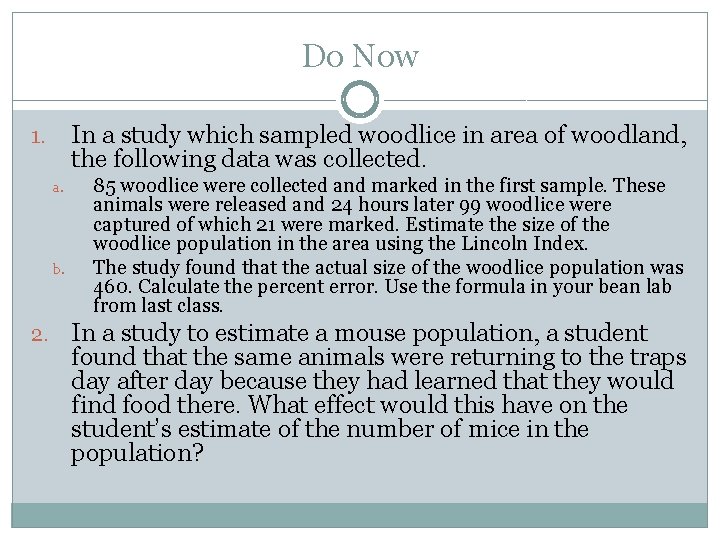
Do Now In a study which sampled woodlice in area of woodland, the following data was collected. 1. a. b. 2. 85 woodlice were collected and marked in the first sample. These animals were released and 24 hours later 99 woodlice were captured of which 21 were marked. Estimate the size of the woodlice population in the area using the Lincoln Index. The study found that the actual size of the woodlice population was 460. Calculate the percent error. Use the formula in your bean lab from last class. In a study to estimate a mouse population, a student found that the same animals were returning to the traps day after day because they had learned that they would find food there. What effect would this have on the student’s estimate of the number of mice in the population?
Retesting �To make up a test/quiz, you must schedule a time to stay after school �DO NOT WAIT THE DAY OF TO ASK!!! �Ms. Simmons is here most days until 3: 30/4: 00 �You are ELIGIBLE for a retest if you scored an 80% or below! NO EXCEPTIONS! �Retests cannot be completed during class time �If there are tests from 1 st quarter you want to make up, it does not have to be done by Wednesday �Keep Calm! I can always go back and change your grade at a later date!
Google Classroom �Class Code: br 7 e 01 �Class Updates �Upload assignments
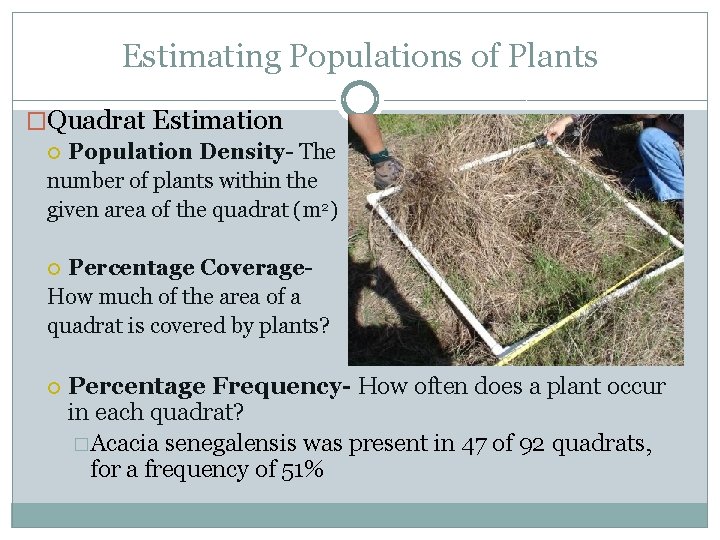
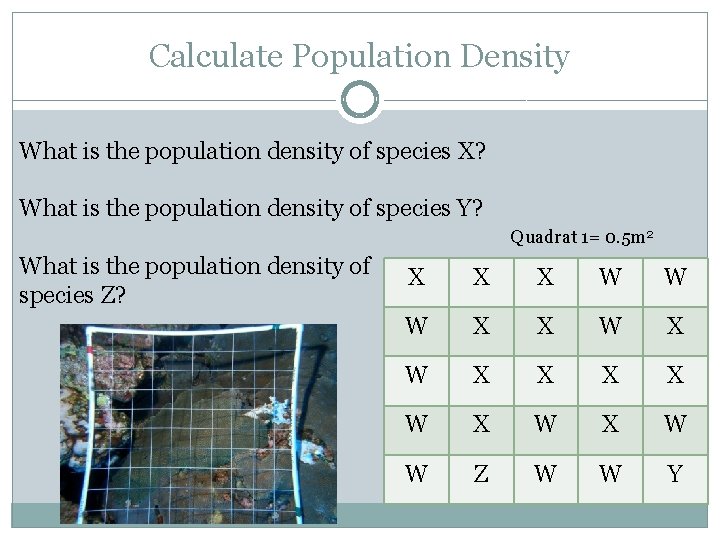
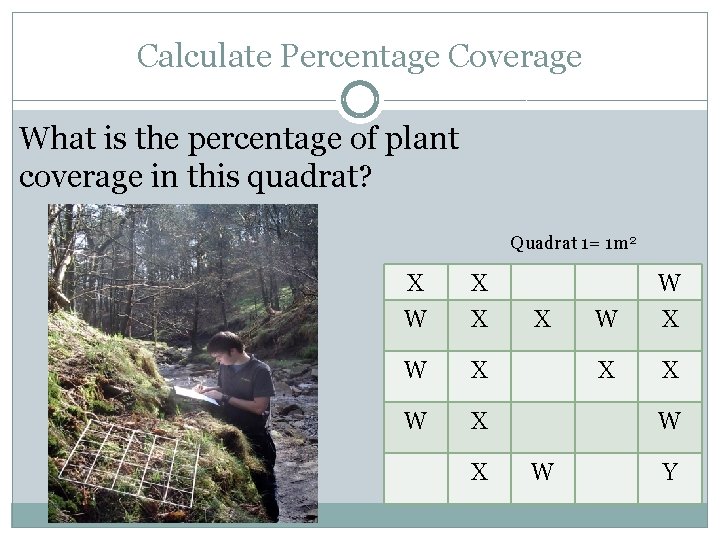
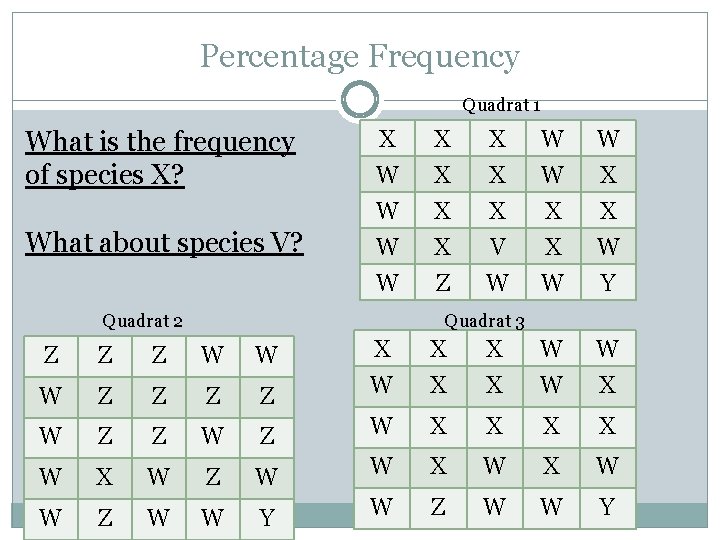
Estimating Populations of Plants �Quadrat Estimation Population Density- The number of plants within the given area of the quadrat (m 2) Percentage Coverage- How much of the area of a quadrat is covered by plants? Percentage Frequency- How often does a plant occur in each quadrat? �Acacia senegalensis was present in 47 of 92 quadrats, for a frequency of 51%
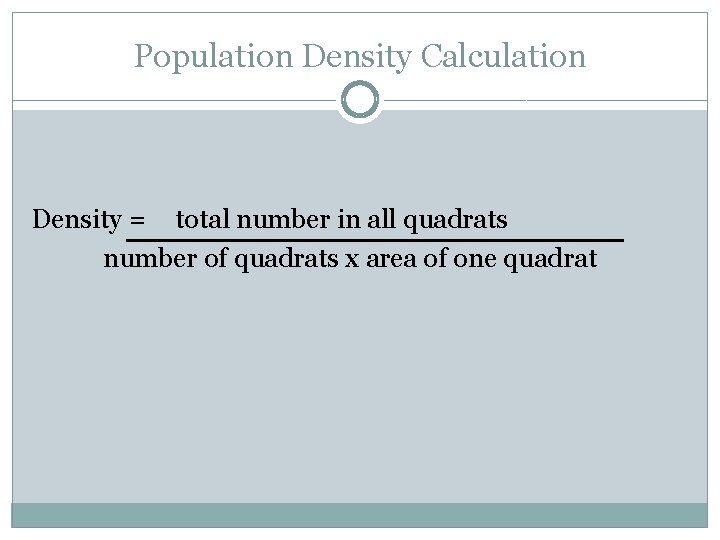
Population Density Calculation Density = total number in all quadrats number of quadrats x area of one quadrat
Calculate Population Density What is the population density of species X? What is the population density of species Y? Quadrat 1= 0. 5 m 2 What is the population density of species Z? X X X W W W X X W X W W Z W W Y
Calculate Percentage Coverage What is the percentage of plant coverage in this quadrat? Quadrat 1= 1 m 2 X W X W X X X W W Y
Percentage Frequency Quadrat 1 What is the frequency of species X? What about species V? X W W W X X X X V W W X X W W Z W W Y Quadrat 2 Quadrat 3 Z X W X X W W W X W Z W X X W Z W W X W W W Y W Z W W Y Z Z Z W W W Z Z Z W X W Z
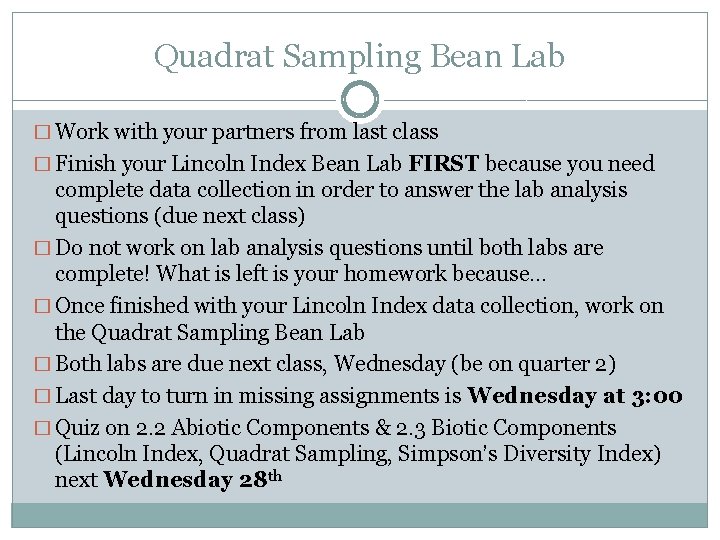
Quadrat Sampling Bean Lab � Work with your partners from last class � Finish your Lincoln Index Bean Lab FIRST because you need complete data collection in order to answer the lab analysis questions (due next class) � Do not work on lab analysis questions until both labs are complete! What is left is your homework because… � Once finished with your Lincoln Index data collection, work on the Quadrat Sampling Bean Lab � Both labs are due next class, Wednesday (be on quarter 2) � Last day to turn in missing assignments is Wednesday at 3: 00 � Quiz on 2. 2 Abiotic Components & 2. 3 Biotic Components (Lincoln Index, Quadrat Sampling, Simpson’s Diversity Index) next Wednesday 28 th
Do Now Make sure your name is on both labs (Lincoln Lab and Quadrat Sampling) 2. Staple any calculations to your labs. You must show work to get full credit! 3. Pass them up for Ms. Simmons to collect 1.
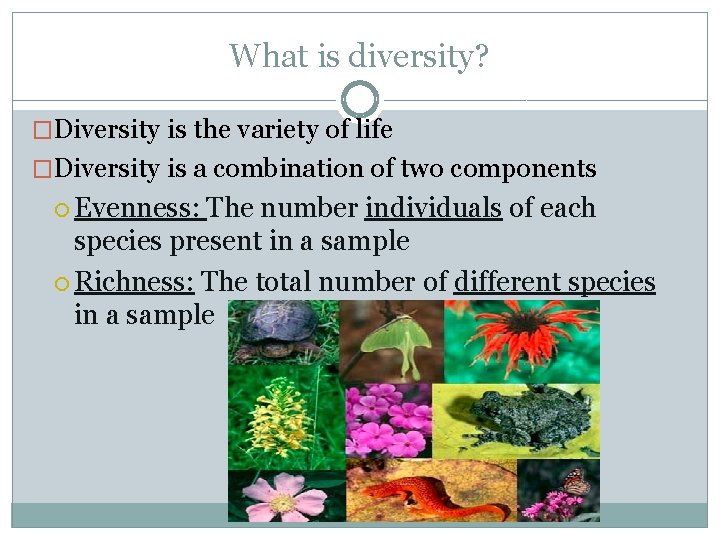
What is diversity? �Diversity is the variety of life �Diversity is a combination of two components Evenness: The number individuals of each species present in a sample Richness: The total number of different species in a sample
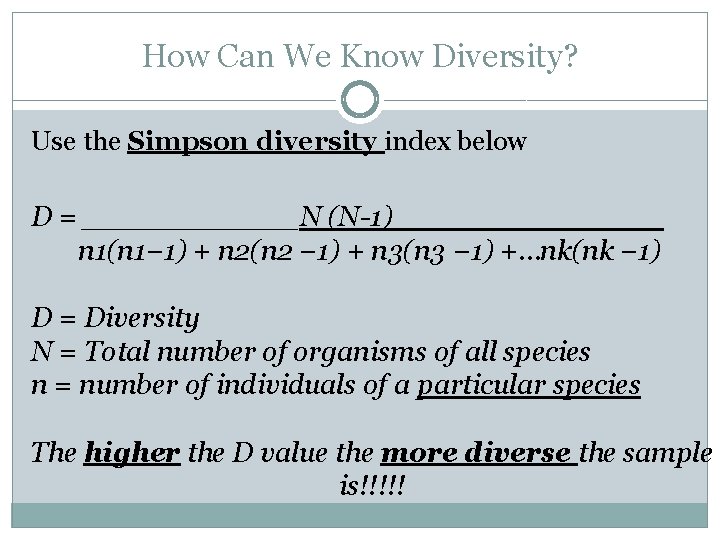
How Can We Know Diversity? Use the Simpson diversity index below D = ______N (N-1)________ n 1(n 1− 1) + n 2(n 2 − 1) + n 3(n 3 − 1) +…nk(nk − 1) D = Diversity N = Total number of organisms of all species n = number of individuals of a particular species The higher the D value the more diverse the sample is!!!!!
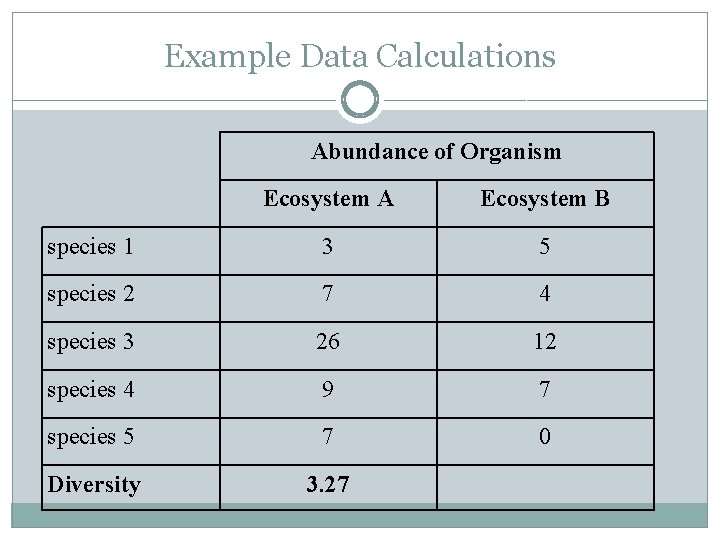
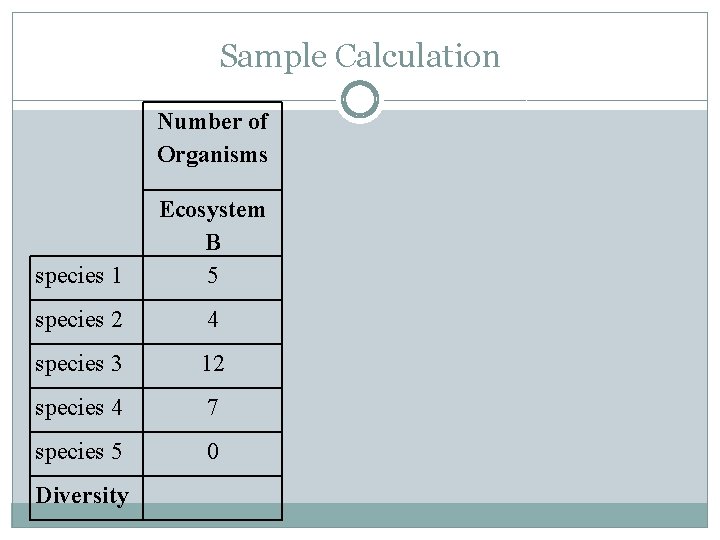
Example Data Calculations Abundance of Organism Ecosystem A Ecosystem B species 1 3 5 species 2 7 4 species 3 26 12 species 4 9 7 species 5 7 0 Diversity 3. 27
Sample Calculation Number of Organisms species 1 Ecosystem B 5 species 2 4 species 3 12 species 4 7 species 5 0 Diversity
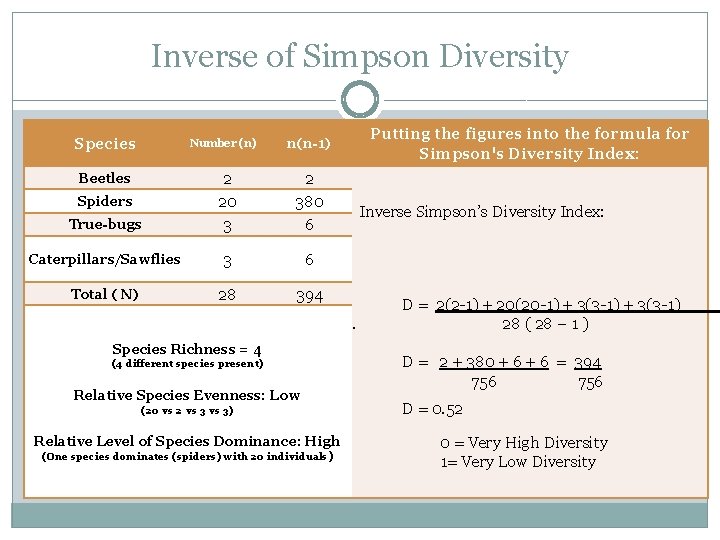
Inverse of Simpson Diversity Species Number (n) True-bugs 2 20 3 2 380 6 Caterpillars/Sawflies 3 6 Beetles Spiders Total ( N) 28 Putting the figures into the formula for Simpson's Diversity Index: n(n-1) 394 Species Richness = 4 (4 different species present) Relative Species Evenness: Low (20 vs 2 vs 3) Inverse Simpson’s Diversity Index: D = 2(2 -1) + 20(20 -1) + 3(3 -1) . 28 ( 28 – 1 ) D = 2 + 380 + 6 = 394 756 D = 0. 52 Relative Level of Species Dominance: High 0 = Very High Diversity (One species dominates (spiders) with 20 individuals ) 1= Very Low Diversity
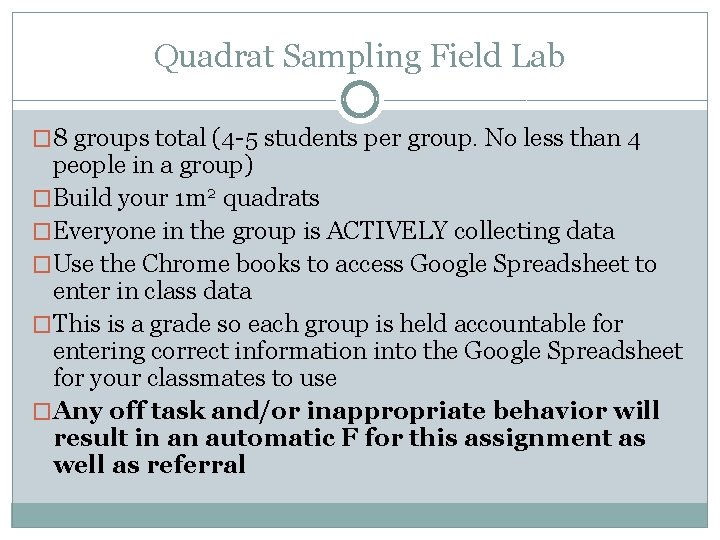
Quadrat Sampling Field Lab � 8 groups total (4 -5 students per group. No less than 4 people in a group) �Build your 1 m 2 quadrats �Everyone in the group is ACTIVELY collecting data �Use the Chrome books to access Google Spreadsheet to enter in class data �This is a grade so each group is held accountable for entering correct information into the Google Spreadsheet for your classmates to use �Any off task and/or inappropriate behavior will result in an automatic F for this assignment as well as referral
Like. That. Flower – Flower Identification App
Google Spreadsheet The link is also found on my Weebly under 2. 3 Biotic Components
Simpson Diversity Lab �This is the lab you are using for your Internal Assessment �The lab analysis questions and all work collected on the worksheet must be organized following the ESS IA Lab Write-Up Guide �You will receive an overall grade for the lab report �You will receive a separate grade using the IA Rubric for 2 of the 3 components Data Collection and Processing (DCP) Discussion, Evaluation, and Conclusions (DEC) THESE WILL BE FORMAL GRADES!!! ROUGH DRAFT DUE DATE: FINAL DUE DATE:
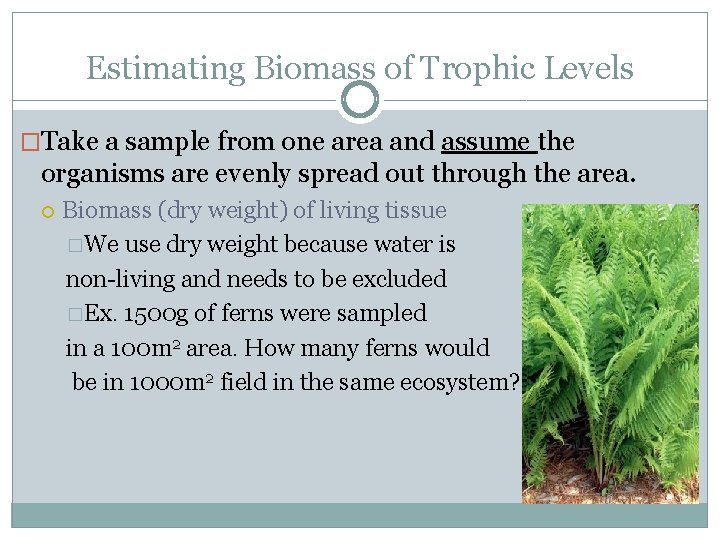
Estimating Biomass of Trophic Levels �Take a sample from one area and assume the organisms are evenly spread out through the area. Biomass (dry weight) of living tissue �We use dry weight because water is non-living and needs to be excluded �Ex. 1500 g of ferns were sampled in a 100 m 2 area. How many ferns would be in 1000 m 2 field in the same ecosystem?