Do current concussion testing protocols identify and predict


 ›")


 SD Baseline Prelims")
 2013 N=236 Avg= 77. 6 68/95/9")


 Number ppts 189 Range 25 -50 s Average 34. 1")


 Task CHRT")


")

 (winners vs")
")


 Mean PLA Total Hits (G): 68.")
: Median PLA (G): Max PLA (G): 26.")
: Median PLA")
 Boxer 2 (Headband)")


- Slides: 61
Do current concussion testing protocols identify and predict acute concussive episodes in boxers? Our experience with Bengal Bouts 2012 -2013
Why do we want to identify concussed athletes? › First, to screen for more catastrophic injury such as neck fracture, subdural or epidural hematoma › Secondly, to remove a concussed athlete from competition so as to protect them from further brain trauma › Thirdly, to protect athletes from the tyranny of dysfunctional competition that promotes winning whatever the cost › Fourthly, because it’s the law!
Zach Lystedt The Washington teenager who inspired groundbreaking health and safety legislation. By: Sheila Mickool | Seattle Health Fall/Winter 2012 | FROM THE PRINT EDITION “ Because of the efforts of a wide range of community partners and inspired by Zack’s story, 40 states and the District of Columbia have passed player protection laws — surpassing the 21 states that require children to wear bicycle helmets, 32 states with primary seatbelt laws and 19 states requiring helmets for motorcycle riders. ”
The Challenge › How do we rapidly and remotely identify concussive head injury in athletes exposed to head trauma as a consequence of competition? – Acutely › › Sideline Physical examination- “old standby” SCAT 3 Balance testing King-Devick – Remotely › Computerized neurocognitive testing › Paper and Pencil neurocognitive tests › Neuro. Com/Bio. Sway balance testing
The Bengal Bouts › BENGAL BOUTS › Legendary football coach Knute Rockne first organized boxing at Notre Dame in 1920. Yet it is the purpose of raising funds for the Holy Cross Missions in Bangladesh that truly gave the Bengal Bouts identity in 1931.
Bengal Bouts › Amateur boxing tournament run by the Notre Dame Men’s Boxing Club in conjunction with the Department of Rec sports › 4 nights of boxing: Preliminaries, Quarterfinals, Semifinals and Finals spanning approximately 2 -3 weeks › 14 weight classes, 3 round matches, single elimination, over 130 participants › Approximately 140 -165 matches cumulative
Bengal Bouts › All boxers screened for medical contra-indications › Intense physical conditioning required › Controlled sparring instruction pre-bouts by experienced boxers and staff › Strict supervision by referees and coaches › EMT/Athletic Trainers at all sparring sessions › Physicians and Para-medics at ringside during tournament
The 2012 - 2013 Medical Study-IRB approved › Section VI: Research Design › › Introduction and Background › State the problem and the hypothesis › Concussion in sport occurs. Symptoms vary and may be difficult for athletes, coaches, and medical staff to recognize. Various tests have been developed to aid in the recognition of concussion. The goal of this study is to collect physical examination and concussion specific testing data in an attempt to evaluate and compare multiple concussion screening tests in a population at high risk for concussive and sub-concussive injury. In addition, an attempt will be made to quantify the forces sustained by boxers during a four-week tournament. › › Provide the scientific or scholarly reason for this study and background on the topic › Concussion has been defined as a complex pathophysiologic process affecting the brain induced by traumatic biomechanical forces. Concussion cause both short-term and long-term cognitive impairment. Unrecognized concussion can result in unnecessary repeated head trauma putting an athlete at risk for second impact syndrome and post-concussive syndrome, both of which may have lifelong implications. Tests have been developed to aid in the diagnosis of a concussion and are listed below. › The Sport Concussion Assessment Tool 2 (SCAT 2) and King-Devick test assess an acute concussion in a competition setting. The SCAT 2 includes the Sideline Assessment Tool (SAC) (which tests orientation, immediate memory, concentration, and delayed recall) and the modified Balance Error Scoring System (BESS). The modified BESS is a series of balance tests that evaluate the vestibular and occulo-motor system. The King-Devick test is based on measurement of the speed of rapid number naming and tests eye movements, attention, and language. A recent research study involving boxers and MMA fighters determined that the King-Devick test is an accurate and reliable method for identifying athletes with head trauma and may be helpful in sideline screening. The Axon Sports Computerized Cognitive Assessment Tool (CCAT) is a neuropsychological assessment of processing speed, attention, learning, working memory speed and accuracy. This test is performed within 24 hours of a suspected concussion. A review in the British Journal of Sports medicine noted that such computerized tests have a high sensitivity and specificity and may aid in the detection of very subtle cognitive changes. All of the above tests require baseline scores acquired in an uninjured state for comparison to scores acquired after
Our Goal › To compare the efficacy of 4 commonly employed methods for identifying concussion – – Physical Exam Axon CCAT (computerized concussion assessment tool) Scat 2 King-Devick › To quantify the volume of head trauma in boxers – Punch counts utilizing hi-def video – Peak and average linear and rotational force utilizing X 2 accelerometers › To measure muscle fatigue in boxers – Power data utilizing vertical leap
Pre tournament › Axon CCAT baseline testing › SCAT 2 assessment (2012 -2013) › King-Devick testing (2013) › Vertical Leap (2012) (2012 -13)
Tournament Testing › Every boxer received the following: – Physical exam immediately post bout by an experienced physician – SCAT 2 testing within 60 minutes – King-Devick testing within 60 minutes (2013) – Vertical Leap assessment within 60 minutes post bout – Axon CCAT within 2 -24 hours post bout (2012 -13) (2012) › Testing was performed on every enrolled boxer after each and every boxing match › Hi def video of every match (2012) › X 2 mouth guard and headband assessment numbers) (2012 limited
SCAT-2 Combines features of concussion questionnaire, Glasgow coma scale, Maddocks questions, Sideline Assessment Concussion (SAC)
Components of SCAT-2 › Symptom: – Total: 0 -22 – Severity score 0 -132 › Balance: 0 -30 › Memory: 0 -15 › Concentration: 0 -5 › Delayed recall: 0 -5 › Coordination: 0 -1 › Orientation: 0 -5 › Physical symptom: 0 -2 › Glasgow Coma Scale: 15 › Total Score: 100 › For our study, the best score achievable is 85 as we omitted the GCS
Axon CCAT- a deck of playing cards › The tasks are: › Has the Card Turned Over? - This simple reaction time task asks you to identify when a card has turned from face-down to face-up. The task is a measure of processing speed and simple attention. › Is the Card Red? – This task asks you to indicate if a card is red or black. The task is a measure of decision-making speed (or choice reaction time), vigilance, attention and concentration. › Have You Seen this Card Before In this Task? – This task requires you to choose whether or not a playing card has been shown previously during the task. The task is a measure of new learning and memory, and is considered a higher level task. › Is the Previous Card the Same? – This task asks you to identify if the current face-up card matches the previous card. The task is a measurement of working memory.
King-Devick Testing
King-Devick › The King- D evick test measures the time in seconds required for the athlete to read aloud three different series of numbers. › A score slower than 5 seconds or greater is considered indicative of concussion
Physical Exam › The physicians ability to detect “concussion” utilizing an interview of the patient that assesses memory, cognitive ability, physical appearance, demeanor, and affect. The physical component may include balance, saccadic eye movement, nystagmus, and musculoskeletal stability with and without physical exertion. › Still considered to be the “Gold Standard”
Questions to be answered? › What does our baseline data show? › Is there significant group change between baseline and post bout tests? – By bout (prelim vs final) – By total number of bouts fought › Is there significant individual change by bout? › What is the testing difference between boxers with and without concussion? › What about testing in hi risk vs lo risk boxers? › Does cumulative hits or force of hits predict concussion risk? › Is there significant muscle weakness post bout that may affect balance testing and overall SCAT 2 performance?
Our Findings: Demographics 2012 2013 93 130 119 147 Prelims 43 65 Quarterfinals 43 48 Semifinals 22 22 Finals 11 12 Participants Total # of fights Concussions 13 ( 3 sparring) 8
SCAT 2 Totals 2012 SCAT 2 Total (score out of 85) SD Baseline Prelims Quarterfina ls Semifinals Finals Concusse d 76. 6 (n=120) 75. 53 75. 36 76. 34 74. 86 70. 28 4. 3 5. 2 5. 9 7. 4 3. 95
Density Plot of SCAT 2 total scores (2013) 2013 N=236 Avg= 77. 6 68/95/9 9 Plot for all SCAT 2 Total baselines; mean=77. 6, sd=4. 1. Vertical dashed lines denote +/ - 2 standard deviations from the mean. Tick marks on the horizontal axis denote individuals. There are no subjects above 2 sd; there are several below -2 sds.
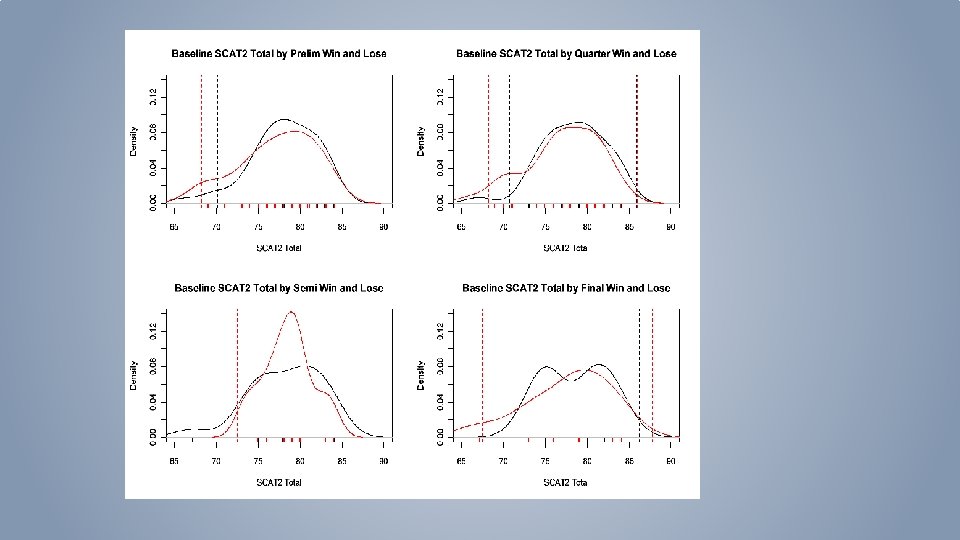
Baseline SCAT-2 separated by winners and losers Plot for SCAT 2 Total baselines broken down by Prelim Winner and Loser. Black lines denote Winners, Red lines denote Losers. Dashed lines are once again +/- 2 sds from mean.
Baseline SCAT-2 separated by winners and RSC Plot for SCAT 2 Total baselines broken down by Prelim Winner and RSC. Black lines denote Winners, Red lines denote Losers. Dashed lines are once again +/- 2 sds from mean.
2013 SCAT 2 results sorted by winner and loser BASELINE 2012 Prelims 76. 6 Quarterfinals Semifinals 75. 36 75. 53 Finals Concussed 74. 86 70. 28 76. 34 Winners Losers Number 171 58 60 42 38 18 15 11 11 8 Avg score 77. 36 78. 09 74. 83 77. 36 74. 42 78. 33 78. 27 81. 09 75. 91 67. 88* Std dev 3. 32 4. 13 5. 73 4. 8 5. 37 3. 94 4. 78 2. 94 6. 78 5. 84 Median 78 79 76 79 75 79 80 82 79 68
SCAT 2 Total plotted against symptom number SCAT 2 Score What component of the SCAT 2 carries the most 0 2 4 6 8 symptom number 10 12 14
Mixed Effects Model Analysis of SCAT 2 Table 4 shows means and standard deviations for the various components of the SCAT 2 assessment. All data are reported as mean ±SD. Table 4: Means and standard deviations for SCAT 2 components test over time. Measure Baseline (n= 91) Prelim (n= 64) Quarter (n=59 ) Semis (n= 32) Balance Score Total Symptom Severity SAC Subtotal Total # Symptoms No one component of the SCAT 2 contributes predominately to change in score! Finals (n= 18)
SCAT 2 Particulars 2012/2013 Symptom # Symptom severity SCAT 2 Total Balance Score Baseline 2012 2. 9 3. 88 76. 4 27. 17 2013 1. 47 2. 89 77. 62 27. 08 3. 3 8. 6 73. 65 26. 8 2012 6. 7 11. 3 70. 2 25. 1 2013 8. 2 8. 4 67. 9 28. 0 RSC 2012 2013 Concussed
2013 Concussed athletes 8 counts RSC Saccades Type 2/14013 2 0 slow after bout answers appropriately 0 2/13013 2 1 knockout (brief LOC) 0 SCAT 2 score 79 bal 30/30 sympt score 6/9 KD baseline 37 / post bout 28 2/13013 0 1 positive HA post match 0 SCAT 2: 69 11/29 follow up Scat 2: 2/14: 0/0 no concussion Dx 2/13/2013 0 0 no symptoms post match 2/20/2013 2 1 concussed 1 horizontal nystagmus In UHS, 2/21: 14/26 Bes 27/30 2/25: 13/19 30/30 2/27: 2/2 Had low baseline Scat 2 -70 2/20/2013 1 1 knocked out 1 horizontal nystagmus concussed 2/21: sympt quest 5/5 2/25: 0/0 2/26/2013 2 1 felt fuzzy 30 minutes p fight 0 2/26/2013 2 1 concussed 3/1/2013 1 1 KO Follow Up post bout score 74 -Ringside dx concussion admitted to Health Center-symptom question 7/8 next day 2/14 at 10 AM sympt quest 4/5 D/C at 2: 35 PM went to ER in middle of night 2/14 vertigo and headache: CT scan performed and normal repeat symptom questionairre 2/14 at 3: 30 am 6/23 symptoms repeat exam 2/14 at 2: 15 PM 0 symptoms, bal 25/30 KD 31 sec. No diagnoses of concussion made ? Migraine post bout Post bout SCAT 2: 74 2/28: 0/0 exam 2/27 11/23 28/30 0 concussed follow up OK 48 hrs later
2013 SCAT 2 clinically concussed individuals Baseline Concussion 44 Sympto m burden 8 47 10 29 76 49 9 30 79 54 1 30 83 44 28 25 69 48 4 27 77 39 28 23 62 42 22 29 70 43 20 29 72 41 13 28 66 47 0 27 74 49 5 27 73 43 9 24 67 48 8 23 67 42 9 18 60 46. 6 8. 9 27. 4 72. 6 44. 29 14. 14 26. 43 70. 7 3. 9 6. 1 2. 1 5. 4 3. 20 11. 22 2. 57 5. 41 SAC Balance Score SAC Sympto m burden 26 69 45 5 27 72 Balance Score
King Devick Baseline (2013) Number ppts 189 Range 25 -50 s Average 34. 1 s Median Std Dev 33 s 4. 9 s Pre-season K–D test 1, median (range), entire cohort (n=219) 38. 6 s (26. 1– 58. 0) Pre-season K–D test 2, median (range) (sprint football only, n=36) 36. 1 s (23. 4– 52. 1) Pb 0. 0001 vs. test 1 a Best pre-season K–D test, median (range) (n=219) 37. 9 s (23. 4– 58. 0 The King–Devick test and sports-related concussion: Study of a rapid visual screening tool in a collegiate cohort☆, ☆☆ Kristin M. Galetta a, Lauren E. Brandes a, Karl Maki a, a Department
King Devick Results Count Average Median Std dev Baseline KD prelims Quarterfinals Semifinals Finals 189 120 85 46 21 34. 07 s 31. 09 s 31. 35 s 29. 59 s 29. 14 s 33. 00 s 30. 00 s 33. 00 s 4. 90 s 4. 50 s 3. 80 s 3. 42 s 3. 48 s
Improvement in KD scores from baseline to last fight Task King. Devick #Bouts n 1 bout* 73 2 bouts* 45 3 bouts* 24 4 bouts* 9 Baseline Task #Bouts King. Devick 1 2 3 4 Test 1 P-value for change over time <0. 001 0. 008 Test 2 Test 3 Adjusted p-value <0. 001 0. 032 Repeated measures analysis of variance was conducted for both tasks to determine whether the change over time was statistically significant. The p-values for change over time are displayed in Table 2, along with (Bonferroni) adjusted p-values to account for the multiple tests performed. The decrease in mean King-Devick score was statistically significant for all groups of fighters. Test 4
KD Times sorted by Winners and Losers Prelims Quarters Semis Finals W L W L 30. 6 s 31. 5 s 31. 1 s 31. 6 s 29. 3 s 30. 1 s 29. 3 s 28. 9 s
KD results in RSC and concussed boxers 2013 Number Baseline Post-Injury RSC boxers 21 34. 95 s 31. 6 s Concussed boxers 7 37. 0 s 32. 3 s
Axon CCAT data. Baseline Log 10 =1 Log 100=2 Log 100=3 Axon Data Numbe Choice reaction r Time Is the card red or black? 2012 2013 115 224 2. 65 Simple Reaction Time Learnin g One Back Is this the same card as previously seen? Is the card there? Have you seen this card before? 2. 52 (330 msecs) 2. 89 2. 78 0. 05 0. 06 0. 08 0. 107 2. 66 2. 5 2. 91 2. 79 0. 05 0. 06 0. 2
2012 Axon sorted by number of bouts fought Number one bout two bouts three bouts 4 bouts 33 39 21 6 Choice reaction Time 2. 67 2. 66 2. 64 Simple reaction Time 2. 51 2. 49 2. 45 2. 49 Learning 2. 91 2. 94 2. 84 2. 9 One back 2. 78 2. 79 2. 75 2. 74
Does Axon scores change with number of bouts fought ? (2012 Data) Task CHRT DETV OCL 2 ONEB #Bouts n 1 bout 33 2 bouts 33 3 bouts 21 4 bouts 5 Baseline Test 1 Test 2 Test 3 Test 4
2013 Axon sorted by winner and loser Prelims Quarters winner loser winner Choice reaction Time 2. 67 2. 66 Simple reaction Time 2. 5 Semis Finals loser winner loser 2. 65 2. 66 2. 63 2. 65 2. 49 2. 5 2. 48 2. 46 2. 62 2. 64
Physician comments on concussion Hurt sparring 1/21 14/30 sym, took Axon 4 days later and barely passed Axon ID 3504 Baseline Date 12/8/2011 15: 49 30919 12/8/2011 21: 30 29547 11/29/2011 9: 53 after injury test Jan 25 th Pt hurt 2/2 sparring. Symptom score 13/41. 3 previous concussions in HS Moderaely severe. No axon test post concussion concussed 2/22: no change axon: recovered quickly. Symptom Score 16/31 2/23/2012 0: 00 Concussed March 3, serious dehydration post bout, failed after injury test if best baseline used 1904 concussed 1/28 sparring 17/41 axon abnormal when compared to best baseline 3363 concussed 2/28 passed axon did not remember 3 rd round 3494 12/4/2011 21: 45 29697 11/30/2011 12: 22 Pt failed 2/23 post bout test. Retook test next day and passed. Pt came to office on 2/29 with complaints that he thought he was concussed after the bout This patient lost a very difficult match on 3/3 and sustained an orbital blowout fx. His after injury test was 3/5 and is compared to his best baseline This boxer was dazed post bout 2/22 and felt to be concussed. Seen 2/24 with sx score of 10/16. After Injury test wnl. Asymptomatic 3 days after injury Pt came to office 3/1 with c/o head pressure and sx score 12/29: was 8/12 post bout. Did not look concussed in office 11/30/2011 13: 58 2/28/2012 22: 47 3/4/2012 0: 00 2/14/2011 0: 00 1/31/2012 0: 00 2/29/2012 10: 39 29697 2/13/2012 1: 28: 57 PM 29697 2/24/2012 9: 42: 13 AM 3516 2/29/2012 17: 23 3516 30962 3/5/2012 16: 13 12/9/2011 16: 47 30962 2/24/2012 12: 17 29737 11/30/2011 16: 12 9349 2/29/12 PM best baseline test of 2/29. Recovered quickly Pt concussed 2/22. post bout memory loss Vomited 4 -5 that nite sx score on 2/23 11/26: bare ly passed after Injury test 30528 Pt definitely concussed on 3/3. After injury test abnormal compared to Pt fought 2/22: After Injury test 2/24 no symptoms till 48 hrs post fight Symptoms started with illness and taking cough med sx score on 2/28 13/56 29956 2/29/2012 23: 42 3/4/2012 2/12/2012 0: 00 2/23/2012 0: 00 12/1/2011 10: 00 2/24/2012 9: 21: 35 AM
2013 Concussed individuals baselin e Prelim Quarter Semis Finals 8 counts CHRT SRT OCL One Back Post concussion results 37 28 2 2. 66 2. 51 2. 89 2. 80 37 29 0 0. 04 0. 05 0. 02 0. 04 38 37 39 2 40 35 33 1 2013 baseline 32 32 32 2 2. 66 2. 5 2. 91 2. 79 37 33 31 2 0. 05 0. 06 0. 2 38 34 33 34 1
Axons and KDs of KD KD Eight KD qtrs. RSC base prelim semis Finals Counts 43 40 34 30 1 1 30 27 1 1 37 28 2 1 45 32 32 42 29 30 0 0 2 1 1 1 39 26 3 1 25 37 29 0 1 40 43 36 40 2 2 1 1 32 27 3 1 32 38 37 43 38 32 40 27 33 31 32 37 38 29 33 36 3 1 2 3 2 2 1 3 0 1 2 2 1 1 1 1 1 0 1 1 37 32 35 25 41 39 31 33 31 32 32 33 34 28 32 31 33 34 Hi risk boxers Other multiple head shots knockdown headshots wobbly, multiple headshots, no problem next day knockout (brief LOC) RSC due to failure to stop bloody nose (RSC) CHRT DETV 2. 65 0. 05 2. 49 0. 06 knockdown hit head on the mat (RSC) OCL 2 ONEB 2. 91 0. 06 2. 78 0. 08 serious headshots positive HA post match stopped 1 st rd unable to protect self fight stopped first rd bloody nose stopped first round dazed post bout emotional concussed multiple head blows knocked out nose plugs Mild Headache p bout knockdown felt fuzzy 30 minutes p fight concussed KO 2. 66 2. 51 (Concussed) 2. 89 2. 80
What about individual change scores? 1. 3 Difference from Baselines by Win and Lose The plots below show the differences from baseline for fighters broken down by Winners and Losers in each round of the tournament. For example, the difference from baseline for the preliminary round is defined as (baseline score minus score after preliminary bout). Thus, a negative change score indicates they scored higher than baseline postbout, while a positive change score indicates a post-bout score that is lower than baseline. The dashed lines have the same interpretation as above.
KD- Change from baseline (winners vs losers)
Axon CCAT-simple reaction time
SCAT 2 - Change from baseline RSC) (winners vs
KD- Change from Baseline (winners vs RSC)
Axon CCAT- change from baseline-RSC
Vertical Leap • Performed at Baseline and after each bout • Based on Height, weight and jump height Baseline Prelim Quarter Semi Finals Power Index (Watts) 131. 24 132. 85 135. 20 135. 25 132. 48 SD 19. 93 15. 77 24. 69 24. 24 23. 80
Vertical leap by number of bouts fought Task #Bouts n 1 bout 45 2 bouts 27 3 bouts 16 4 bouts 6 Vert. Leap Baseline Test 1 Test 2 Test 3 Test 4
Video analysis: 2012 average cumulative punches for number of bouts fought One bout Two bouts Three bouts Four bouts Number of boxers 64 38 25 6 average cumulative total punches received per boxer 69 119 173 290 Range 25 -426* * Range signifies least and most amount of punches received by any one boxer
Punch Count by Bouts Average per boxer Range Concussed average per boxer Range Prelims Quarters Semis Finals 52. 2 (n=69) 66. 8 (n=38) 65. 4 (n=25) 97. 3 (n=6) 14 -158 32 -119 9 -136 80 -216 92. 6 (n=5) 79. 5 (n=2) 92. 5(n=3) 71 -112 48 -111 76 -109
X 2 Impact data • Headbands and mouth guards used • Uses accelerometer and gyroscopic instrumentation to record linear and rotational acceleration and force • Limited number of boxers studied Total Hits Mean PLA (G): Median PLA (G): Max PLA (G): Mean PRA (deg/s^2): Median PRA (deg/s^2): Max PRA (deg/s^2):
Combined Quarterfinals Video and X 2 (headbands only) Mean PLA Total Hits (G): 68. 79 35. 47 Median PLA (G): Max PLA (G): 30. 44 101. 97 Mean PRA (deg/s^2) Median PRA (deg/s^2) Max PRA (deg/s^2) 233, 133. 89 197, 028. 05 724, 324. 19
Headbands Name: Event Count: Mean PLA (G): Median PLA (G): Max PLA (G): 26. 70010741 25. 01499499 65. 37084573 151870. 1791 145205. 7456 331119. 1469 2/28/2012 Decker Joe 43 Mean PRA (deg/s^2): Median PRA (deg/s^2): Max PRA (deg/s^2): Date Seim Neils 15 24. 1092551 20. 02007196 50. 31109036 170649. 7255 134237. 7862 422223. 8587 2/28/2012 Rowek Nick 50 27. 74637891 22. 4767116 95. 41865006 158008. 8593 134376. 4505 457842. 8841 2/28/2012 Garvin Jackie 54 39. 09771261 31. 14273783 120. 0620806 249541. 0234 189812. 8867 895521. 7051 2/28/2012 Peterson Will 15 30. 49930587 31. 2519058 53. 05576282 155231. 5836 167118. 0449 222700. 2147 2/28/2012 Hlavaty Joel 42 27. 15913915 23. 35955938 74. 80561984 182624. 0701 145018. 1009 568740. 3482 2/28/2012 Kim Joey 25 33. 33591516 32. 55065705 55. 36452709 181321. 4322 176431. 4619 331015. 0472 2/29/2012 Power Ryan 109 39. 81344291 32. 73993095 128. 3661377 316741. 5157 248726. 6975 1410061. 258 2/29/2012 Ortenzio Kevin 38 32. 33897833 26. 17857563 170. 2409177 253234. 1825 180571. 2372 1247300. 38 2/29/2012 Oloriz Alex 43 23. 67638615 22. 06734827 62. 93015458 162511. 9363 149636. 9477 395736. 7994 2/29/2012 Bunsa Dallas 43 21. 50695683 20. 13754831 68. 63808586 168755. 5126 152159. 6361 710489. 199 2/29/2012 Ulrich Jeff 62 22. 48843275 20. 80010971 97. 00438155 139730. 46 120235. 3883 588099. 9925 2/29/2012 Joe Jake 37 20. 46357076 18. 49666552 47. 10686256 169782. 9987 154957. 1804 410085. 9529 2/29/2012 Grasberger Nick 43 32. 42951194 25. 5522802 81. 73383572 217044. 8964 166159. 0286 612365. 4306 2/29/2012 Paape Reid 69 28. 95686754 25. 83147008 92. 48753327 177916. 4036 137568. 8438 726097. 4641 2/29/2012 Sarkis Chris 69 33. 02296041 25. 61462058 97. 39387604 202132. 6191 160582. 8871 503996. 2415 2/29/2012 Salat Brian 46 41. 86896048 31. 24355576 130. 791737 273507. 3467 212281. 7739 746194. 3765 2/29/2012 Yi Dan 58 39219. 75827 21. 29460465 90. 64605176 182240. 8876 139540. 3349 612636. 3946 2/29/2012 Semifinals data Mouthguard Name: Event Count: Mean PLA (G): Median PLA (G): Max PLA (G): Mean PRA (deg/s^2): Median PRA (deg/s^2): Max PRA (deg/s^2): 70. 80772853 119571. 2706 88952. 20332 308401. 7656 Alberdi Ryan 19 26. 92064034 22. 97703951 Cunningham Gregory 39 20. 04935753 20. 17052349 38. 871157 109940. 4596 90833. 36575 325837. 4076 Salat Brian 29 24. 56827464 22. 08636071 71. 25089358 160478. 3134 105443. 9357 740752. 0769 Sarkis Chris 41 25. 30602238 23. 39753323 66. 11476015 180656. 759 137561. 2106 771029. 2352 Seim Niels 7 20. 39149476 22. 98146367 26. 12110451 111175. 9326 98093. 34513 278370. 5415 Yi Daniel 38 28. 5286212 21. 75604628 95. 03300801 174919. 6133 117880. 1026 744297. 1764
Combined average of 23 mouth guard bouts Event Count: Mean PLA (G): Median PLA (G): Max PLA (G): Mean PRA Median PRA (deg/s^2): Max PRA (deg/s^2): Average (n=23) 32 23 21 53 125, 311 101, 190 394, 893 Range (7 -70) (18 -29) (16 -27) (26 -95) (82, 500191, 780) (74, 763176, 614) (127, 771771, 029)
Data from 2 boxers diagnosed with concussion Boxer 1 (mouth guard) Boxer 2 (Headband) Event Count: 38 78 Mean PLA (G): 25 51 Median PLA (G): 22 42 Max PLA (G): 77 139 Mean PRA (deg/s^2): 113, 843 385, 649 Median PRA (deg/s^2): 85, 042 319, 774 Max PRA (deg/s^2): 394, 113 1, 262, 298 Event Count: Mean PLA (G): Median PLA (G): Max PLA (G): Mean PRA Median PRA (deg/s^2): Max PRA (deg/s^2): Average (n=23) 32 23 21 53 125, 311 101, 190 394, 893 Range (7 -70) (18 -29) (16 -27) (26 -95) (82, 500191, 780) (74, 763176, 614) (127, 771771, 029)
No correlation with number of hits, PLA, PRA and performance on Axon testing Measure CHRT DETV OCL 2 ONEB Prelims (N=23) 0. 09 0. 32 0. 35 0. 12 0. 29 0. 31 -0. 05 -0. 13 -0. 04 0. 14 0. 00 0. 08 Quarters (N=23) 0. 25 0. 23 0. 29 0. 28 0. 07 0. 03 0. 16 0. 15 0. 29 0. 33 0. 21 0. 35 Semis (N=13) -0. 09 -0. 37 -0. 10 0. 06 -0. 42 -0. 22 0. 08 -0. 43 0. 03 -0. 22 0. 10 Finals (N=5) 0. 56 0. 33 0. 72 0. 57 0. 01 0. 37 -0. 30 0. 03 0. 51 -0. 01 -0. 22 0. 38 Correlations between Axon measures CHRT, DETV, OCL 2, and ONEB and Total Weighted hits sustained (top number in each cell), Max PLA (middle number in each cell), and Max PRA (bottom number in each cell. (Max PLA and PRA are for headband measurements only) All p-values were nonsignificant.
Correlations between Balance Score, Symptom Severity Score, and SCAT 2 Total and Total Weighted hits sustained 1. top number in each cell) Max PLA 2. middle number in each cell), and Max PRA 3. bottom number in each cell. (Max PLA and PRA are for headband measurements only). Measure Prelims (N=22) Quarters (N=27) Semis (N=15) Finals (N=7) Balance -0. 48 (p-val=. 022) 0. 02 0. 00 -0. 03 0. 11 0. 06 -0. 36 -0. 52 (p-val=. 049) -0. 56 (p-val=. 031) 0. 21 -0. 60 -0. 44 Symptom 0. 048 -0. 16 -0. 13 0. 28 0. 09 0. 10 0. 67 (p-val=. 006) 0. 38 0. 72 (p-val=. 003) 0. 39 0. 17 -0. 28 SCAT 2 Total -0. 37 0. 19 -0. 21 0. 08 0. 04 -0. 66 (p-val=. 008) -0. 50 -0. 78 (p-val=0. 001 ) 0. 27 -0. 24 0. 25 Table 2: Correlations for SCAT 2 data In Table 2, p-values accompany the correlations that were statistically significant (i. e. , p-value<0. 05). However, to guard against Type I error, i. e. control the false discovery rate, a multiple comparisons procedure must be applied. A simple method is the Bonferroni correction. Since there are 36 correlations reported in Table 2, under this method each p-value is multiplied by 36. The only correlation with a statistically significant corrected correlation is -0. 78, highlighted in boldface .
Conclusions › Physical Exam remains the most reliable indicator of concussion › SCAT-2 testing is not a reliable diagnostic tool for the diagnosis of concussion › Computerized Neuropsychological testing is not a reliable diagnostic tool for concussion (note that two boxers with obvious concussion post bout were not tested in the 24 hr window) › King-Devick testing is not a reliable diagnostic tool for concussion
Conclusions › SCAT 2, CCAT, and KD testing were highly reliable and reflected best effort as demonstrated by close scoring numbers in the winners and losers breakouts › Boxers with concussions demonstrated higher punch counts on average than non-concussed boxers › There was no demonstrable worsening in CCAT, SCAT 2 , and KD scores as boxers progressed in the tournament › Total punch count was not associated with worsening test scores › There was no appreciable muscle fatigue 1 rep max