
Do capacity support schemes work An empirical assessment
- Slides: 24
Do capacity support schemes work? An empirical assessment across OECD countries Simona Benedettini*, Giuseppe Buglione , Guido Cervigni* * IEFE Center – Bocconi University KPMG, London IEFE Seminar – November 23, 2012
Outline Economics of capacity mechanisms Motivations for the research Empirical strategy Results Conclusions
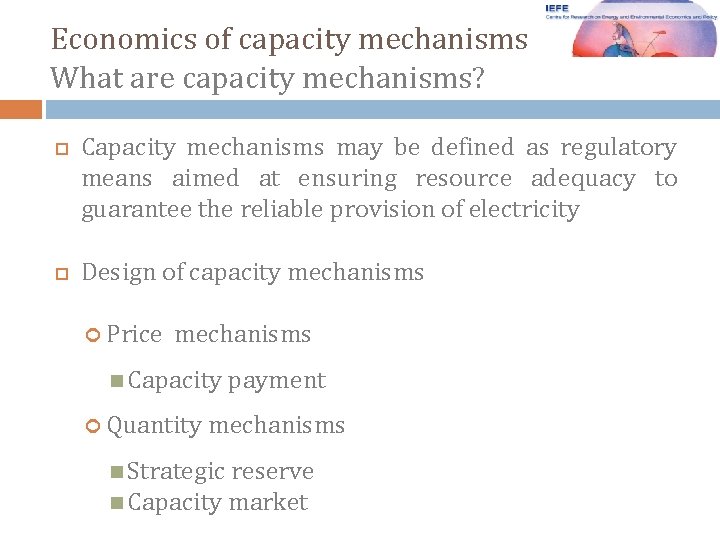
Economics of capacity mechanisms What are capacity mechanisms? Capacity mechanisms may be defined as regulatory means aimed at ensuring resource adequacy to guarantee the reliable provision of electricity Design of capacity mechanisms Price mechanisms Capacity payment Quantity mechanisms Strategic reserve Capacity market
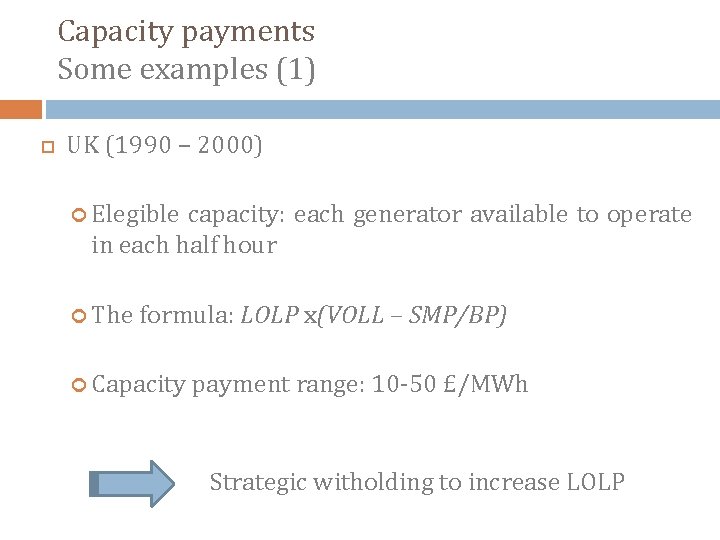
Capacity payments Some examples (1) UK (1990 – 2000) Elegible capacity: each generator available to operate in each half hour The formula: LOLP x(VOLL – SMP/BP) Capacity payment range: 10 -50 £/MWh Strategic witholding to increase LOLP
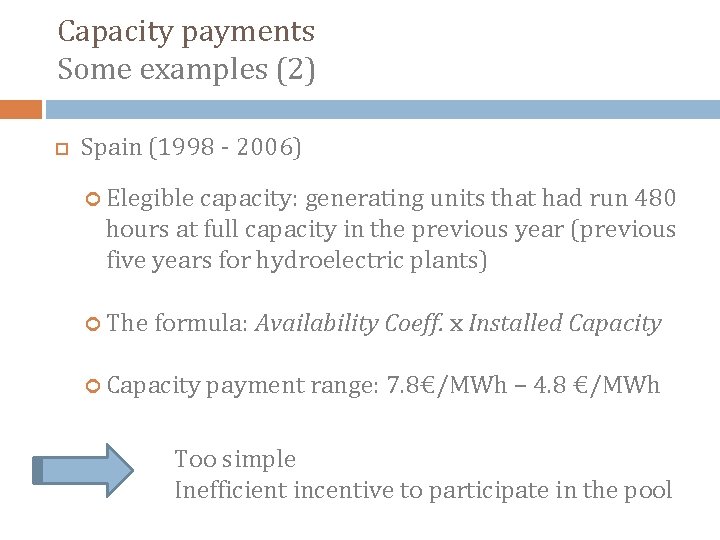
Capacity payments Some examples (2) Spain (1998 - 2006) Elegible capacity: generating units that had run 480 hours at full capacity in the previous year (previous five years for hydroelectric plants) The formula: Availability Coeff. x Installed Capacity payment range: 7. 8€/MWh – 4. 8 €/MWh Too simple Inefficient incentive to participate in the pool
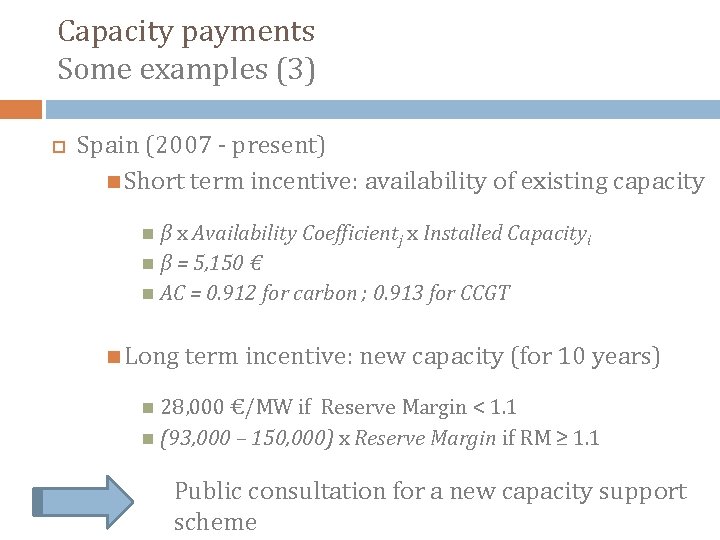
Capacity payments Some examples (3) Spain (2007 - present) Short term incentive: availability of existing capacity β x Availability Coefficientj x Installed Capacityi β = 5, 150 € AC = 0. 912 for carbon ; 0. 913 for CCGT Long term incentive: new capacity (for 10 years) 28, 000 €/MW if Reserve Margin < 1. 1 (93, 000 – 150, 000) x Reserve Margin if RM ≥ 1. 1 Public consultation for a new capacity support scheme
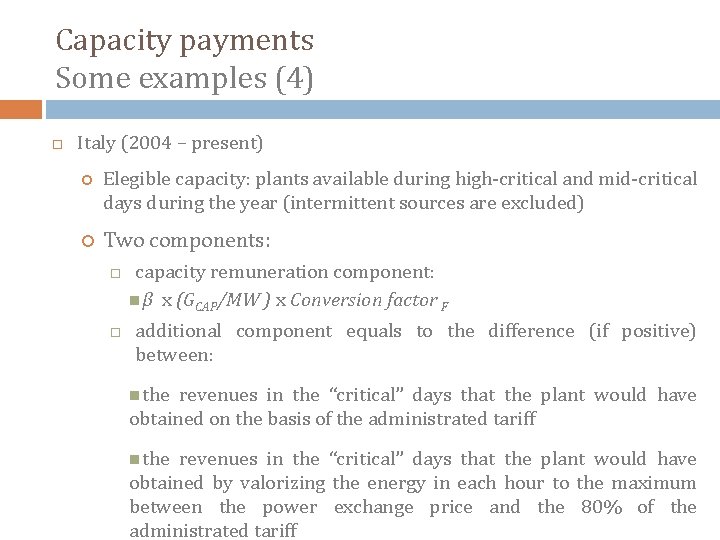
Capacity payments Some examples (4) Italy (2004 – present) Elegible capacity: plants available during high-critical and mid-critical days during the year (intermittent sources are excluded) Two components: capacity remuneration component: β x (GCAP/MW ) x Conversion factor F additional component equals to the difference (if positive) between: the revenues in the “critical” days that the plant would have obtained on the basis of the administrated tariff the revenues in the “critical” days that the plant would have obtained by valorizing the energy in each hour to the maximum between the power exchange price and the 80% of the administrated tariff
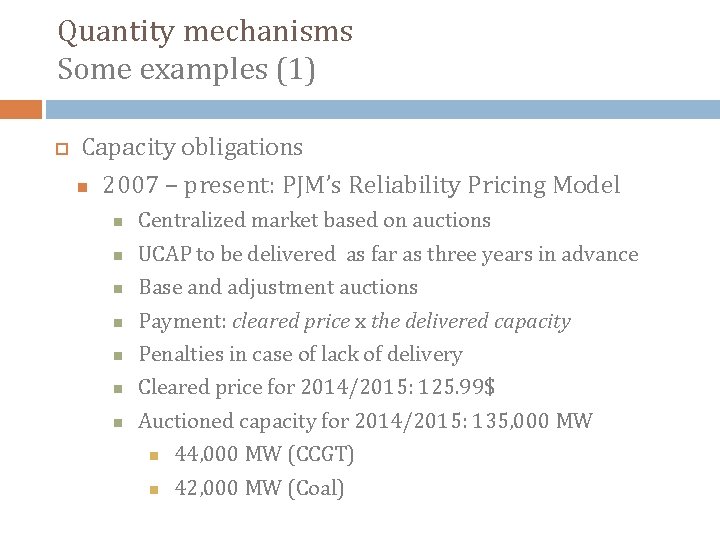
Quantity mechanisms Some examples (1) Capacity obligations 2007 – present: PJM’s Reliability Pricing Model Centralized market based on auctions UCAP to be delivered as far as three years in advance Base and adjustment auctions Payment: cleared price x the delivered capacity Penalties in case of lack of delivery Cleared price for 2014/2015: 125. 99$ Auctioned capacity for 2014/2015: 135, 000 MW 44, 000 MW (CCGT) 42, 000 MW (Coal)
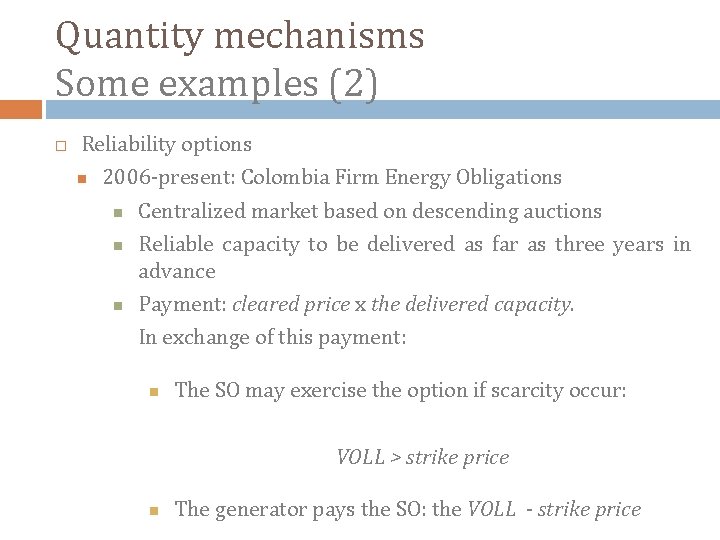
Quantity mechanisms Some examples (2) Reliability options 2006 -present: Colombia Firm Energy Obligations Centralized market based on descending auctions Reliable capacity to be delivered as far as three years in advance Payment: cleared price x the delivered capacity. In exchange of this payment: The SO may exercise the option if scarcity occur: VOLL > strike price The generator pays the SO: the VOLL - strike price
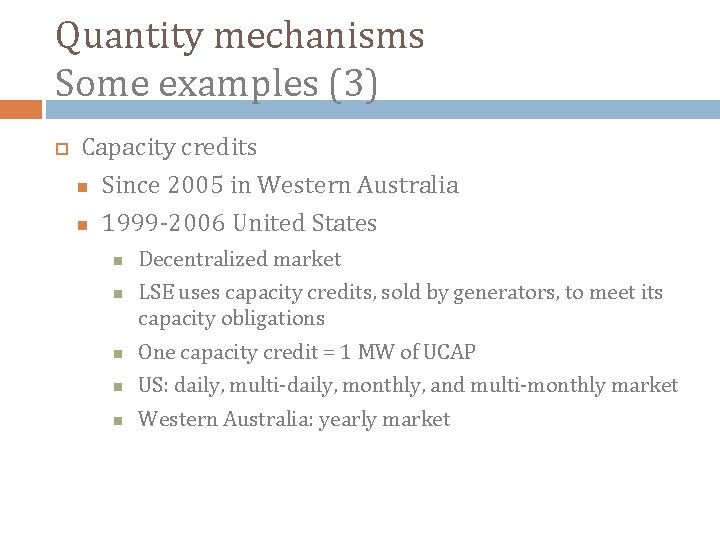
Quantity mechanisms Some examples (3) Capacity credits Since 2005 in Western Australia 1999 -2006 United States Decentralized market LSE uses capacity credits, sold by generators, to meet its capacity obligations One capacity credit = 1 MW of UCAP US: daily, multi-daily, monthly, and multi-monthly market Western Australia: yearly market
Quantity mechanisms Some examples (4) Strategic reserve Finland (2006), Norway (2000), Sweden (2003) Generating units called upon to supply energy when a scarcity scenario appears The SO defines the rules for offering the electricity of these reserves on the market Risk of distortion of price signals
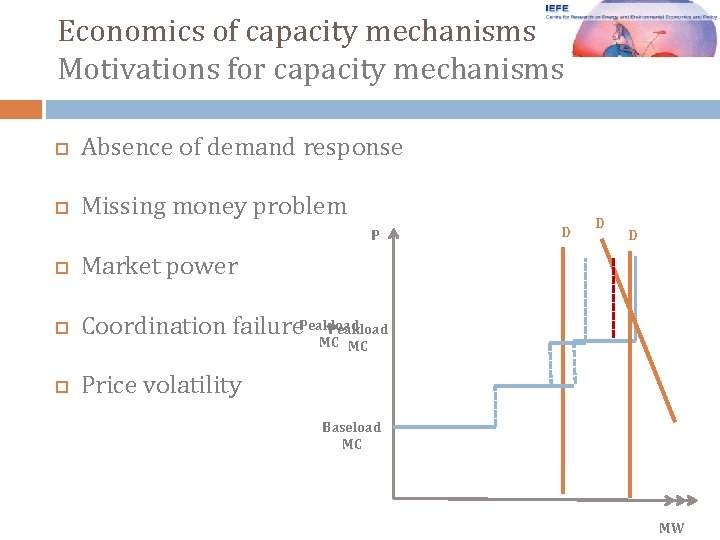
Economics of capacity mechanisms Motivations for capacity mechanisms Absence of demand response Missing money problem P Market power Coordination failure. Peakload MC D D D MC Price volatility Baseload MC MW
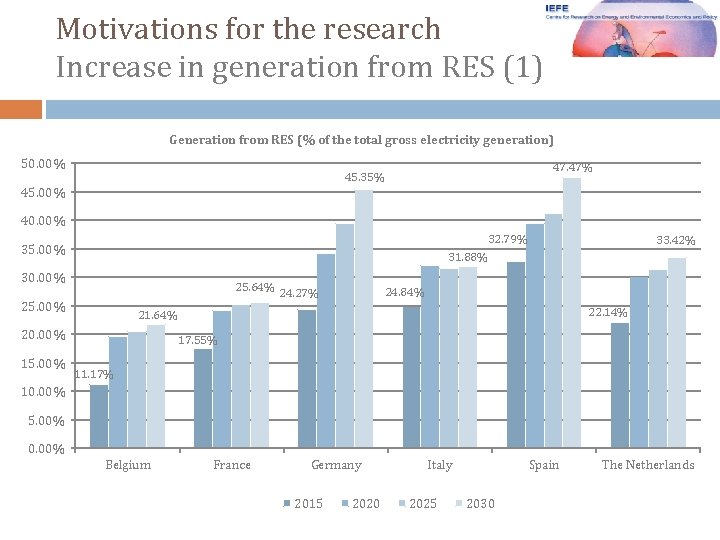
Motivations for the research Increase in generation from RES (1) Generation from RES (% of the total gross electricity generation) 50. 00% 47. 47% 45. 35% 45. 00% 40. 00% 32. 79% 31. 88% 35. 00% 30. 00% 25. 64% 25. 00% 24. 84% 24. 27% 22. 14% 21. 64% 20. 00% 15. 00% 33. 42% 17. 55% 11. 17% 10. 00% 5. 00% 0. 00% Belgium France Germany 2015 2020 Italy 2025 Spain 2030 The Netherlands
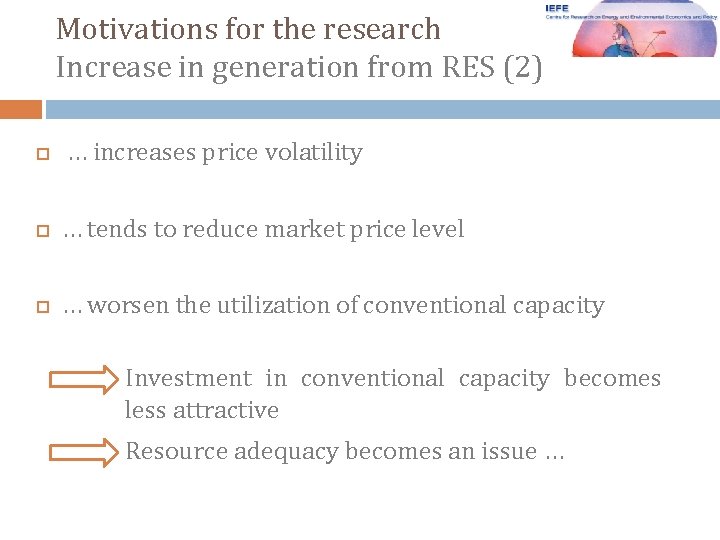
Motivations for the research Increase in generation from RES (2) … increases price volatility … tends to reduce market price level … worsen the utilization of conventional capacity Investment in conventional capacity becomes less attractive Resource adequacy becomes an issue …
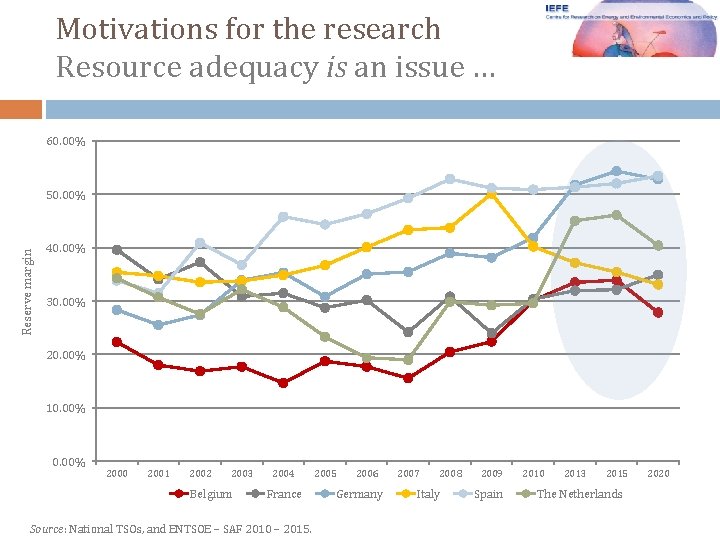
Motivations for the research Resource adequacy is an issue … 60. 00% Reserve margin 50. 00% 40. 00% 30. 00% 20. 00% 10. 00% 2000 2001 2002 2003 Belgium 2004 France Source: National TSOs, and ENTSOE – SAF 2010 – 2015. 2005 2006 Germany 2007 2008 Italy 2009 Spain 2010 2013 2015 The Netherlands 2020
Motivations for the research Revived interest in Europe France: capacity obligations by 2015 -2016 Germany: under discussion the adoption of a capacity support scheme UK: DECC Consultation on Possible Models for a Capacity Mechanisms concluded with the adoption by 2015 of a capacity mechanism based on capacity obligations Italy: first auctions of the new capacity mechanism based on reliability options will be held in 2013
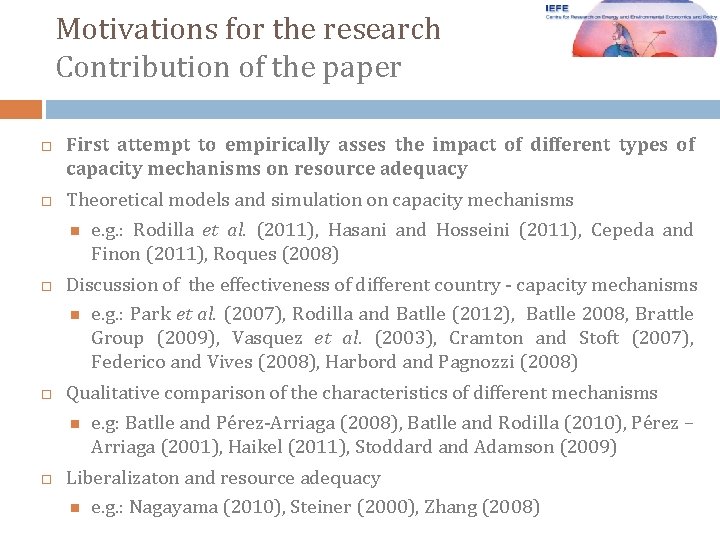
Motivations for the research Contribution of the paper First attempt to empirically asses the impact of different types of capacity mechanisms on resource adequacy Theoretical models and simulation on capacity mechanisms e. g. : Rodilla et al. (2011), Hasani and Hosseini (2011), Cepeda and Finon (2011), Roques (2008) Discussion of the effectiveness of different country - capacity mechanisms e. g. : Park et al. (2007), Rodilla and Batlle (2012), Batlle 2008, Brattle Group (2009), Vasquez et al. (2003), Cramton and Stoft (2007), Federico and Vives (2008), Harbord and Pagnozzi (2008) Qualitative comparison of the characteristics of different mechanisms e. g: Batlle and Pérez-Arriaga (2008), Batlle and Rodilla (2010), Pérez – Arriaga (2001), Haikel (2011), Stoddard and Adamson (2009) Liberalizaton and resource adequacy e. g. : Nagayama (2010), Steiner (2000), Zhang (2008)
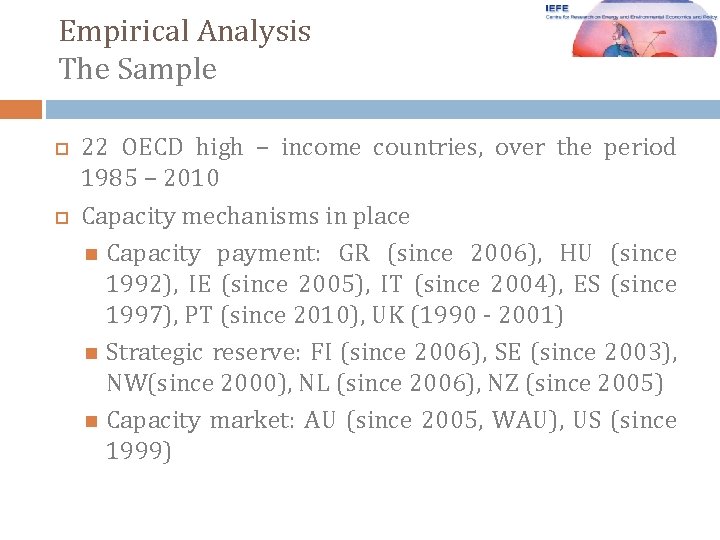
Empirical Analysis The Sample 22 OECD high – income countries, over the period 1985 – 2010 Capacity mechanisms in place Capacity payment: GR (since 2006), HU (since 1992), IE (since 2005), IT (since 2004), ES (since 1997), PT (since 2010), UK (1990 - 2001) Strategic reserve: FI (since 2006), SE (since 2003), NW(since 2000), NL (since 2006), NZ (since 2005) Capacity market: AU (since 2005, WAU), US (since 1999)
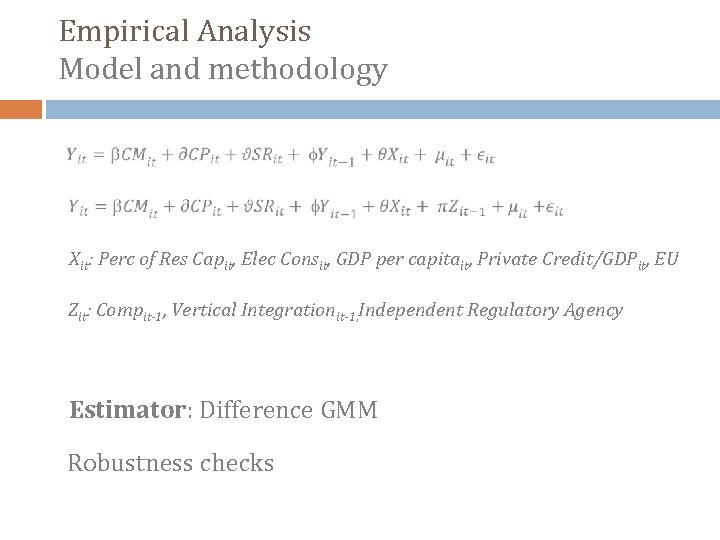
Empirical Analysis Model and methodology Xit: Perc of Res Capit, Elec Consit, GDP per capitait, Private Credit/GDPit, EU Zit: Compit-1, Vertical Integrationit-1, Independent Regulatory Agency Estimator: Difference GMM Robustness checks
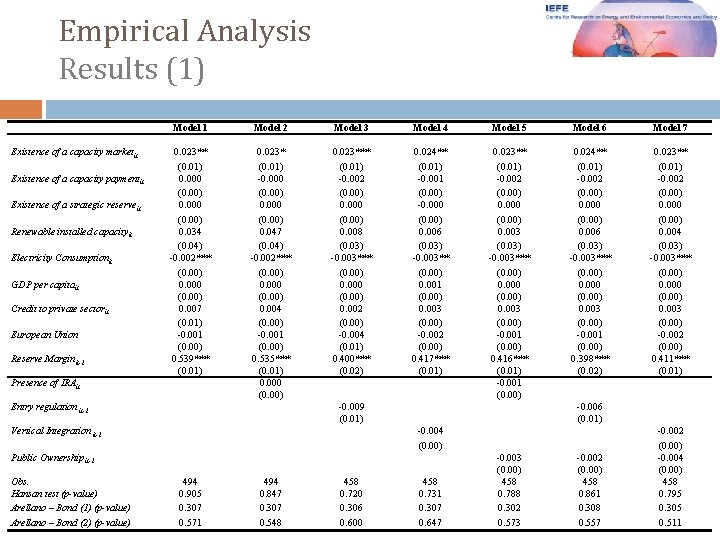
Empirical Analysis Results (1) Existence of a capacity market it Existence of a capacity payment it Existence of a strategic reserve it Renewable installed capacity it Electricity Consumptionit GDP per capitait Credit to private sectorit European Union Reserve Marginit-1 Model 2 Model 3 Model 4 Model 5 Model 6 Model 7 0. 023** (0. 01) 0. 000 (0. 00) 0. 034 (0. 04) -0. 002*** (0. 00) 0. 000 (0. 00) 0. 007 (0. 01) -0. 001 (0. 00) 0. 539*** (0. 01) 0. 023* (0. 01) -0. 000 (0. 00) 0. 047 (0. 04) -0. 002*** (0. 00) 0. 000 (0. 00) 0. 004 (0. 00) -0. 001 (0. 00) 0. 535*** (0. 01) 0. 000 (0. 00) 0. 023*** (0. 01) -0. 002 (0. 00) 0. 000 (0. 00) 0. 008 (0. 03) -0. 003*** (0. 00) 0. 000 (0. 00) 0. 002 (0. 00) -0. 004 (0. 01) 0. 400*** (0. 02) 0. 024** (0. 01) -0. 001 (0. 00) -0. 000 (0. 00) 0. 006 (0. 03) -0. 003** (0. 00) 0. 001 (0. 00) 0. 003 (0. 00) -0. 002 (0. 00) 0. 417*** (0. 01) 0. 023** (0. 01) -0. 002 (0. 00) 0. 000 (0. 00) 0. 003 (0. 03) -0. 003*** (0. 00) 0. 000 (0. 00) 0. 003 (0. 00) -0. 001 (0. 00) 0. 416*** (0. 01) -0. 001 (0. 00) 0. 024** (0. 01) -0. 002 (0. 00) 0. 000 (0. 00) 0. 006 (0. 03) -0. 003*** (0. 00) 0. 000 (0. 00) 0. 003 (0. 00) -0. 001 (0. 00) 0. 398*** (0. 02) 0. 023** (0. 01) -0. 002 (0. 00) 0. 000 (0. 00) 0. 004 (0. 03) -0. 003*** (0. 00) 0. 000 (0. 00) 0. 003 (0. 00) -0. 002 (0. 00) 0. 411*** (0. 01) Presence of IRA it Entry regulation it-1 -0. 009 (0. 01) Vertical Integration it-1 -0. 006 (0. 01) -0. 004 (0. 00) Public Ownership it-1 Obs. Hansan test (p-value) Arellano – Bond (1) (p-value) Arellano – Bond (2) (p-value) 494 0. 905 0. 307 0. 571 494 0. 847 0. 307 0. 548 458 0. 720 0. 306 0. 600 458 0. 731 0. 307 0. 647 -0. 003 (0. 00) 458 0. 788 0. 302 0. 573 -0. 002 (0. 00) 458 0. 861 0. 308 0. 557 -0. 002 (0. 00) -0. 004 (0. 00) 458 0. 795 0. 305 0. 511
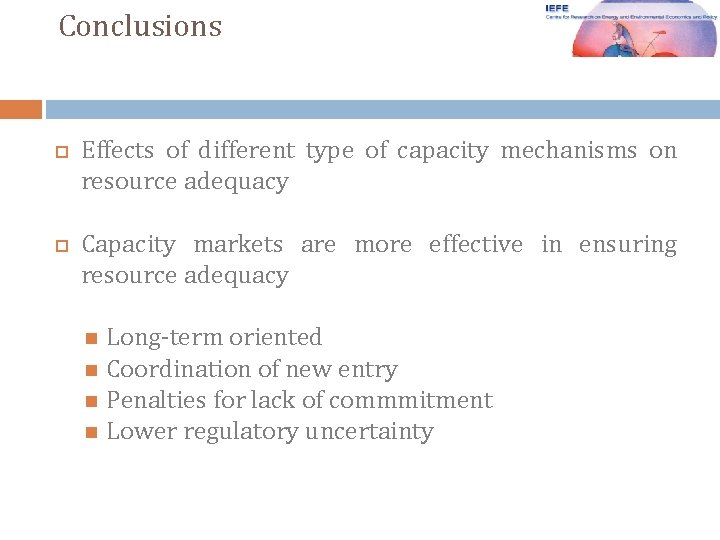
Conclusions Effects of different type of capacity mechanisms on resource adequacy Capacity markets are more effective in ensuring resource adequacy Long-term oriented Coordination of new entry Penalties for lack of commmitment Lower regulatory uncertainty
Back-up slides
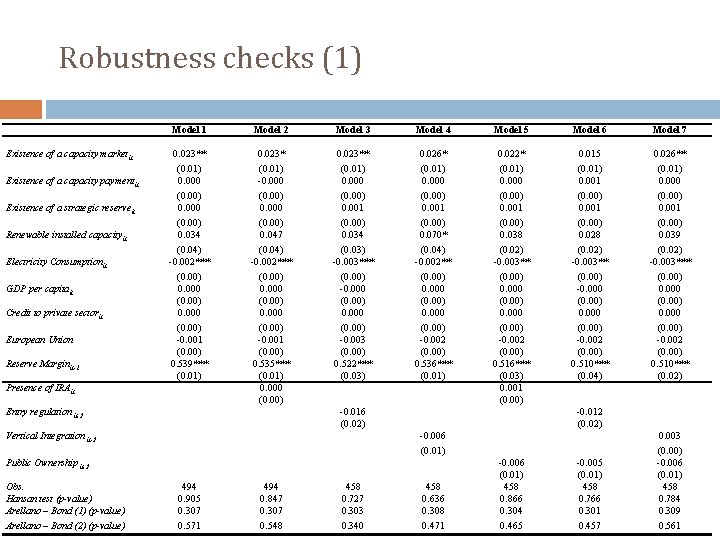
Robustness checks (1) Existence of a capacity market it Existence of a capacity payment it Existence of a strategic reserve it Renewable installed capacity it Electricity Consumptionit GDP per capitait Credit to private sectorit European Union Reserve Marginit-1 Model 2 Model 3 Model 4 Model 5 Model 6 Model 7 0. 023** (0. 01) 0. 000 (0. 00) 0. 034 (0. 04) -0. 002*** (0. 00) 0. 000 (0. 00) -0. 001 (0. 00) 0. 539*** (0. 01) 0. 023* (0. 01) -0. 000 (0. 00) 0. 047 (0. 04) -0. 002*** (0. 00) 0. 000 (0. 00) -0. 001 (0. 00) 0. 535*** (0. 01) 0. 000 (0. 00) 0. 023** (0. 01) 0. 000 (0. 00) 0. 001 (0. 00) 0. 034 (0. 03) -0. 003*** (0. 00) -0. 000 (0. 00) -0. 003 (0. 00) 0. 522*** (0. 03) 0. 026* (0. 01) 0. 000 (0. 00) 0. 001 (0. 00) 0. 070* (0. 04) -0. 002** (0. 00) 0. 000 (0. 00) -0. 002 (0. 00) 0. 536*** (0. 01) 0. 022* (0. 01) 0. 000 (0. 00) 0. 001 (0. 00) 0. 038 (0. 02) -0. 003** (0. 00) 0. 000 (0. 00) -0. 002 (0. 00) 0. 516*** (0. 03) 0. 001 (0. 00) 0. 015 (0. 01) 0. 001 (0. 00) 0. 028 (0. 02) -0. 003** (0. 00) -0. 000 (0. 00) -0. 002 (0. 00) 0. 510*** (0. 04) 0. 026** (0. 01) 0. 000 (0. 00) 0. 001 (0. 00) 0. 039 (0. 02) -0. 003*** (0. 00) 0. 000 (0. 00) -0. 002 (0. 00) 0. 510*** (0. 02) Presence of IRA it Entry regulation it-2 -0. 016 (0. 02) Vertical Integration it-2 -0. 012 (0. 02) -0. 006 (0. 01) Public Ownership it-2 Obs. Hansan test (p-value) Arellano – Bond (1) (p-value) Arellano – Bond (2) (p-value) 494 0. 905 0. 307 0. 571 494 0. 847 0. 307 0. 548 458 0. 727 0. 303 0. 340 458 0. 636 0. 308 0. 471 -0. 006 (0. 01) 458 0. 866 0. 304 0. 465 -0. 005 (0. 01) 458 0. 766 0. 301 0. 457 0. 003 (0. 00) -0. 006 (0. 01) 458 0. 784 0. 309 0. 561
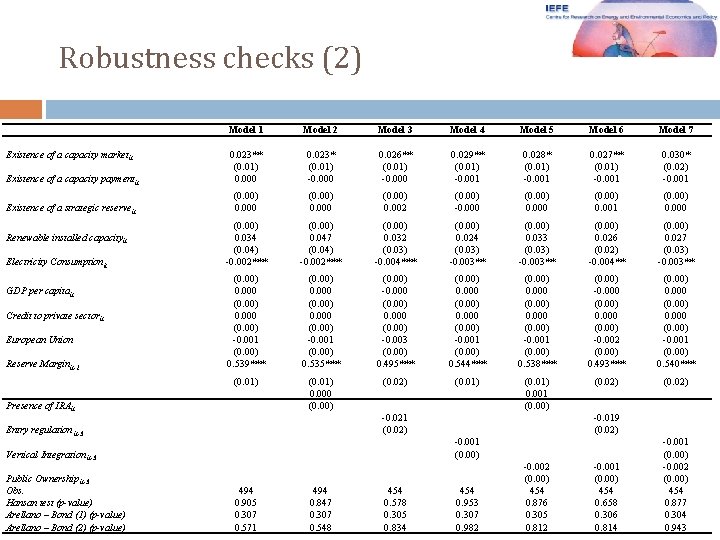
Robustness checks (2) Model 1 Model 2 Model 3 Model 4 Model 5 Model 6 Model 7 Existence of a capacity payment it 0. 023** (0. 01) 0. 000 0. 023* (0. 01) -0. 000 0. 026** (0. 01) -0. 000 0. 029** (0. 01) -0. 001 0. 028* (0. 01) -0. 001 0. 027** (0. 01) -0. 001 0. 030* (0. 02) -0. 001 Existence of a strategic reserve it (0. 00) 0. 000 (0. 00) 0. 002 (0. 00) -0. 000 (0. 00) 0. 001 (0. 00) 0. 000 (0. 00) 0. 034 (0. 04) -0. 002*** (0. 00) 0. 047 (0. 04) -0. 002*** (0. 00) 0. 032 (0. 03) -0. 004*** (0. 00) 0. 024 (0. 03) -0. 003** (0. 00) 0. 033 (0. 03) -0. 003** (0. 00) 0. 026 (0. 02) -0. 004** (0. 00) 0. 027 (0. 03) -0. 003** (0. 00) 0. 000 (0. 00) -0. 001 (0. 00) 0. 539*** (0. 00) 0. 000 (0. 00) -0. 001 (0. 00) 0. 535*** (0. 00) -0. 000 (0. 00) -0. 003 (0. 00) 0. 495*** (0. 00) 0. 000 (0. 00) -0. 001 (0. 00) 0. 544*** (0. 00) 0. 000 (0. 00) -0. 001 (0. 00) 0. 538*** (0. 00) -0. 000 (0. 00) -0. 002 (0. 00) 0. 493*** (0. 00) 0. 000 (0. 00) -0. 001 (0. 00) 0. 540*** (0. 01) 0. 000 (0. 00) (0. 02) (0. 01) 0. 001 (0. 00) (0. 02) Existence of a capacity market it Renewable installed capacity it Electricity Consumptionit GDP per capitait Credit to private sectorit European Union Reserve Marginit-1 Presence of IRA it -0. 021 (0. 02) Entry regulation it-3 -0. 001 (0. 00) Vertical Integration it-3 Public Ownership it-3 Obs. Hansan test (p-value) Arellano – Bond (1) (p-value) Arellano – Bond (2) (p-value) -0. 019 (0. 02) 494 0. 905 0. 307 0. 571 494 0. 847 0. 307 0. 548 454 0. 578 0. 305 0. 834 454 0. 953 0. 307 0. 982 -0. 002 (0. 00) 454 0. 876 0. 305 0. 812 -0. 001 (0. 00) 454 0. 658 0. 306 0. 814 -0. 001 (0. 00) -0. 002 (0. 00) 454 0. 877 0. 304 0. 943