DNA vs Human Language What is common between

DNA vs Human Language What is common between these two informational structures? Where are the differences? DNA 1 61 121 181 gaattcaaaa ggacggcatt aagattgttg aacaagtagt aagaca tgagaaaatc aaaaagcaga gcagtgtgcc atgacttgta aggacagtgg cacagcactg tgaacatagg gctgaagcta tgtacttatc agtagcagca atgggaaatt tgatcaggaa aaataagaag tggagcagaa aggaaagata aagatggggt atctgggcag aagcataagg aatggaggct ENGLISH The current genome sequence (Build 35) contains 2. 85 billion nucleotides interrupted by only 341 gaps. It covers ~99% of the euchromatic genome and is accurate to an error rate of ~1 event per 100, 000 bases. … Notably, the human genome seems to encode only 20, 00025, 000 protein-coding genes. ” Nature Oct 21, 2004, 431: 931 -945 EXPERIMENT ? ? ? ? ? ? ? ? ? ? ? ? ? ? ? ? ? ? ? ? ? ? ? ? ? ? ? ? ? ? ? ? ? ? ? ? ? ? ? ? ? ? ? ? ? ? ? ? ? ? ? ? ? ? ? ? ? ? ? ? ? ? ? ? ? ? ? ? ? ? ? ? ? ? ? ? ? ? ? ? ? ? ? ? ? ? ? ? ? ? ? ? ? ? ? ? ?

…? ? ? ? ? ? ? ? . . . ? ENGLISH LANGUAGE Frequent letters: E, A, T, S …etc Human DNA language Rare letters Q, X, J Frequent letters: A, T Rare letters G, C Our guess is ? = A

Short-range non-randomness Our guess was ? = A a? …? ? ? ? ? ? ? ? . . . What happens with your bet if I open to you neighboring letters? It should! Because “aa” is a very rear combination of characters in English. Actually many letters have preferences to be in combination with some other ones (“qu”, “th”, etc. ) and at the same time try to avoid to be together with other letters (“qa”, “ht”, etc. ) The same is true with DNA sequences. For instance, in humans rare dinucleotides are “cg” and “at” and abundant are “ag” and “ca”

? ? Mid-range non-randomness Our guess was ? = A q a …? ? ? ? ? ? ? ? . . . ? What happens with your bet if I open to you more distant letters? Not informative for English! The same is true with DNA sequences!

There are negative and positive correlations between neighboring letters both in English and DNA …XY… - strong correlation …X. Y… - weaker correlation …X. . Y… -very weak correlation …X…Y… - correlation is neglectful δ > 1 letter pair is overabundant δ < 1 letter pair is underabundant δ = 1 no preference

Combination of letters are limited! biology liobogy boilogy gioloby yioligb logbioy etc Words represent only a small fraction of all possible combinations of letters As we saw last week genomic DNA has favorable “words” – PYKNONS

Rigoutsos at al. 2006 Pyknons in the 3′ UTRs of the apoptosis inhibitor birc 4 (shown above the horizontal line) and nine other genes.

English has a larger scale of non-randomness – in the order of words He went home 1. 2. 3. 4. 5. Went he home Home went he He home went Home he went Went home he What combinations make sense?

Word. Seeker Our colleagues from Ohio University Lonnie Welsh and his team 2008 Interpretations?

Mid-range inhomogeneity in genomic DNA • 30 -10, 000 nucleotide range • Non-randomness in nucleotide composition within 50 nts, 200 nts, 1000 nts windows • Major topic for today

English Long-range inhomogeneity • Chapters in books – written by a boy and old man – Conversations vs descriptions – Covered different topics (War and Peace)

Genomic long-range inhomogeneity Also well recognized are long-range interdependencies in nucleotide frequencies on a scale of up to millions of bases, known as genomic isochores. It has been shown that isochores can be generally categorized according to their level of G+C content. Isochores defined by G+C content correspond to many other genomic phenomena.
 G+C percentage # genes")
HUMAN GENOME: GC-content green #Alu-repeats # transcripts (EST) G+C percentage # genes

What are isochores? DNA and gene distribution in the human isochore families Bernardi. The neoselectionist theory of genome evolution. PNAS. May, 2007. 104(20): 8385 -90.

Isochore origins • Plausible origins – Homeothermy – Advent of Cp. G methylation • • repair/replication machinery bias + microchromosomes – Invasion of very active mobile elements

Isochore evolution • Evolution – "Transitional mode" • • • Mutational bias hypothesis Selection hypothesis Biased Gene Conversion theory – G+C content in decline? • • "Regression mode" A new "conservation mode"
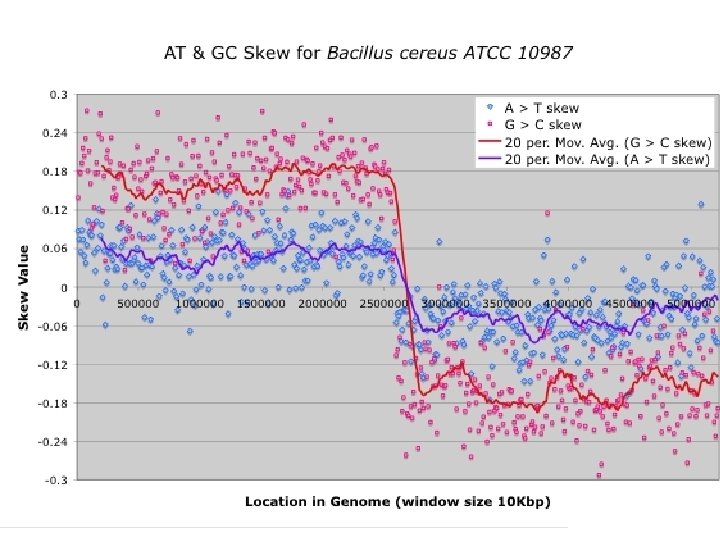
 = ( (A)- (T)) /(")
Difference in DNA chains in prokaryotes f f Skew(AT) = ( (A)- (T)) /( (A)+ (T)) Gen. Skew http: //genskew. csb. univie. ac. at/

Trifonov’s periodicities http: //research. haifa. ac. il/~genom/topics_pages/codes. html

Assignment #1 Http: //www. springerlink. com/content/g 74 u 87880 k 58 w 001/ From this website download PDF (140. 4 KB), on the left side in the middle of the webpage. Read this review and write about all genomic codes. Rank these codes according to their importance, starting from the most valuable one. Present this ranking table with your arguments.

Genomic mid-range inhomogeneity correlates with an abundance of RNA secondary structures Bechtel JM, Wittenschlaeger T, Dwyer T, Song J, Arunachalam S, Ramakrishnan SK, Shepard S, Fedorov A BMC Genomics 2008, 9: 284 Genomic MRI http: //bpg. utoledo. edu/gmri http: //mco 321125. meduohio. edu/~jbechtel/gmri/ Web resource for analysis of genomic sequences

Nucleotide Composition of intron 3 of Heparanase 2 A T C G rel. freq 0. 290 0. 336 0. 185 0. 189 AA AT AC AG TA TT TC TG CA CT CC CG GA GT GC GG 0. 0935 0. 0867 0. 0455 0. 0641 0. 0756 0. 1232 0. 0611 0. 0759 0. 0654 0. 0711 0. 0434 0. 0056 0. 0552 0. 0549 0. 0355 0. 0434 What is interesting in this Cp. G composition?

Under-representation of CG dinucleotides in the human genome due to methylation • Frequency of C • Frequency of G • Frequency of CG 0. 185 0. 189 0. 0056 (on average 5 -6 CG in 1000 nt sequence) Genomic signatures:

Why there is a shortage of CG dinucleotides in the human genome?

5`-Cp. G- 3` specific sites for methylation in humans 5 me 5`- AGTCGTTCAATCACGGGGATC-3` 3`- TCAGCAAGTTAGTGCCCCTAG-5` 5 me

5 me. C deamination -> T

Short-range inhomogeneity It is well established that the particular base (A, G, C, or T) that appears in a given position of a genomic sequence significantly depends upon the nearest bases surrounding its position. The highest interdependence of base frequencies is always observed for adjacent nucleotides. The interdependence of base frequencies sharply drops with increasing distance. When the distance between nucleotides X and Y is more than six bases apart, their occurrence interdependency becomes negligible.

There are hundreds of intercellular molecular processes that cause mutations or selection of mutations at specific sites Hot spots for mutations • DNA conformations (A-, B-, Z- forms) • Transcriptional activity (unwinding of DNA double strands) • Covering by chromosomal proteins Reasons for majority of mutational hot-spots are unknown

Table of genomic signatures in humans AA 1. 16 AC 0. 80 AG 1. 19 AT 0. 85 CA 1. 15 CC 1. 27 CG 0. 36 CT 1. 19 GA 0. 98 GC 0. 98 GG 1. 26 GT 0. 79 TA 0. 72 TC 0. 97 TG 1. 17 TT 1. 16

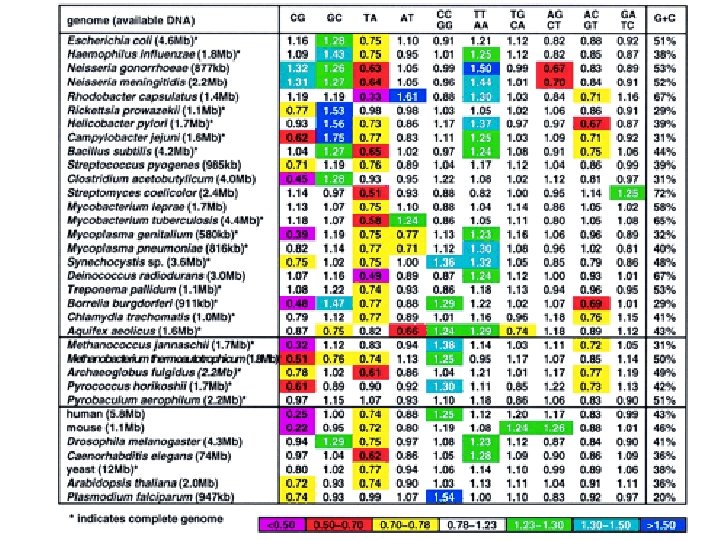
Genome signature comparisons among prokaryote, plasmid and mitochondrial DNA Campbell A. , Mrazek J. , Karlin S. PNAS 1999, 96: 9184 -9189 Our basic observation is that each genome has a characteristic "signature" defined as the ratios between the observed dinucleotide frequencies and the frequencies expected if neighbors were chosen at random (dinucleotide relative abundances). The remarkable fact is that the signature is relatively constant throughout the genome; i. e. , the patterns and levels of dinucleotide relative abundances of every 50 -kb segment of the genome are about the same. Comparison of the signatures of different genomes provides a measure of similarity which has the advantage that it looks at all the DNA of an organism and does not depend on the ability to align homologous sequences of specific genes. Table Genome signature (dinucleotide relative abundances) of complete genomes and large DNA sequence samples (>500 kb).

Generation of random sequence A T G C Let’s assume you have 40 A, 30 T, 15 G, 15 C

Two approaches for generating random sequence Every time you draw the ball from a random lottery machine you: 1) put it back into lottery machine 2) keep it with you QUIZ Let’s assume you have 40 A, 30 T, 15 G, 15 C and you should generate 100 nt-long sequence What is the most frequent random sequence output for case 1 and case 2?
; @n = ('A', 'T', 'C', 'G');")
Perl program to generate random sequence #!/usr/bin/perl @sum=(); @n = ('A', 'T', 'C', 'G'); $count = 0; $randseq=''; $A =231878; $T =268788; $C =148462; $G =151234; $sum[0]=$A; $sum[1]=$sum[0]+$T; $sum[2]=$sum[1]+$C; $sum[3]=$sum[2]+$G; print "Please enter the name of the output file n"; $output = <STDIN>; chomp ($output); for $w (0. . $sum[3]) { $r 2 =int(rand($sum[3]))+1; for $x (0. . 3) {if ($sum[$x] >= $r 2) {$new = $n[$x]; last; }} $randseq. =$new; } open (OUTPUT, ">$output") || die "Can't open $output : $!n"; print OUTPUT '> ', "random sequencen", $randseq , "n";

SRI generator Generation of random sequence with the real composition of N-mers (let’s say 4 -mers: ATTA, GCCT, GGGA, etc. Approach 1 Approach 2

Markov Models to generate random sequences with specific compositions CTGGACTGAAATCGA CA T ? 4 - mer TABLE CATA CATC CATG CATT 0. 004613 0. 003341 0. 004720 0. 006889 23. 6% 17. 1% 24. 1% 35. 2% A C G T

Mid-range inhomogeneity • The compositional non-randomness between the two extremes described above we call mid-range inhomogeneity or MRI has yet to be thoroughly investigated. The only well-known manifestation of mid-range inhomogeneity is Cp. G islands. • Here we demonstrate that MRI can be observed for regions from 30 -1000 bp and is significant not only for G+C content but for other nucleotide pairings (A+G and G+T) as well as for the individual bases.
 MRI-analyzer program scans input sequences with a mid-range window size (the")
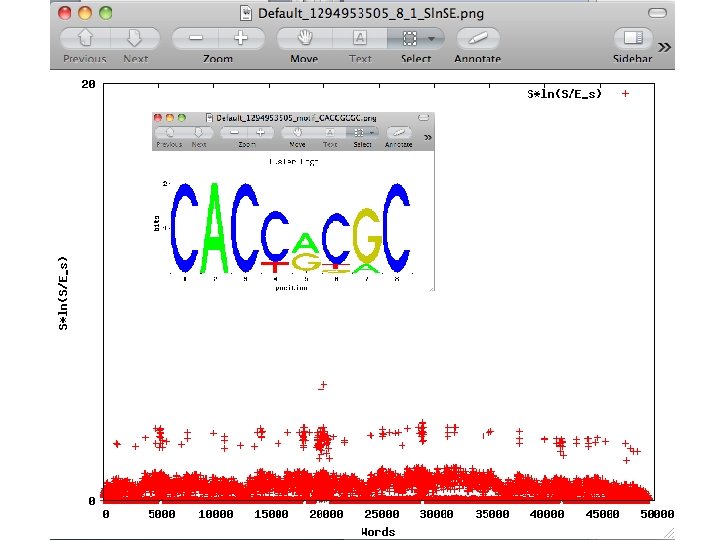
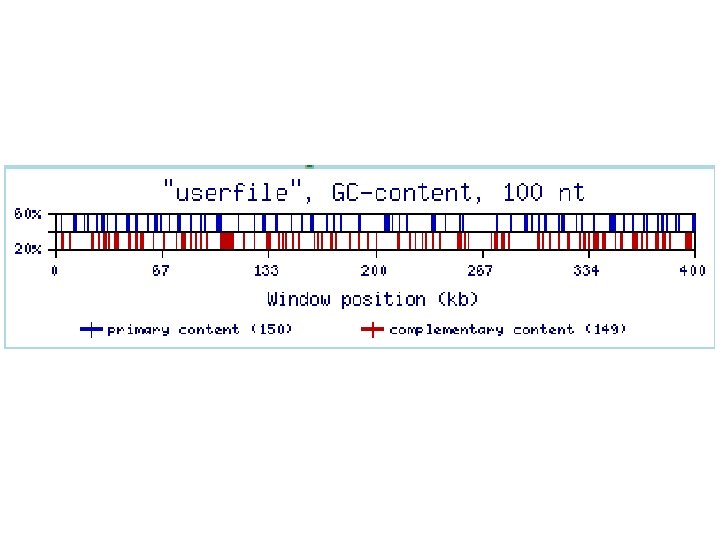
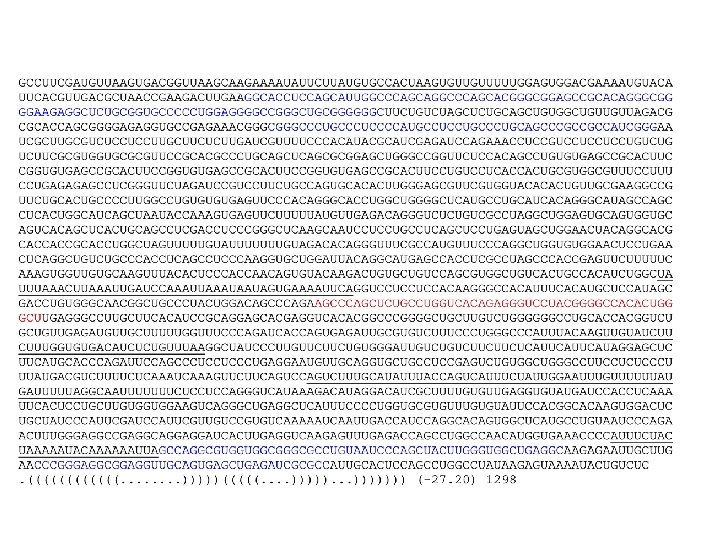
MRI-analyzer (Mid-Range Inhomogeneity) MRI-analyzer program scans input sequences with a mid-range window size (the default, utilized for the results presented, is a 50 nt window). When the GC-content of the sequence in this window reaches the upper threshold, MRI-analyzer generates a blue top spike on the output graph (Figure 3). Similarly, when the GC-content of the window reaches the lower threshold, MRIanalyzer generates a purple bottom spike. The upper and lower thresholds are flexible parameters defined by the user. MRIanalyzer output for natural and SRI-generated 3'-UTR and intron sequences is shown in the next figure.

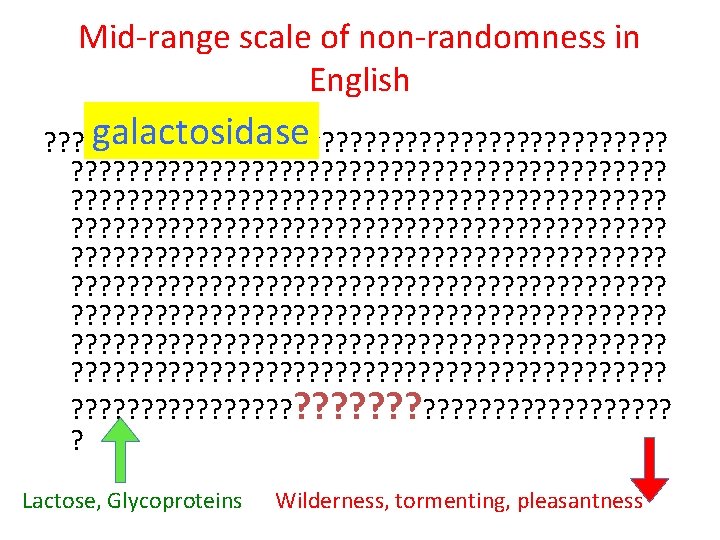
Looking for MRI in English language
![Conversion of English to the genomic (AGTC) language $decode{'d'}=['ACG', 'ACT']; $decode{'e'}=['AGA', 'AGC']; $decode{'f'}=['AGG', 'AGT'];](http://slidetodoc.com/presentation_image_h2/2145e2098a1aa385e289a4d9875c3412/image-43.jpg "Conversion of English to the genomic (AGTC) language $decode{'d'}=['ACG', 'ACT']; $decode{'e'}=['AGA', 'AGC']; $decode{'f'}=['AGG', 'AGT'];")
Conversion of English to the genomic (AGTC) language $decode{'d'}=['ACG', 'ACT']; $decode{'e'}=['AGA', 'AGC']; $decode{'f'}=['AGG', 'AGT']; $decode{'g'}=['ATA', 'ATC']; $decode{'h'}=['ATG', 'ATT']; $decode{'i'}=['CAA', 'CAC']; $decode{'j'}=['CAG', 'CAT']; $decode{'k'}=['CCA', 'CCC']; $decode{'l'}=['CCG', 'CCT']; $decode{'m'}=['CGA', 'CGC']; $decode{'n'}=['CGG', 'CGT'];

English language does not show profound MRI pattern

Assignment #2 • repeat all my Genomic MRI demonstration steps with your 70 thousand nucleotide –long promoter sequence of globin gene. • Does it enriched with – G+C-rich and –poor regions? – G+T-rich and –poor regions? – G+A-rich and –poor regions? Optional question for extra points to improve your grades: Repeat the same protocol with your masked promoter sequence (which you obtained after Repeat. Masking last week). Note, that SRI-generator program recognizes all N-s in the masked sequence and keep the same number and order of N-s in the randomized sequence. Do repetitive elements influence on the genomic MRI effect? How?

2 envelops paradox

Optional assignment #3 to improve your grades • Think over and investigate the two letters paradox • Whether similar problems exist in biology and physics? • Write 1 -2 pages report on your research

Assignment #1 Http: //www. springerlink. com/content/g 74 u 87880 k 58 w 001/ From this website download Trifonov’s review form “The codes of life” 2008 PDF (140. 4 KB), on the left side in the middle of the webpage. Read this review and write about all genomic codes. Rank these codes according to their importance, starting from the most valuable one. Present this ranking table with your arguments.

Assignment #2 1. repeat all my Genomic MRI demonstration steps with your 50 thousand nucleotide –long promoter sequence from lecture #6 (L 6). Use online GMRI recourse http: //bpg. utoledo. edu/~jbechtel/gmri/ 2. IF YOU WANT TO EARN EXTRA POINTS TRY TO RUN Perl GMRI PROGRAMS YOURSELF FROM A COMMAND LINE (Follow the instructions on MRI_demo. ABPG 2014. m 4 v and L 4_HOMEWORKdemo. doc). [Extra assignment for additional credits] After you have finished #1 answer the following questions: contrast with your randomized sequence, Does your promoter enriched with: 1. G+C-rich and –poor regions? 2. G+T-rich and –poor regions? 3. G+A-rich and –poor regions? 3.
- Slides: 50