
DNA Microarrays Patrick Schmid CSE 497 Spring 2004
- Slides: 43
DNA Microarrays Patrick Schmid CSE 497 Spring 2004 Patrick Schmid
What is a DNA Microarray? n n n Also known as DNA Chip Allows simultaneous measurement of the level of transcription for every gene in a genome (gene expression) Transcription? q q n Process of copying of DNA into messenger RNA (m. RNA) Environment dependant! Microarray detects m. RNA, or rather the more stable c. DNA Patrick Schmid 2
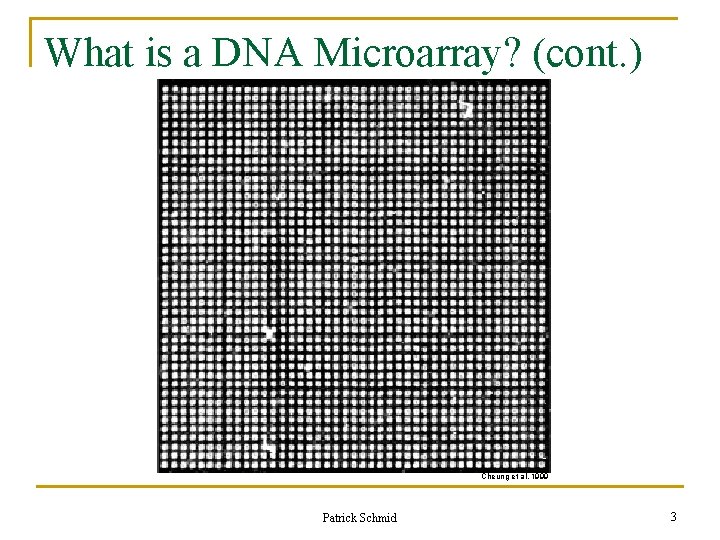
What is a DNA Microarray? (cont. ) Cheung et al. 1999 Patrick Schmid 3
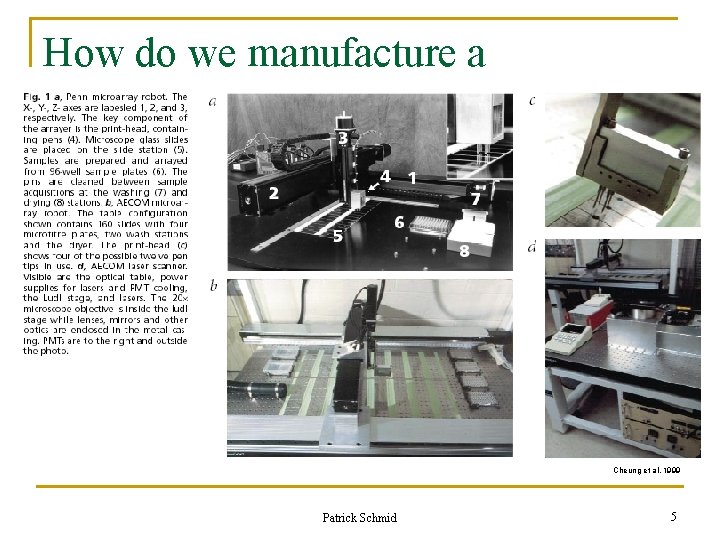
How do we manufacture a microarray? n n n Start with individual genes, e. g. the ~6, 200 genes of the yeast genome Amplify all of them using polymerase chain reaction (PCR) “Spot” them on a medium, e. g. an ordinary glass microscope slide Each spot is about 100 µm in diameter Spotting is done by a robot Complex and potentially expensive task Patrick Schmid 4
How do we manufacture a microarray? Cheung et al. 1999 Patrick Schmid 5
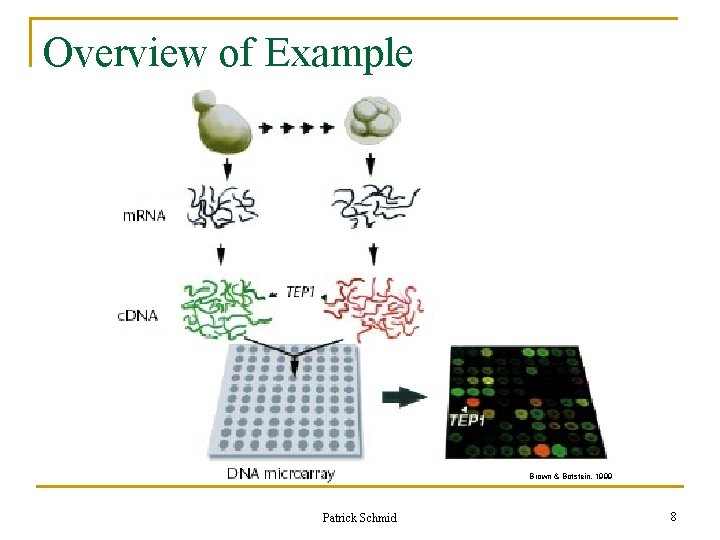
Example n n n Remember the flash animation? Yeast Grow in aerobic and anaerobic environment Different genes will be activated in order to adapt to each environment Extract m. RNA Convert m. RNA into colored c. DNA (fluorescently labeled) Patrick Schmid 6
Example (cont. ) n n n Mix c. DNA together Hybridize c. DNA with array Each c. DNA sequence hybridizes specifically with the corresponding gene sequence in the array Wash unhybridized c. DNA off Read array with laser Analyze images Patrick Schmid 7
Overview of Example Brown & Botstein, 1999 Patrick Schmid 8
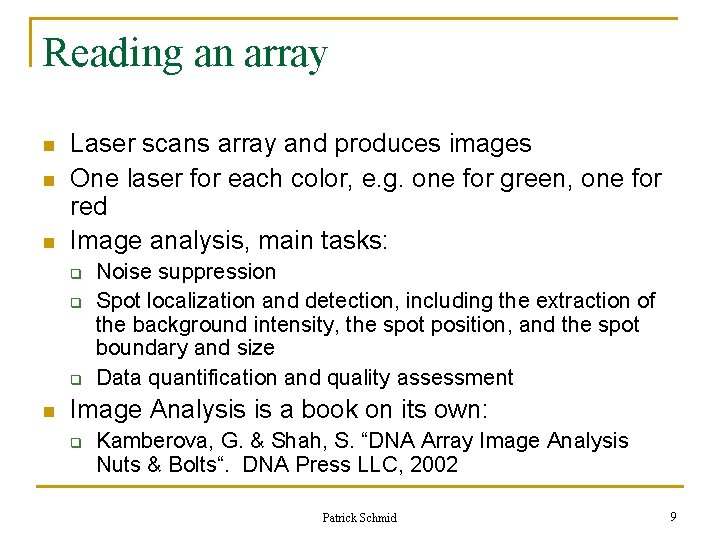
Reading an array n n n Laser scans array and produces images One laser for each color, e. g. one for green, one for red Image analysis, main tasks: q q q n Noise suppression Spot localization and detection, including the extraction of the background intensity, the spot position, and the spot boundary and size Data quantification and quality assessment Image Analysis is a book on its own: q Kamberova, G. & Shah, S. “DNA Array Image Analysis Nuts & Bolts“. DNA Press LLC, 2002 Patrick Schmid 9
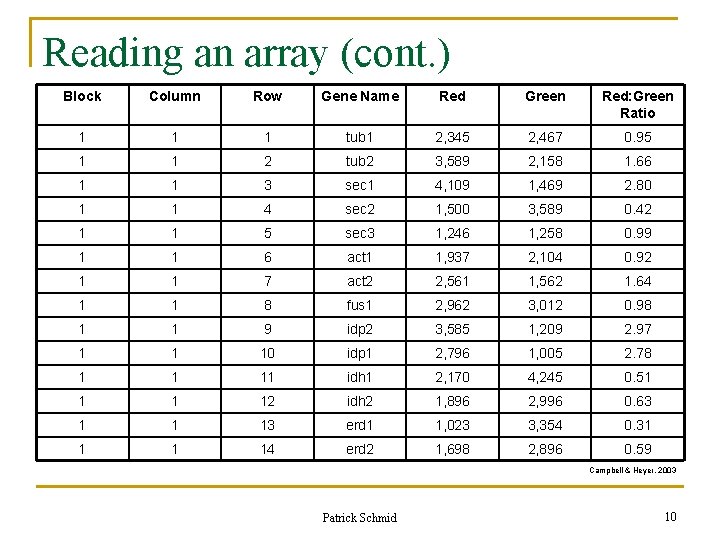
Reading an array (cont. ) Block Column Row Gene Name Red Green Red: Green Ratio 1 1 1 tub 1 2, 345 2, 467 0. 95 1 1 2 tub 2 3, 589 2, 158 1. 66 1 1 3 sec 1 4, 109 1, 469 2. 80 1 1 4 sec 2 1, 500 3, 589 0. 42 1 1 5 sec 3 1, 246 1, 258 0. 99 1 1 6 act 1 1, 937 2, 104 0. 92 1 1 7 act 2 2, 561 1, 562 1. 64 1 1 8 fus 1 2, 962 3, 012 0. 98 1 1 9 idp 2 3, 585 1, 209 2. 97 1 1 10 idp 1 2, 796 1, 005 2. 78 1 1 11 idh 1 2, 170 4, 245 0. 51 1 1 12 idh 2 1, 896 2, 996 0. 63 1 1 13 erd 1 1, 023 3, 354 0. 31 1 1 14 erd 2 1, 698 2, 896 0. 59 Campbell & Heyer, 2003 Patrick Schmid 10
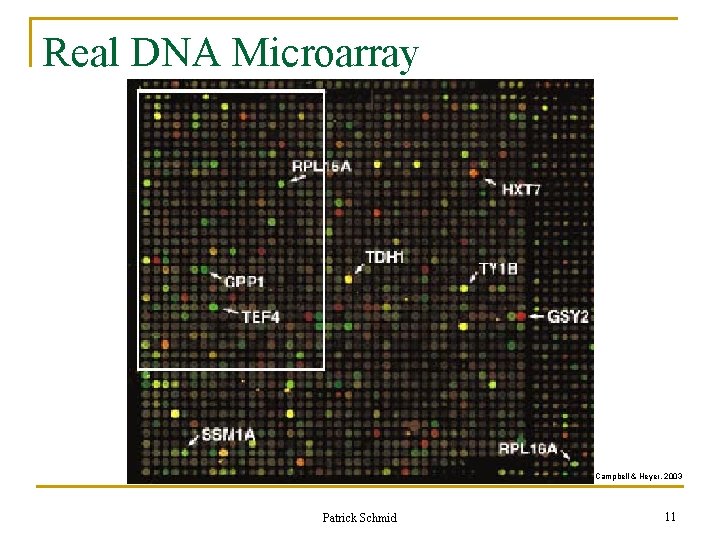
Real DNA Microarray Campbell & Heyer, 2003 Patrick Schmid 11
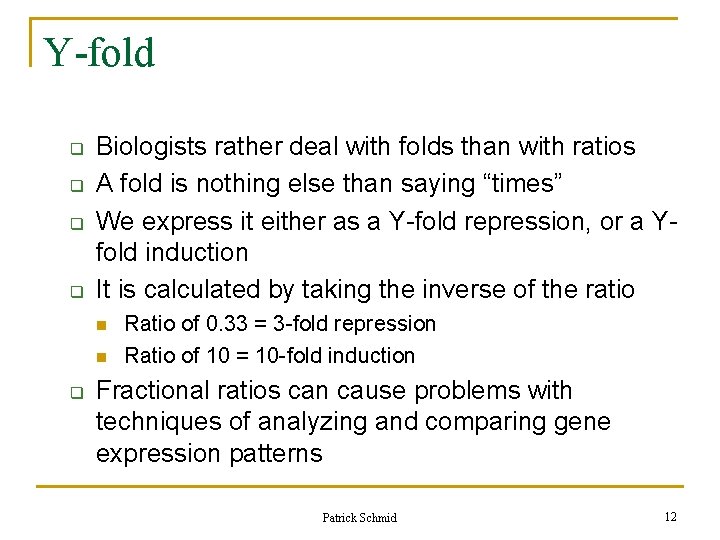
Y-fold q q Biologists rather deal with folds than with ratios A fold is nothing else than saying “times” We express it either as a Y-fold repression, or a Yfold induction It is calculated by taking the inverse of the ratio n n q Ratio of 0. 33 = 3 -fold repression Ratio of 10 = 10 -fold induction Fractional ratios can cause problems with techniques of analyzing and comparing gene expression patterns Patrick Schmid 12
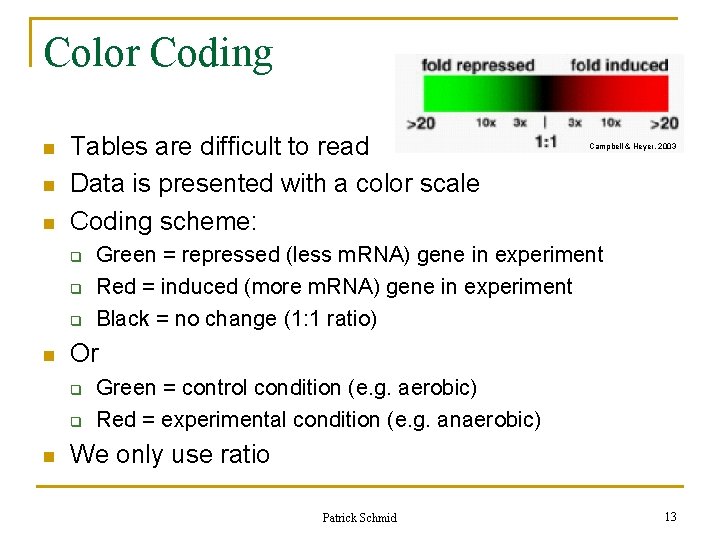
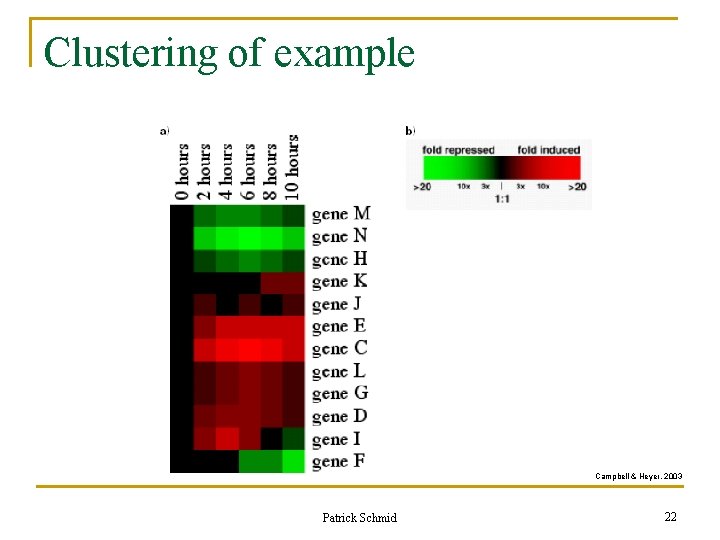
Color Coding n n n Tables are difficult to read Data is presented with a color scale Coding scheme: q q q n Green = repressed (less m. RNA) gene in experiment Red = induced (more m. RNA) gene in experiment Black = no change (1: 1 ratio) Or q q n Campbell & Heyer, 2003 Green = control condition (e. g. aerobic) Red = experimental condition (e. g. anaerobic) We only use ratio Patrick Schmid 13
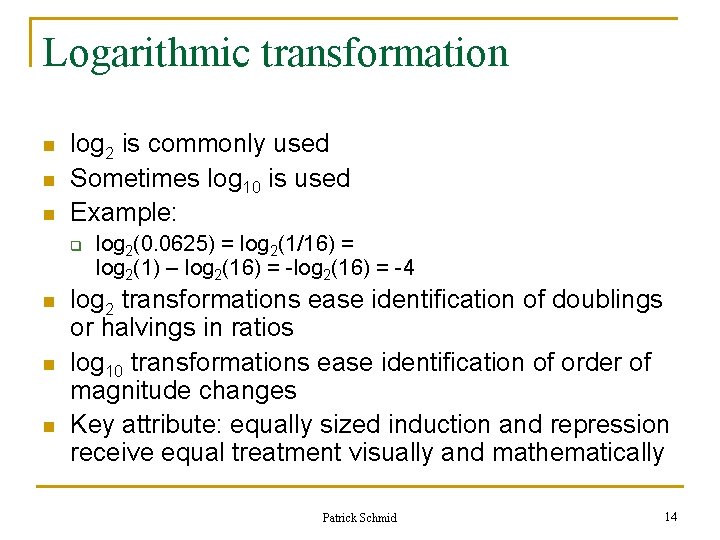
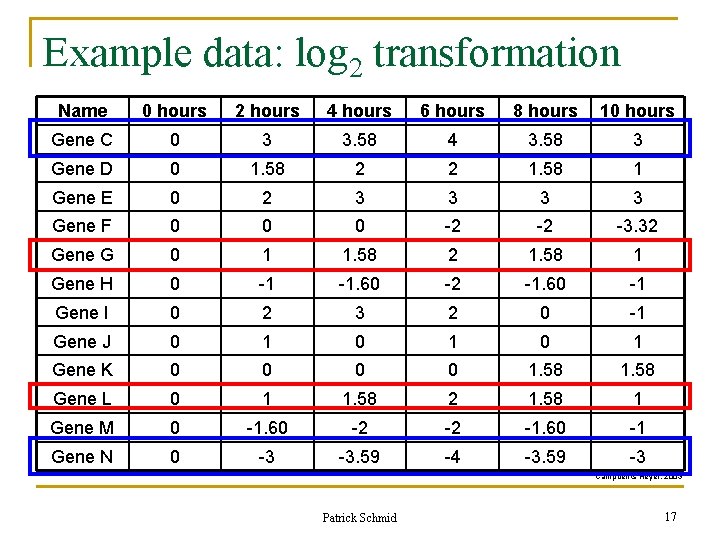
Logarithmic transformation n log 2 is commonly used Sometimes log 10 is used Example: q n n n log 2(0. 0625) = log 2(1/16) = log 2(1) – log 2(16) = -4 log 2 transformations ease identification of doublings or halvings in ratios log 10 transformations ease identification of order of magnitude changes Key attribute: equally sized induction and repression receive equal treatment visually and mathematically Patrick Schmid 14
Complication: Time Series n n n Biologists care more about the process of adaptation than about the end result For example, measure every 2 hours for 10 hours (depletion of oxygen) 31, 000 gene expression ratios Or 6, 200 different graphs with five data points each Question: Are there any genes that responded in similar ways to the depletion of oxygen? Patrick Schmid 15
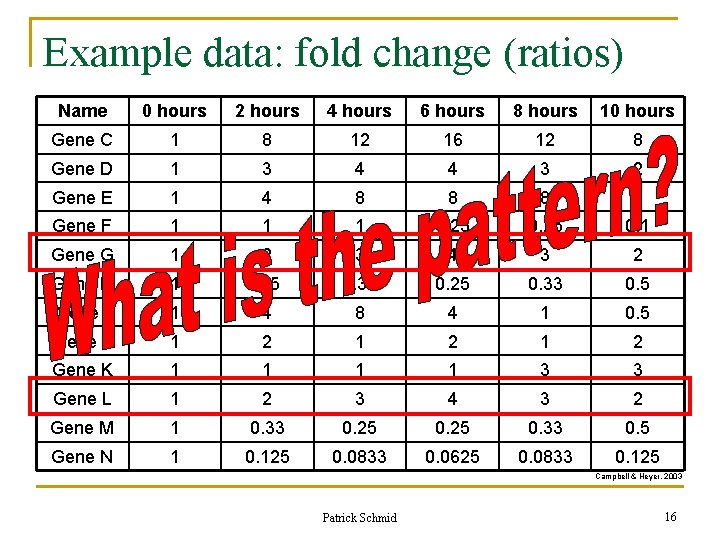
Example data: fold change (ratios) Name 0 hours 2 hours 4 hours 6 hours 8 hours 10 hours Gene C 1 8 12 16 12 8 Gene D 1 3 4 4 3 2 Gene E 1 4 8 8 Gene F 1 1 1 0. 25 0. 1 Gene G 1 2 3 4 3 2 Gene H 1 0. 5 0. 33 0. 25 0. 33 0. 5 Gene I 1 4 8 4 1 0. 5 Gene J 1 2 1 2 Gene K 1 1 3 3 Gene L 1 2 3 4 3 2 Gene M 1 0. 33 0. 25 0. 33 0. 5 Gene N 1 0. 125 0. 0833 0. 0625 0. 0833 0. 125 Campbell & Heyer, 2003 Patrick Schmid 16
Example data: log 2 transformation Name 0 hours 2 hours 4 hours 6 hours 8 hours 10 hours Gene C 0 3 3. 58 4 3. 58 3 Gene D 0 1. 58 2 2 1. 58 1 Gene E 0 2 3 3 Gene F 0 0 0 -2 -2 -3. 32 Gene G 0 1 1. 58 2 1. 58 1 Gene H 0 -1 -1. 60 -2 -1. 60 -1 Gene I 0 2 3 2 0 -1 Gene J 0 1 0 1 Gene K 0 0 1. 58 Gene L 0 1 1. 58 2 1. 58 1 Gene M 0 -1. 60 -2 -2 -1. 60 -1 Gene N 0 -3 -3. 59 -4 -3. 59 -3 Campbell & Heyer, 2003 Patrick Schmid 17
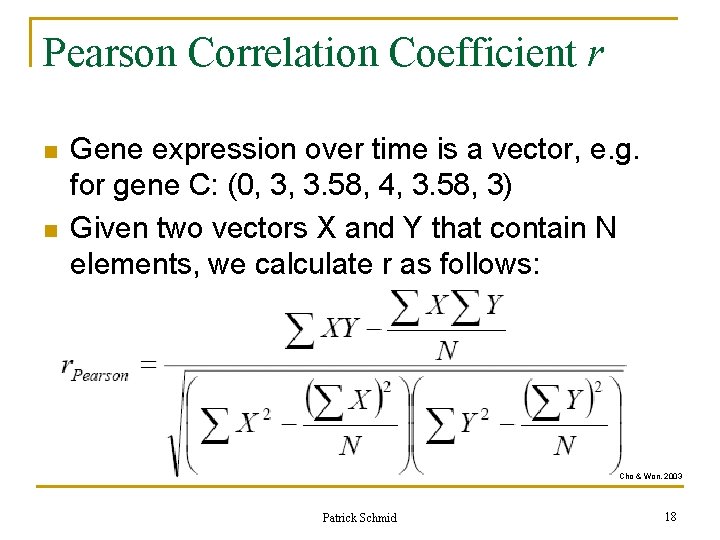
Pearson Correlation Coefficient r n n Gene expression over time is a vector, e. g. for gene C: (0, 3, 3. 58, 4, 3. 58, 3) Given two vectors X and Y that contain N elements, we calculate r as follows: Cho & Won, 2003 Patrick Schmid 18
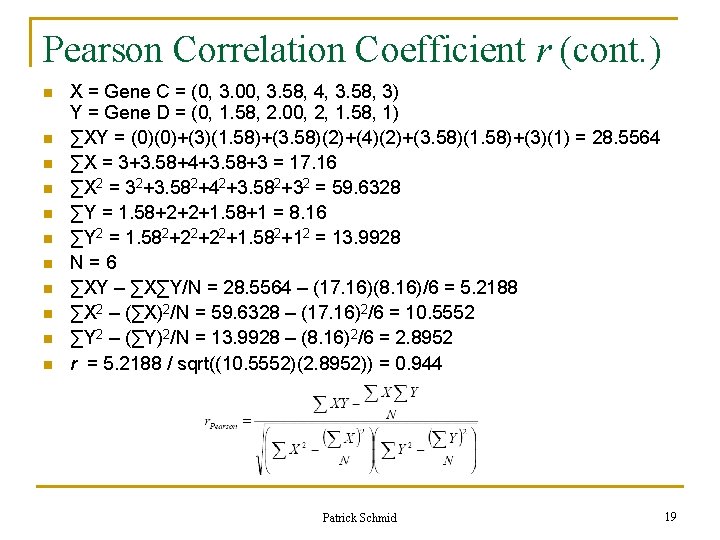
Pearson Correlation Coefficient r (cont. ) n n n X = Gene C = (0, 3. 00, 3. 58, 4, 3. 58, 3) Y = Gene D = (0, 1. 58, 2. 00, 2, 1. 58, 1) ∑XY = (0)(0)+(3)(1. 58)+(3. 58)(2)+(4)(2)+(3. 58)(1. 58)+(3)(1) = 28. 5564 ∑X = 3+3. 58+4+3. 58+3 = 17. 16 ∑X 2 = 32+3. 582+42+3. 582+32 = 59. 6328 ∑Y = 1. 58+2+2+1. 58+1 = 8. 16 ∑Y 2 = 1. 582+22+22+1. 582+12 = 13. 9928 N=6 ∑XY – ∑X∑Y/N = 28. 5564 – (17. 16)(8. 16)/6 = 5. 2188 ∑X 2 – (∑X)2/N = 59. 6328 – (17. 16)2/6 = 10. 5552 ∑Y 2 – (∑Y)2/N = 13. 9928 – (8. 16)2/6 = 2. 8952 r = 5. 2188 / sqrt((10. 5552)(2. 8952)) = 0. 944 Patrick Schmid 19
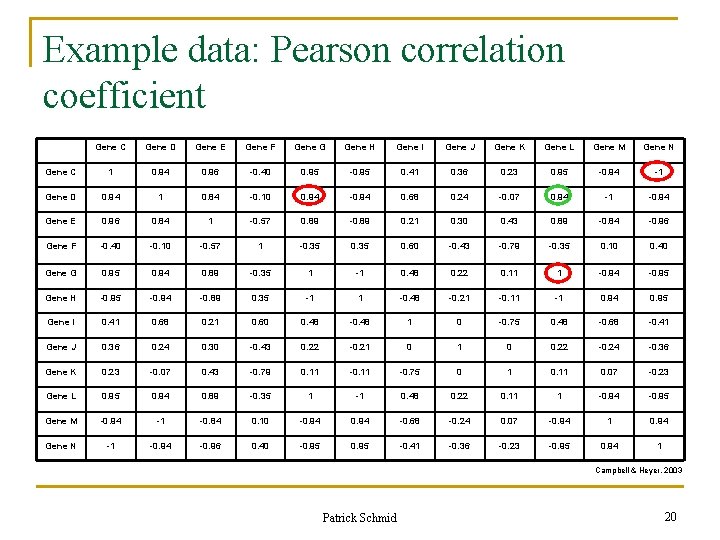
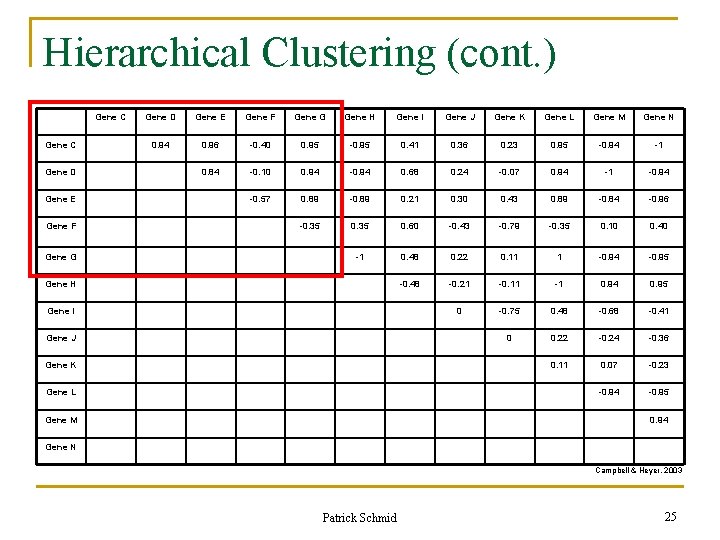
Example data: Pearson correlation coefficient Gene C Gene D Gene E Gene F Gene G Gene H Gene I Gene J Gene K Gene L Gene M Gene N Gene C 1 0. 94 0. 96 -0. 40 0. 95 -0. 95 0. 41 0. 36 0. 23 0. 95 -0. 94 -1 Gene D 0. 94 1 0. 84 -0. 10 0. 94 -0. 94 0. 68 0. 24 -0. 07 0. 94 -1 -0. 94 Gene E 0. 96 0. 84 1 -0. 57 0. 89 -0. 89 0. 21 0. 30 0. 43 0. 89 -0. 84 -0. 96 Gene F -0. 40 -0. 10 -0. 57 1 -0. 35 0. 60 -0. 43 -0. 79 -0. 35 0. 10 0. 40 Gene G 0. 95 0. 94 0. 89 -0. 35 1 -1 0. 48 0. 22 0. 11 1 -0. 94 -0. 95 Gene H -0. 95 -0. 94 -0. 89 0. 35 -1 1 -0. 48 -0. 21 -0. 11 -1 0. 94 0. 95 Gene I 0. 41 0. 68 0. 21 0. 60 0. 48 -0. 48 1 0 -0. 75 0. 48 -0. 68 -0. 41 Gene J 0. 36 0. 24 0. 30 -0. 43 0. 22 -0. 21 0 0. 22 -0. 24 -0. 36 Gene K 0. 23 -0. 07 0. 43 -0. 79 0. 11 -0. 75 0 1 0. 11 0. 07 -0. 23 Gene L 0. 95 0. 94 0. 89 -0. 35 1 -1 0. 48 0. 22 0. 11 1 -0. 94 -0. 95 Gene M -0. 94 -1 -0. 84 0. 10 -0. 94 -0. 68 -0. 24 0. 07 -0. 94 1 0. 94 Gene N -1 -0. 94 -0. 96 0. 40 -0. 95 -0. 41 -0. 36 -0. 23 -0. 95 0. 94 1 Campbell & Heyer, 2003 Patrick Schmid 20
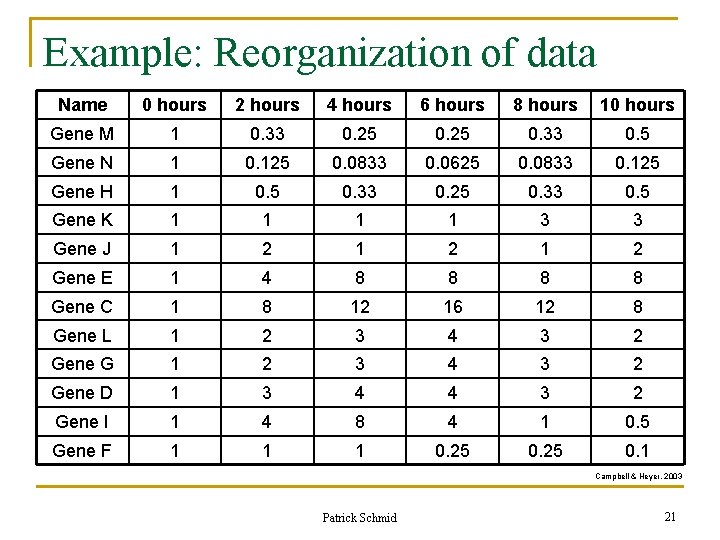
Example: Reorganization of data Name 0 hours 2 hours 4 hours 6 hours 8 hours 10 hours Gene M 1 0. 33 0. 25 0. 33 0. 5 Gene N 1 0. 125 0. 0833 0. 0625 0. 0833 0. 125 Gene H 1 0. 5 0. 33 0. 25 0. 33 0. 5 Gene K 1 1 3 3 Gene J 1 2 1 2 Gene E 1 4 8 8 Gene C 1 8 12 16 12 8 Gene L 1 2 3 4 3 2 Gene G 1 2 3 4 3 2 Gene D 1 3 4 4 3 2 Gene I 1 4 8 4 1 0. 5 Gene F 1 1 1 0. 25 0. 1 Campbell & Heyer, 2003 Patrick Schmid 21
Clustering of example Campbell & Heyer, 2003 Patrick Schmid 22
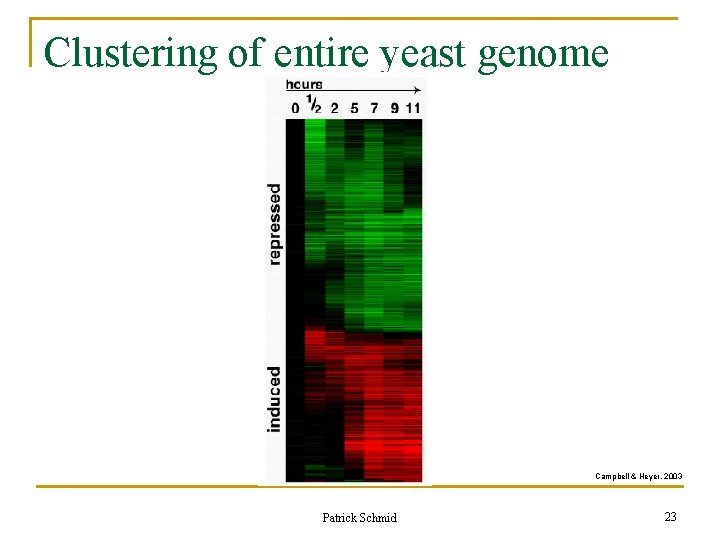
Clustering of entire yeast genome Campbell & Heyer, 2003 Patrick Schmid 23
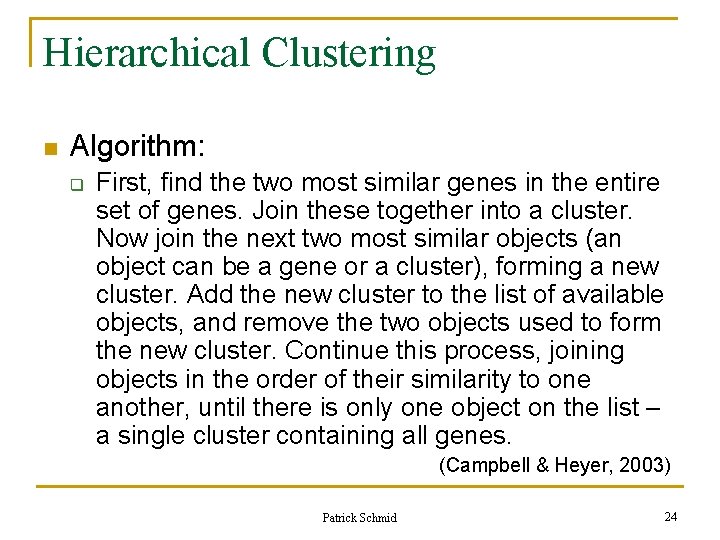
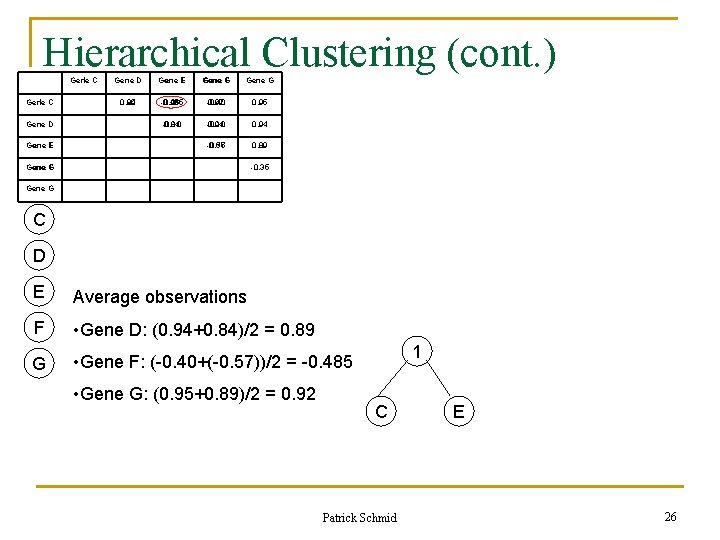
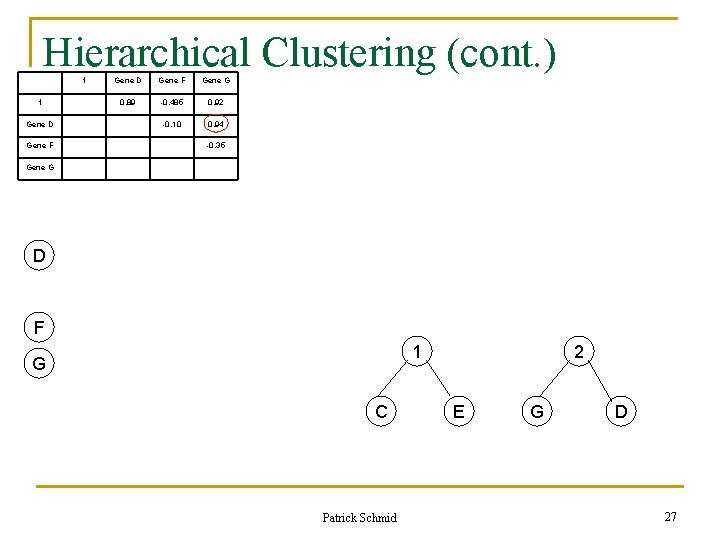
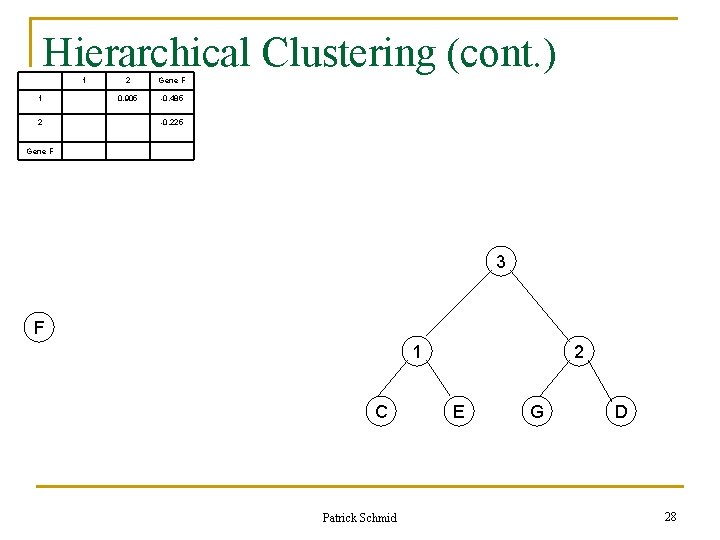
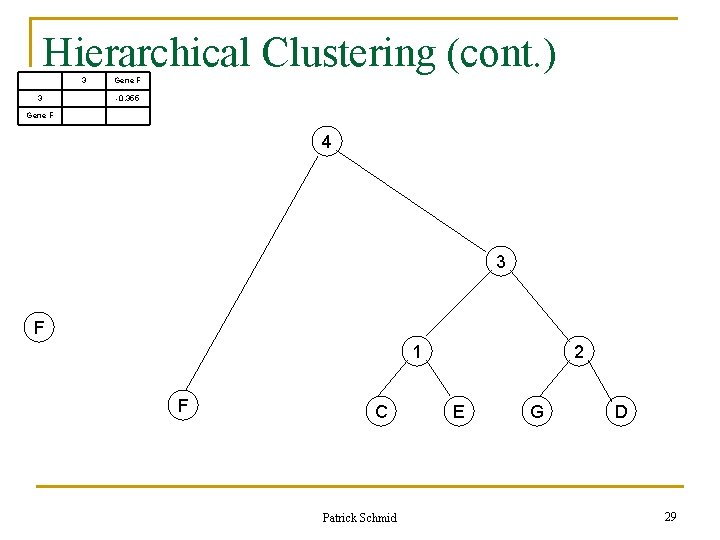
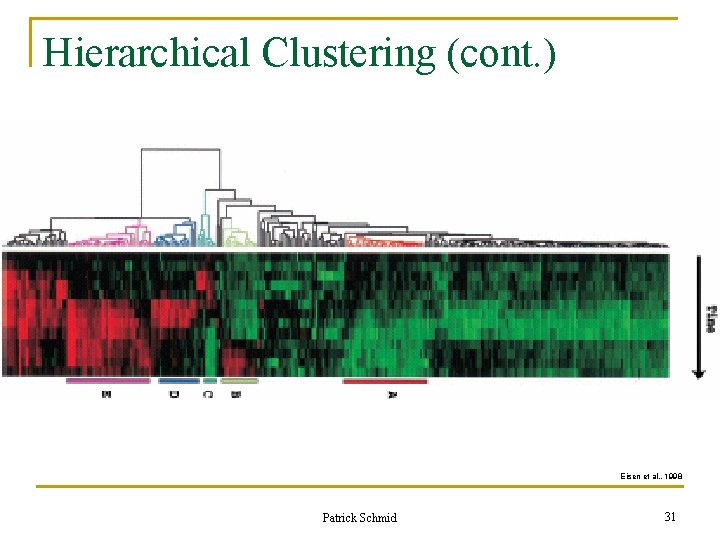
Hierarchical Clustering n Algorithm: q First, find the two most similar genes in the entire set of genes. Join these together into a cluster. Now join the next two most similar objects (an object can be a gene or a cluster), forming a new cluster. Add the new cluster to the list of available objects, and remove the two objects used to form the new cluster. Continue this process, joining objects in the order of their similarity to one another, until there is only one object on the list – a single cluster containing all genes. (Campbell & Heyer, 2003) Patrick Schmid 24
Hierarchical Clustering (cont. ) Gene C Gene D Gene E Gene F Gene G Gene H Gene I Gene J Gene K Gene L Gene M Gene N 0. 94 0. 96 -0. 40 0. 95 -0. 95 0. 41 0. 36 0. 23 0. 95 -0. 94 -1 0. 84 -0. 10 0. 94 -0. 94 0. 68 0. 24 -0. 07 0. 94 -1 -0. 94 -0. 57 0. 89 -0. 89 0. 21 0. 30 0. 43 0. 89 -0. 84 -0. 96 -0. 35 0. 60 -0. 43 -0. 79 -0. 35 0. 10 0. 40 -1 0. 48 0. 22 0. 11 1 -0. 94 -0. 95 -0. 48 -0. 21 -0. 11 -1 0. 94 0. 95 0 -0. 75 0. 48 -0. 68 -0. 41 0 0. 22 -0. 24 -0. 36 0. 11 0. 07 -0. 23 -0. 94 -0. 95 Gene H Gene I Gene J Gene K Gene L Gene M 0. 94 Gene N Campbell & Heyer, 2003 Patrick Schmid 25
Hierarchical Clustering (cont. ) Gene 1 C Gene D F Gene E Gene D Gene E F Gene G 0. 94 0. 89 -0. 485 0. 96 -0. 40 0. 92 0. 95 -0. 10 0. 84 0. 94 -0. 10 0. 94 -0. 35 -0. 57 0. 89 Gene G F -0. 35 Gene G C D E Average observations F • Gene D: (0. 94+0. 84)/2 = 0. 89 G • Gene F: (-0. 40+(-0. 57))/2 = -0. 485 • Gene G: (0. 95+0. 89)/2 = 0. 92 1 C Patrick Schmid E 26
Hierarchical Clustering (cont. ) 1 1 Gene D Gene F Gene G 0. 89 -0. 485 0. 92 -0. 10 0. 94 -0. 35 Gene G D F 1 G C Patrick Schmid 2 E G D 27
Hierarchical Clustering (cont. ) 1 1 2 2 Gene F 0. 905 -0. 485 -0. 225 Gene F 3 F 1 C Patrick Schmid 2 E G D 28
Hierarchical Clustering (cont. ) 3 3 Gene F -0. 355 Gene F 4 3 F 1 F C Patrick Schmid 2 E G D 29
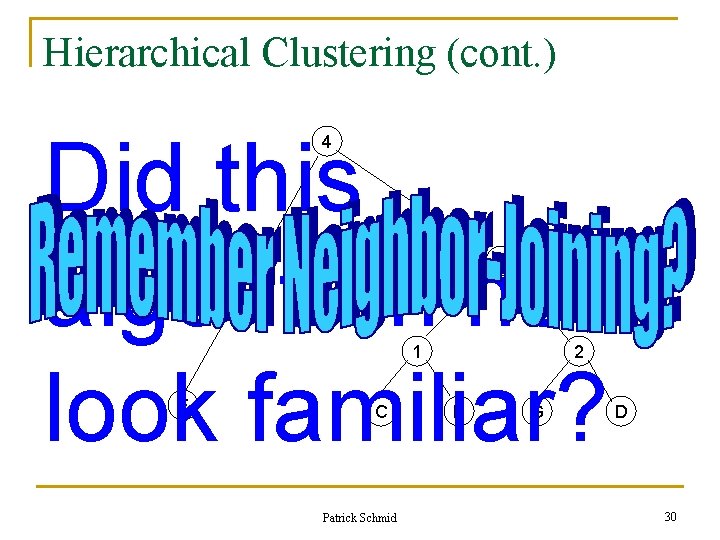
Hierarchical Clustering (cont. ) Did this algorithm not look familiar? 4 3 1 F C Patrick Schmid 2 E G D 30
Hierarchical Clustering (cont. ) Eisen et al. , 1998 Patrick Schmid 31
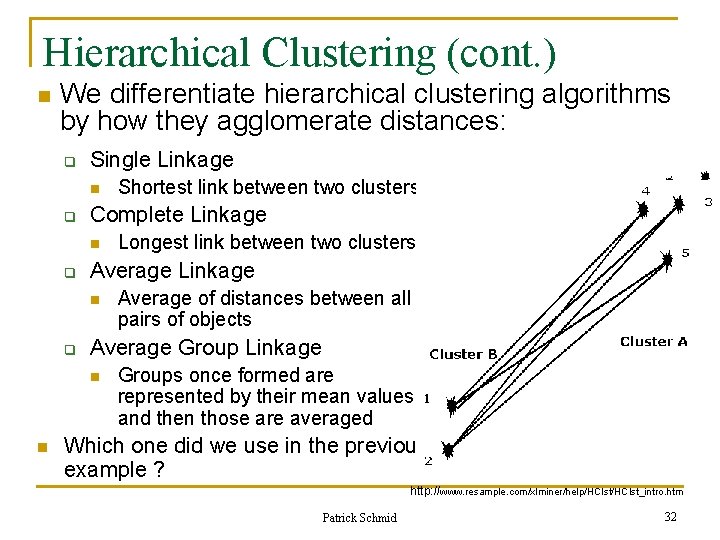
Hierarchical Clustering (cont. ) n We differentiate hierarchical clustering algorithms by how they agglomerate distances: q Single Linkage n q Complete Linkage n q Average of distances between all pairs of objects Average Group Linkage n n Longest link between two clusters Average Linkage n q Shortest link between two clusters Groups once formed are represented by their mean values, and then those are averaged Which one did we use in the previous example ? http: //www. resample. com/xlminer/help/HClst_intro. htm Patrick Schmid 32
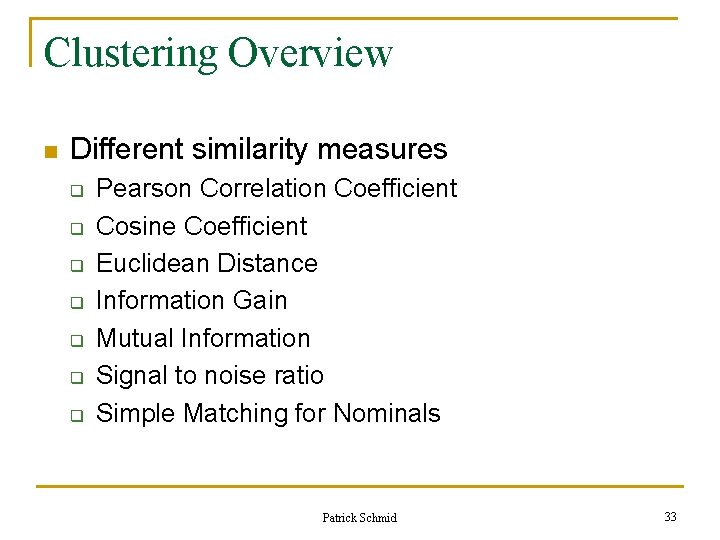
Clustering Overview n Different similarity measures q q q q Pearson Correlation Coefficient Cosine Coefficient Euclidean Distance Information Gain Mutual Information Signal to noise ratio Simple Matching for Nominals Patrick Schmid 33
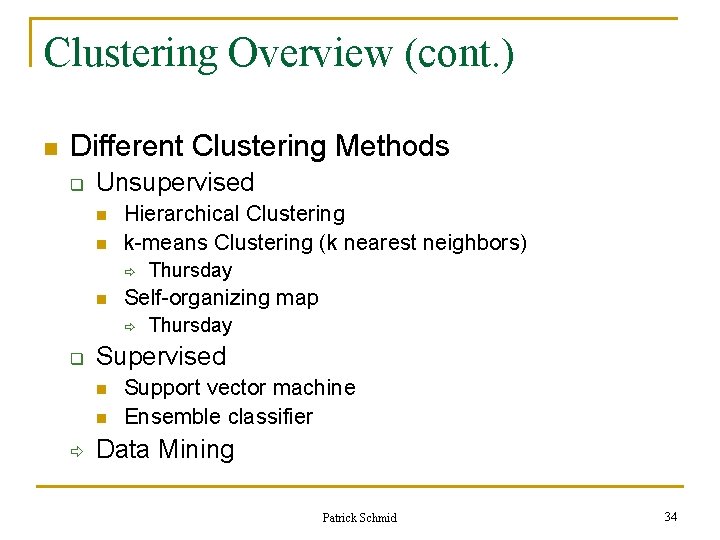
Clustering Overview (cont. ) n Different Clustering Methods q Unsupervised n n Hierarchical Clustering k-means Clustering (k nearest neighbors) ð n Self-organizing map ð q Thursday Supervised n n ð Thursday Support vector machine Ensemble classifier Data Mining Patrick Schmid 34
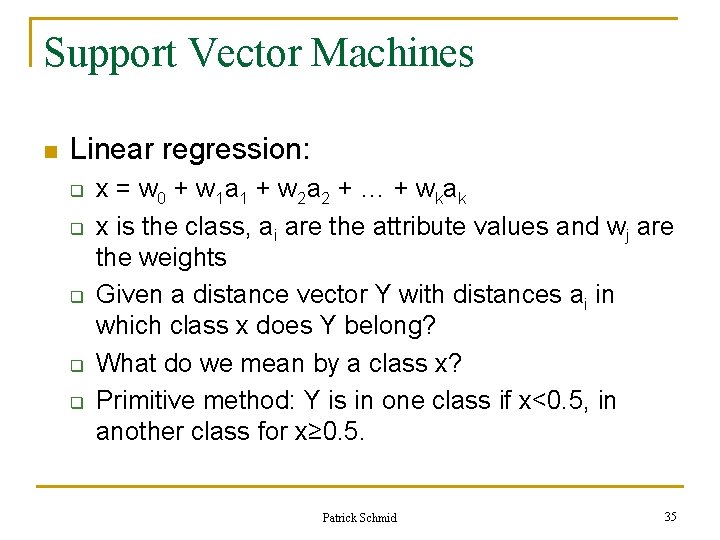
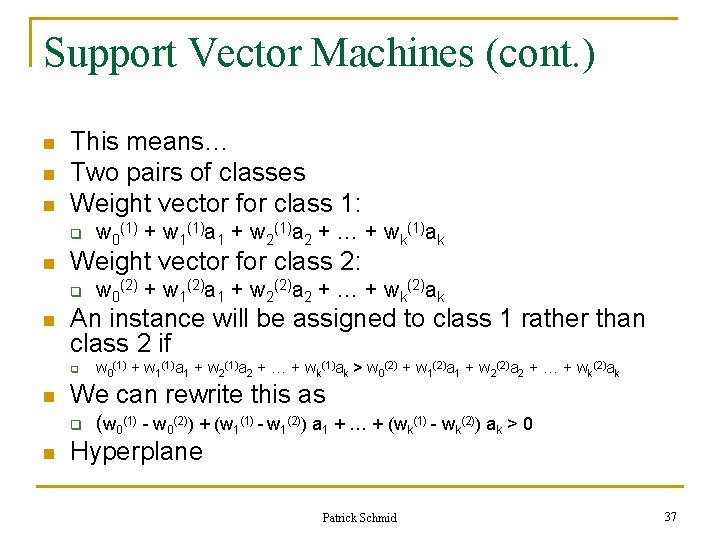
Support Vector Machines n Linear regression: q q q x = w 0 + w 1 a 1 + w 2 a 2 + … + wkak x is the class, ai are the attribute values and wj are the weights Given a distance vector Y with distances ai in which class x does Y belong? What do we mean by a class x? Primitive method: Y is in one class if x<0. 5, in another class for x≥ 0. 5. Patrick Schmid 35
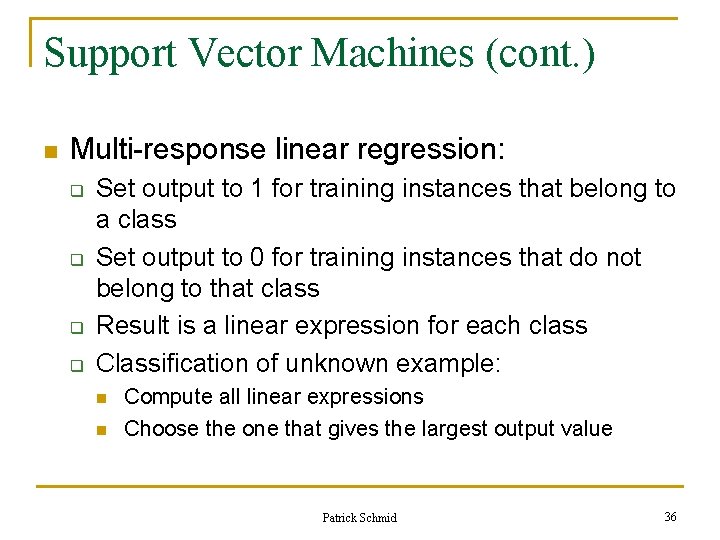
Support Vector Machines (cont. ) n Multi-response linear regression: q q Set output to 1 for training instances that belong to a class Set output to 0 for training instances that do not belong to that class Result is a linear expression for each class Classification of unknown example: n n Compute all linear expressions Choose the one that gives the largest output value Patrick Schmid 36
Support Vector Machines (cont. ) n n n This means… Two pairs of classes Weight vector for class 1: q n Weight vector for class 2: q n w 0(1) + w 1(1)a 1 + w 2(1)a 2 + … + wk(1)ak > w 0(2) + w 1(2)a 1 + w 2(2)a 2 + … + wk(2)ak We can rewrite this as q n w 0(2) + w 1(2)a 1 + w 2(2)a 2 + … + wk(2)ak An instance will be assigned to class 1 rather than class 2 if q n w 0(1) + w 1(1)a 1 + w 2(1)a 2 + … + wk(1)ak (w 0(1) - w 0(2)) + (w 1(1) - w 1(2)) a 1 + … + (wk(1) - wk(2)) ak > 0 Hyperplane Patrick Schmid 37
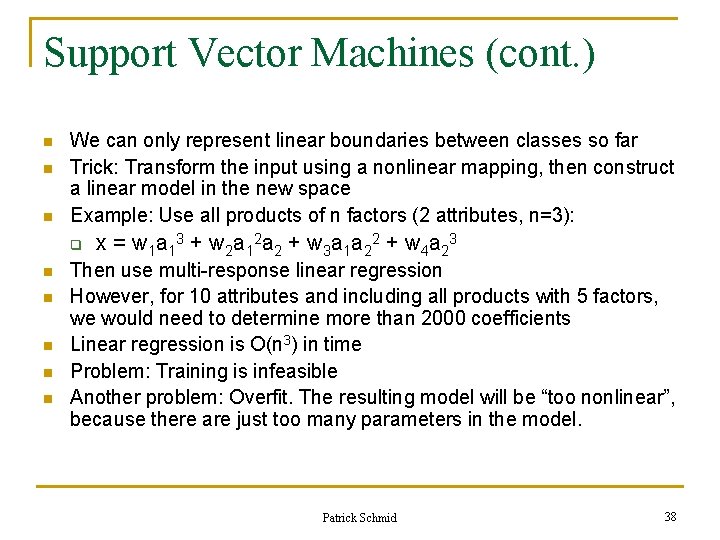
Support Vector Machines (cont. ) n n n We can only represent linear boundaries between classes so far Trick: Transform the input using a nonlinear mapping, then construct a linear model in the new space Example: Use all products of n factors (2 attributes, n=3): q n n n x = w 1 a 13 + w 2 a 12 a 2 + w 3 a 1 a 22 + w 4 a 23 Then use multi-response linear regression However, for 10 attributes and including all products with 5 factors, we would need to determine more than 2000 coefficients Linear regression is O(n 3) in time Problem: Training is infeasible Another problem: Overfit. The resulting model will be “too nonlinear”, because there are just too many parameters in the model. Patrick Schmid 38
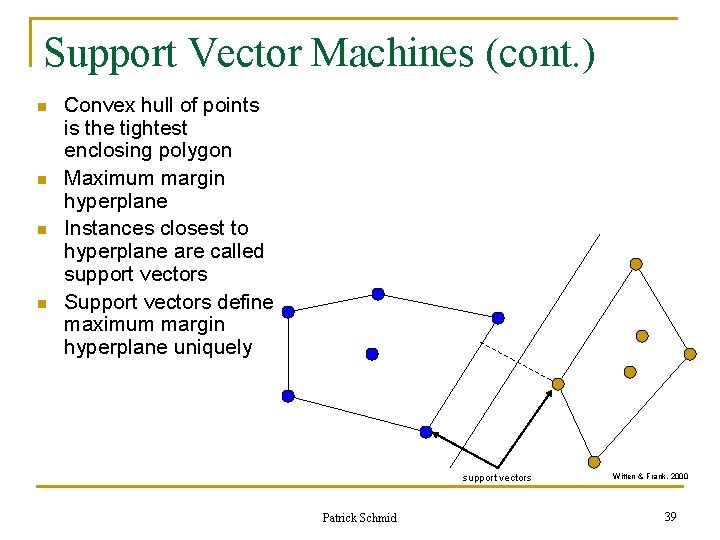
Support Vector Machines (cont. ) n n Convex hull of points is the tightest enclosing polygon Maximum margin hyperplane Instances closest to hyperplane are called support vectors Support vectors define maximum margin hyperplane uniquely support vectors Patrick Schmid Witten & Frank, 2000 39
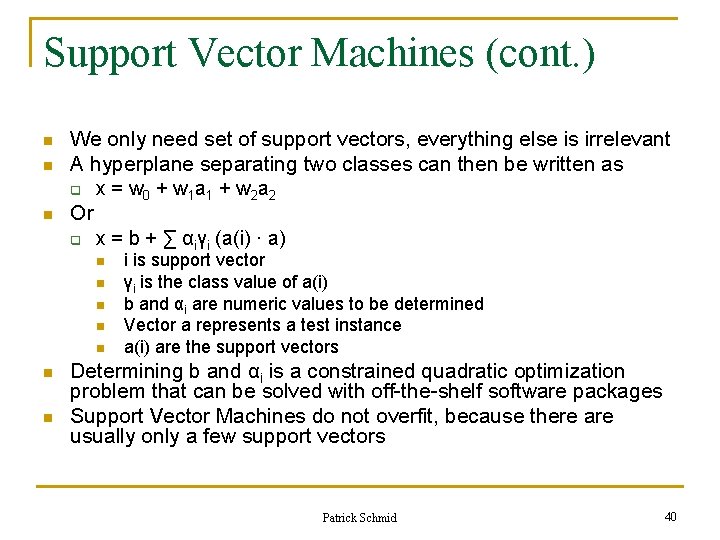
Support Vector Machines (cont. ) n n n We only need set of support vectors, everything else is irrelevant A hyperplane separating two classes can then be written as q x = w 0 + w 1 a 1 + w 2 a 2 Or q x = b + ∑ αiγi (a(i) ∙ a) n n n n i is support vector γi is the class value of a(i) b and αi are numeric values to be determined Vector a represents a test instance a(i) are the support vectors Determining b and αi is a constrained quadratic optimization problem that can be solved with off-the-shelf software packages Support Vector Machines do not overfit, because there are usually only a few support vectors Patrick Schmid 40
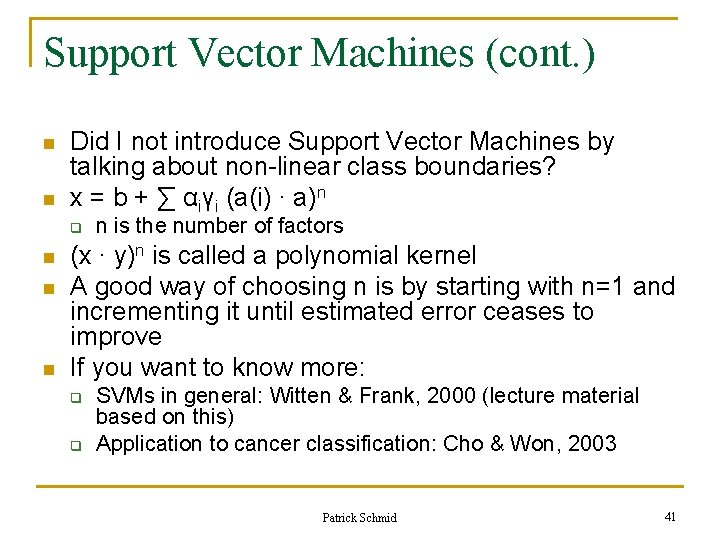
Support Vector Machines (cont. ) n n Did I not introduce Support Vector Machines by talking about non-linear class boundaries? x = b + ∑ αiγi (a(i) ∙ a)n q n n is the number of factors (x ∙ y)n is called a polynomial kernel A good way of choosing n is by starting with n=1 and incrementing it until estimated error ceases to improve If you want to know more: q q SVMs in general: Witten & Frank, 2000 (lecture material based on this) Application to cancer classification: Cho & Won, 2003 Patrick Schmid 41
Demo – Shneiderman Patrick Schmid
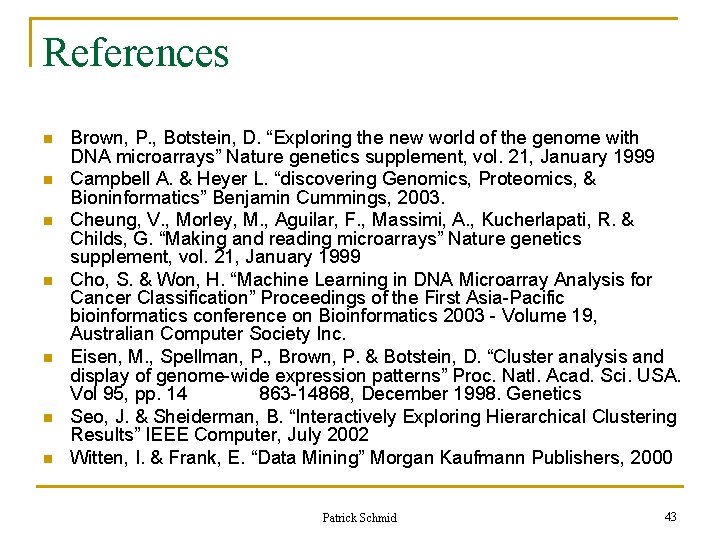
References n n n n Brown, P. , Botstein, D. “Exploring the new world of the genome with DNA microarrays” Nature genetics supplement, vol. 21, January 1999 Campbell A. & Heyer L. “discovering Genomics, Proteomics, & Bioninformatics” Benjamin Cummings, 2003. Cheung, V. , Morley, M. , Aguilar, F. , Massimi, A. , Kucherlapati, R. & Childs, G. “Making and reading microarrays” Nature genetics supplement, vol. 21, January 1999 Cho, S. & Won, H. “Machine Learning in DNA Microarray Analysis for Cancer Classification” Proceedings of the First Asia-Pacific bioinformatics conference on Bioinformatics 2003 - Volume 19, Australian Computer Society Inc. Eisen, M. , Spellman, P. , Brown, P. & Botstein, D. “Cluster analysis and display of genome-wide expression patterns” Proc. Natl. Acad. Sci. USA. Vol 95, pp. 14 863 -14868, December 1998. Genetics Seo, J. & Sheiderman, B. “Interactively Exploring Hierarchical Clustering Results” IEEE Computer, July 2002 Witten, I. & Frank, E. “Data Mining” Morgan Kaufmann Publishers, 2000 Patrick Schmid 43