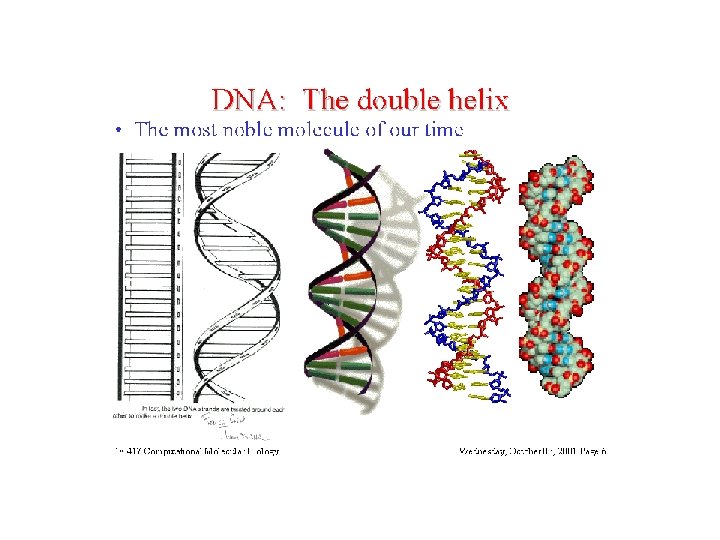
DNA Microarray Microarray Printing 96 wellplate PCR Products

 384 -well print-plate Microarray")


 R-I Plot R-IFollowing Plot, Raw Loess Data log 10(R*G)")
")


- Slides: 40
DNA Microarray
Microarray Printing 96 -well-plate (PCR Products) 384 -well print-plate Microarray
Differential Expression • Each cell contains a complete copy of the organism’s genome • Cells are of many different types and state e. g. blood, nerve, skin cells, etc • What makes the cells different ? • Differential gene expression, i. e. , when, where and in what quantity each gene is expressed • On average, 40% of our genes are expressed at any given time
Functional genomics • The various genome projects have yielded the complete DNA sequences of many organisms. e. g. human, mouse, yeast, fruitfly, etc. • Human: 3 billion base-pairs, 30 -40 thousand genes. • Challenge: go from sequence to function, i. e. , define the role of each gene and understand how the genome functions as a whole.
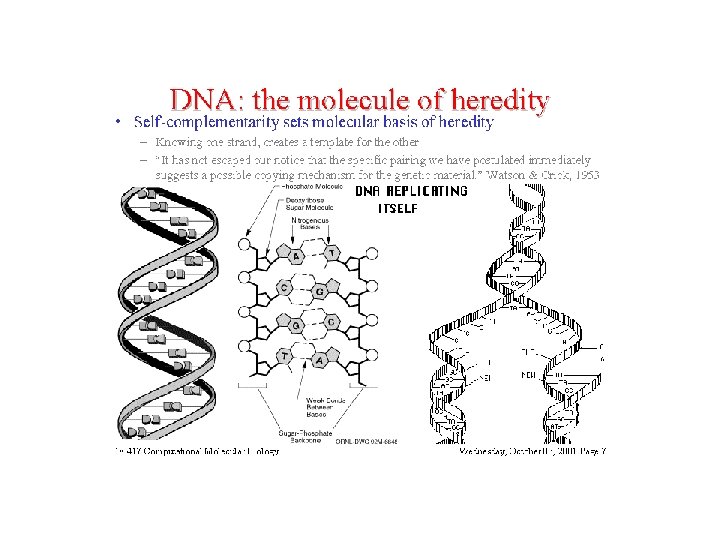
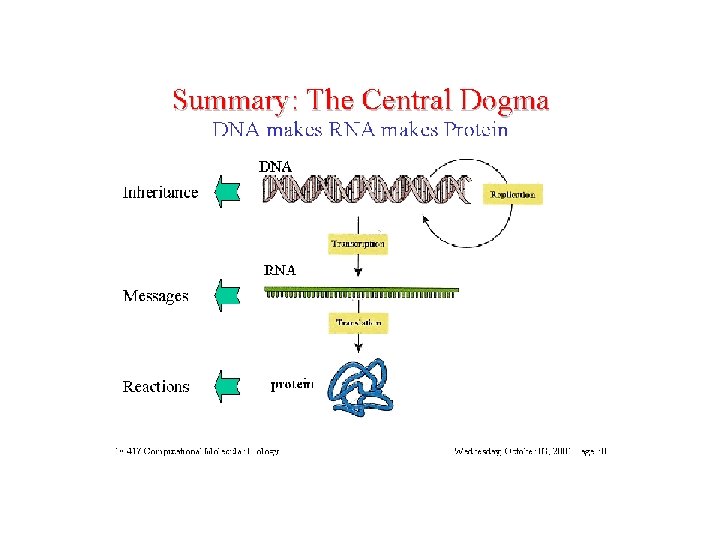
Central Dogma • The expression of the genetic information stored in the DNA Molecule occurs in two stages: --transcription, during which DNA is transcribed into m. RNA; --translation, during which m. RNA is translated to produce a protein. • DNA m. RNA Protein c. DNA Arrays Tissue Arrays
The Central Dogma of Molecular Biology
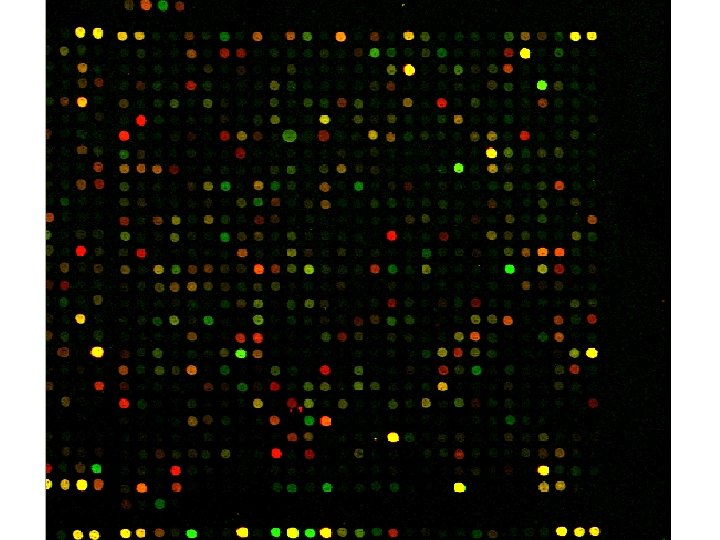
Microarray Hybridization
Microarray Gene Expression Image
A Better Look
Image Analysis & Data Visualization Cy 3 Experiments Cy 5 Cy 3 Genes Underexpressed Overexpressed Cy 5 log 2 Cy 3 8 4 2 fold 2 4 8
New Data Spot. List Scan. Alyze/Gene. Pix Cluster Database Data Selection SOM K-means SVD Complete Data Table (cdt)
Ovarian Tumor Study M. Schaner Samples that should Cluster together do not
Data Normalization
Pool of Cell Lines Tumor Different amounts of starting material.
Different amounts of RNA in each channel
Differential labeling efficiency of dyes
Differential efficiency of hybridiz over slide surface
Differential efficiency of scanning in each channel.
Such biases have consequences: • Plotting the frequency of un-normalized intensities reveals the differential effect between the two c hannels.
How do we deal with this? Normalization: In general, an assumption is made that the average gene does not change. You must understand your experiment and data to judge whether that assumption is a good one. Usually true for gene expression experiments, but not necessarily for a. CGH or chromatin IP. Generally true for large arrays, but not for small " boutique" arrays.
Normalization : The R-I Plot • • • Data may have an intensity-dependent structure. Plot log 2(R/G) vs. log 10(R*G) to reveal this Reveals : variance in log ratios is greater at lower intensities. distribution may not be centered around zero.
Normalization: Loess log 2(R/G) R-I Plot R-IFollowing Plot, Raw Loess Data log 10(R*G)
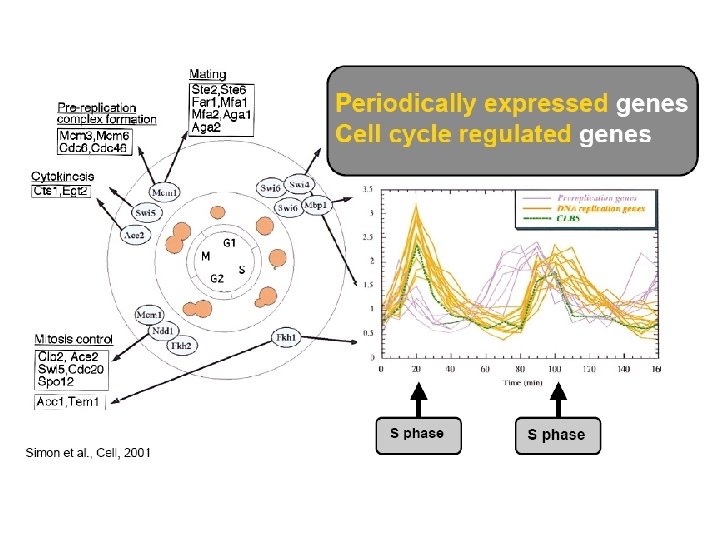
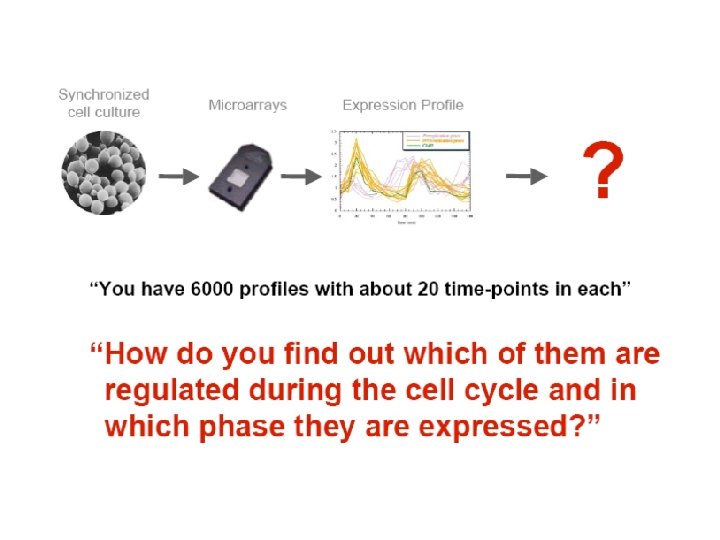
Cluster Analysis • Cell Cycle example( Spellman 1988)
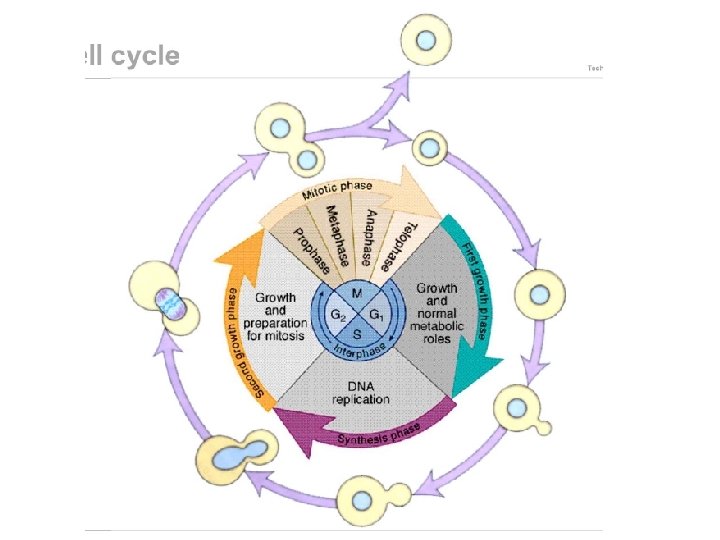
Overview of the Cell Cycle • Purpose: – To create two new cells by dividing one original cell
Cell Cycle: Key Concepts – All parts of original cell must be replicated and split between new cells – Each step must occur in precise manner and timing for successful cycle, and is strictly regulated – m. RNA and proteins for cell cycle genes are found at varying levels at different points of the cycle – Mutations causing malfunction in regulation can result in cancer
Yeast Cell Cycle
Cell Cycle: Basic Description http: //www. bmb. psu. edu/courses/biotc 489/notes/cycle. jpg
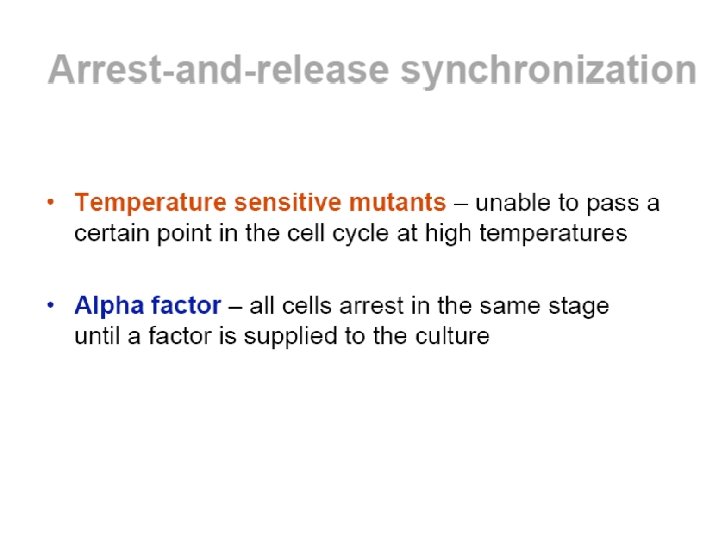
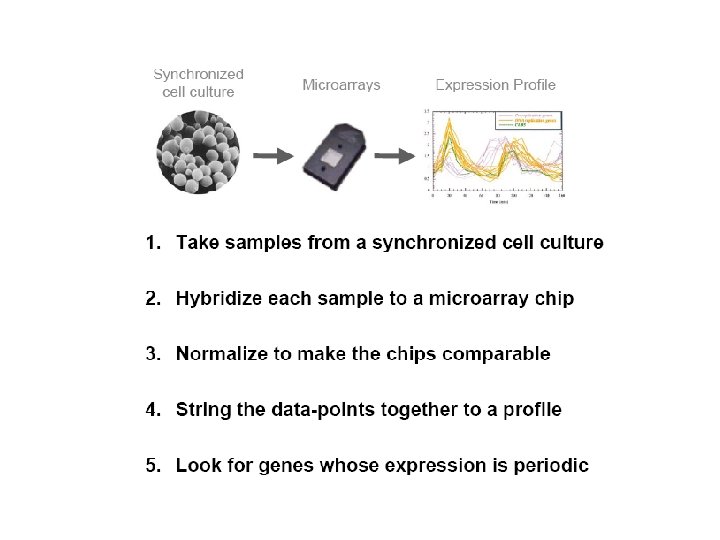
Cells grow out of synchrony.