DIVIDENDS JUST THE FACTS Dividends are sticky First


- Slides: 16
DIVIDENDS: JUST THE FACTS! Dividends are sticky.
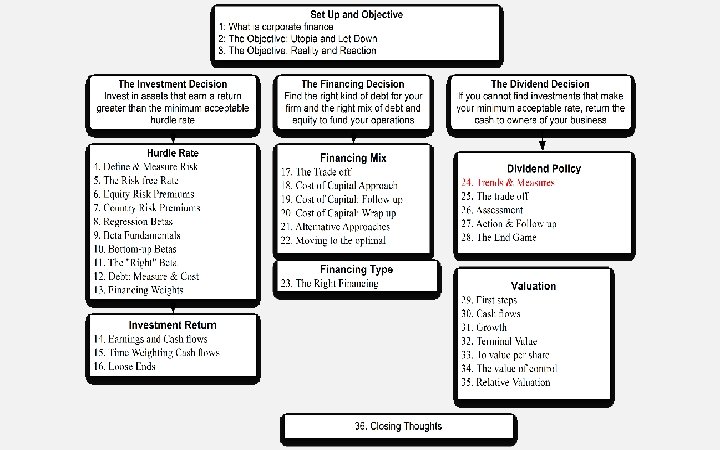
First Principles 3
Steps to the Dividend Decision… 4
I. Dividends are sticky Dividend Changes at US companies 80. 00% 70. 00% 60. 00% 50. 00% Increase 40. 00% Decrease 30. 00% No change 20. 00% 10. 00% 95 19 96 19 97 19 98 19 99 20 00 20 01 20 02 20 03 20 04 20 05 20 06 20 07 20 08 20 09 20 10 20 11 20 12 20 13 20 14 20 15 20 16 94 19 93 19 92 19 91 19 90 19 89 19 19 19 88 0. 00% 5
50. 00% 80 40. 00% 60 30. 00% 40 Earnings/Dividends II. Dividends tend to follow earnings S&P 500: Dividends and Earnings - 1960 to 2016 80. 00% 120 70. 00% 100 60. 00% 20. 00% 10. 00% 20 0. 00% 0 2016 2015 2014 2013 2012 2011 2010 2009 2008 2007 2006 2005 2004 2003 2002 2001 2000 1999 1998 1997 1996 1995 1994 1993 1992 1991 1990 1989 1988 1987 1986 1985 1984 1983 1982 1981 1980 1979 1978 1977 1976 1975 1974 1973 1972 1971 1970 1969 1968 1967 1966 1965 1964 1963 1962 1961 1960 Payout Ratio Dividends Earnings 6
II. Are affected by tax laws… In 2003 In the last quarter of 2012 As the possibility of tax rates reverting back to pre-2003 levels rose, 233 companies paid out $31 billion in dividends. Of these companies, 101 had insider holdings in excess of 20% of the outstanding stock.
IV. More and more firms are buying back stock, rather than pay dividends. . . Stock Buybacks Dividends 2016 2015 2014 2013 2012 2011 2010 2009 2008 2007 2006 2005 0 2004 Proportion of cash from buybacks 10. 00% 2003 100 2002 20. 00% 2001 2000 30. 00% 1999 300 1998 40. 00% 1997 400 1996 50. 00% 1995 500 1994 60. 00% 1993 600 1992 70. 00% 1991 700 1990 80. 00% 1989 800 1988 Dividends and Buybacks (in billions) Dividends and Buybacks - US Companies 0. 00% Proportion from Buybacks 8
V. And there are differences across countries… 9
Measures of Dividend Policy Dividend Payout = Dividends/ Net Income Measures the percentage of earnings that the company pays in dividends If the net income is negative, the payout ratio cannot be computed. Dividend Yield = Dividends per share/ Stock price Measures the return that an investor can make from dividends alone B DES Page 3 Becomes part of the expected return on the investment. PB Page 41 -43 10
Dividend Payout Ratios at the start of 2017: US and Global Firms 18. 00% 16. 00% 14. 00% 12. 00% 10. 00% 8. 00% 6. 00% 4. 00% 2. 00% 0. 00% <10% 10 -20% 20 -30% 30 -40% 40 -50% 50 -60% US 60 -70% 70 -80% 80 -90% 90 -100% >100% Global 11
Dividend Yields at the start of 2017: US & Global 16. 00% 14. 00% 12. 00% 10. 00% 8. 00% 6. 00% 4. 00% 2. 00% 0. 00% <. 5% . 5 -1% 1 -1. 5% 1. 5 -2% 2 -2. 5% 2. 5 -3% 3 -3. 5% 3. 5 -4% US 4 -4. 5% 4. 5 -5% 5 -5. 5% 5. 5 -6% 6 -6. 5% 6. 5 -7% 7 -7. 5% 7. 5 -8% >8% Global 12
Dividend Yields and Payout Ratios: Growth Classes Dividend Yields and Payout Ratios: By Growth Class 50. 00% 45. 00% 3. 50% 40. 00% 35. 00% 2. 50% 30. 00% 25. 00% 2. 00% Dividend Payout ratio Dividend Yield 20. 00% 1. 50% 15. 00% 10. 00% 0. 50% 5. 00% 0 -3% 3 -5% 5 -10% 10 -15% 15 -20% 20 -25% >25% 14
Dividend Policy: Disney et al. 15
Task Evaluate how much your company has paid out in dividends, relative to earnings & market cap 16 Read Chapter 10