Diverse Conversations Experiences NSSE Data Conversations Agenda Introduction


 26% overall response")


 14% 16%")


 • Participant identified barriers to inclusion of diverse perspectives in courses:")
 • Participant identified recommendations to inclusion of diverse perspectives in courses:")


")


 “Total Minority” Mahoning* 80.")


")

- Slides: 32
Diverse Conversations & Experiences NSSE Data Conversations
Agenda • Introduction to NSSE & Data • Student Interactions: Who do our students talk to? • Institutional Emphasis: How do students perceive YSU to support diverse and global perspectives? • Course Content: Does YSU coursework promote nondominant & counternarrative perspectives? • Connected Learning: Do our students demonstrate reflective & integrative learning? • Graduation Rate – Black Students (YSU versus Peers) • Discussion & Recommendations
YSU Mission • Mission Statement – “collaboration to enrich the region and the world” – “diverse educational experiences” – “fosters understanding of diversity, sustainability, and global perspectives” – “advances the intellectual and cultural life of the city, region, and world” • Core Values – “strive to foster an appreciation of, and respect for, differences among the human race; and celebrate diversity that enriches the University and the world” – “bring about the greater good of the collective whole”
NSSE • • Student engagement First-Year and Senior students (Spring 2016) 26% overall response rate Benchmarked against “True Peers” YSU NSSE Overview Webinar: http: //cms. ysu. edu/administrative-offices/assessment/nsse-2016
Topical Module: Global Learning • Questions focus on student experience/coursework in global affairs, world cultures, nationalities, religion, and other international topics • Complements main NSSE questionnaire: • student’s experiences with people who are different than them • reflective & integrative learning • participation in study abroad • Offered to first-year and senior students • 64 participating schools (3 peer institutions)
YSU’s PEER Comparison Group Carnegie Classification Pell Recipient % Part-Time Enrollment % Instructional Expenditures per FTE Undergraduate Enrollment ACT Scores of Incoming Students Living On-campus % First Generation % Total Enrollment Spent Budget on Research % Austin Peay State University California State University, Fresno California State University-Chico Cleveland State University Eastern Michigan University Indiana University. Purdue University Fort Wayne Jacksonville State University Kean University Lamar University Mc. Neese State University Middle Tennessee State University Northeastern State University Northern Kentucky University Sam Houston State University Southeastern Louisiana University Southern Oregon University Texas A&M University – Commerce Texas A&M University – Corpus Christi The University of Texas at Tyler University of Akron University of Central Oklahoma University of Memphis University of Michigan-Flint
Respondent Characteristics First Year Seniors % Students of Color (YSU = 19%) 14% 16% % LGBTQIA Identifying 8% 8% % Students aged 24 & older 3% 21% % Living in Campus Housing (YSU = 11%) 22% 5% % First-Generation 55% 59%
Who do our students talk to?
Discussions with Diverse Others Question: During the current school year, about how often have you had discussions with people from the following groups? YSU First-Year Peer First-Year 2, 9 Different Political Views Different Religious Beliefs* 2, 8 Different Race/Ethnicity* 2, 8 Peer Senior 3, 1 Different Political Views 3 3 Different Religious Beliefs 3 3 3 Different Economic Background 2, 7 Different Economic Background* 4 point scale YSU Senior 3, 1 Different Race/Ethnicity* 3, 1 3 * Statistically significant lower mean score from peer group 3, 2
Discussions with Diverse Others Question: During the current school year, about how often have you had discussions with people from the following groups? YSU First-Year YSU Senior NEVER talked to people of a race or ethnicity 10% 4% NEVER talked to people from an economic 8% 4% NEVER talked to people with religious beliefs 11% 6% NEVER talked to people with political views 7% 5% other than your own background other than your own
How do students perceive YSU to support diverse and global perspectives?
Institutional Emphasis How much does your institution emphasize the following? First-Year % “Quite a Bit” or “Very Much” Senior % “Quite a Bit” or “Very Much” Providing courses that focus on global and international topics YSU 37% Module 54% YSU 34% Module 54% Providing activities and experiences (speakers, events) that focus on global and international topics YSU 46% Module 60% YSU 45% Module 54% Encouraging contact among students from different backgrounds YSU 37% Peers 54% Attending events that address important social economic or political issues YSU 46% Peers 60% *Module = Comparison to all 64 Global Learning Module Schools; Peer = Comparison to selected 23 Peer Institutions
Activities with a Global Focus During the current school year, about how often have you done the following? First-Year Senior Discussed international or global topics and issues with others 25% 21% Talked about international opportunities (study abroad, international internship, Model UN, field study or research abroad, etc. ) with a faculty member or advisor 51% 55% Attended events or activities that promoted the understanding of different world cultures, nationalities, and religions 57% 54% Worked on out-of-class activities (campus events, committees, student groups, etc. ) with an international or global focus 67% 65% Participated in a program that pairs U. S. and international students (language partners, buddy program, etc. ) 77% 81% % of Students Answering “NEVER”
Does YSU coursework promote non-dominant & counternarrative perspectives?
Course Work During the current school year, how much has your coursework encouraged you to do the following? First-Year % “Quite a Bit” or “Very Much” Senior % “Quite a Bit” or “Very Much” Understand the viewpoints, values, or customs of different world cultures, nationalities, and religions YSU 41% Module 55% YSU 46% Module 61% Develop skills for interacting effectively and appropriately with those from different world cultures, nationalities, and religions YSU 40% Module 52% YSU 45% Module 59%
Exploring Course & Program Level Inclusion of Diverse & Global Perspectives in Teaching & Learning • Partnership between Provost’s Office, Office of Assessment, & Navarro Fellow • 10 volunteer faculty participants from 6 colleges participated in semi-structured interviews around diversity, inclusion, and equity in teaching & learning • ALL participants agree on the importance of including diverse and global perspectives in courses
Results (in process) • Participant identified barriers to inclusion of diverse perspectives in courses: – Regional influence • Coded language (“urban, ” “poverty, ” “those people”) • Students lack of familiarly with places outside the Mahoning Valley – – – Lack of diversity in student population Time constraints Lack of meaningful training opportunities Resource constraints Balancing the responsibility of informally mentoring Students of Color and the responsibilities that are valued by the tenure process (specific to Faculty of Color)
Results (in process) • Participant identified recommendations to inclusion of diverse perspectives in courses: – Top-down prioritization – Meaningful training & resources • Identification of “experts” on campus – Increased diversity in faculty hiring processes – Increased diversity in student body through intentional strategies for the recruitment & retention of Students of Color – Audit & possible revision of the General Education curriculum
Do our students demonstrate reflective & integrative learning?
Reflective & Integrative Learning YSU First. Year Peer First. Year YSU Seniors Peer Seniors Connected your learning to societal problems or issues 44%* 49% 60% 62% Included diverse perspectives (political, religious, racial/ethnic, gender, etc. ) in course discussions or assignments 42%* 49% 50% 52% Examined the strengths and weaknesses of your own views on a topic or issue 58% 62% 66% 64% Tried to better understand someone else’s views by imagining how an issue looks from his or her perspective 64% 67% 73% 70% Used numerical information to examine a real-world problem (Quantitative Reasoning) 39% 38% 41% 45% During the current school year, about how often have you done the following? % of Students responding “Very Often” or “Often” * Statistically significant lower mean score from peer group
Service-Learning Question: About how many of your courses at this institution have included a community-based project (service-learning)? First-Year Students YSU True Peers Historical Peers NSSE 2015 & 2016 8% 56% 10% 36% 45% 10% 44% 47% 9% 44% 48% 100% Most or all YSU 16% True Peers 13% Historical Peers 14% NSSE 2015 & 2016 Some None 53% 31% 47% 40% 48% 12% Senior Students 39% 49% 39% 100% Most or all Some None
Service-Learning What the Research* says… Student outcomes include: What YSU students say… YSU prepared me [senior students] “Quite a Bit” or “Very Much” to: • Increase in civic identity & awareness of civic issues • Be an informed and active citizen – 51% • Connection with individuals and communities • Understand how your actions affect global communities– 22% • Increased understanding of community diversity • Understand people of other backgrounds – 61% *Weiss & Fornacht, 2016; Carilio & Mathiesen, 2006; Malmgren, 2008; Teranishi, 2008; Astin et al, 2000
Overall Perceived Gains Question: How much has your experience at this institution contributed to your knowledge, skills, and personal development in the following areas? % Responding Very Little FY Senior Speaking a second language 78% 71% Seeking international or global opportunities out of your comfort zone 61% 59% Understanding how your actions affect global communities 48% 45% Encouraging your sense of global responsibility 37% 36% Preparing for life and work in an increasingly globalized era 34% 35% Being informed about current international and global issues 28% 31% Being an informed and active citizen 15% Solving complex real-world problems 15% 11% Developing or clarifying a personal code of values and ethics 13% Understanding people of other backgrounds 13% 12%
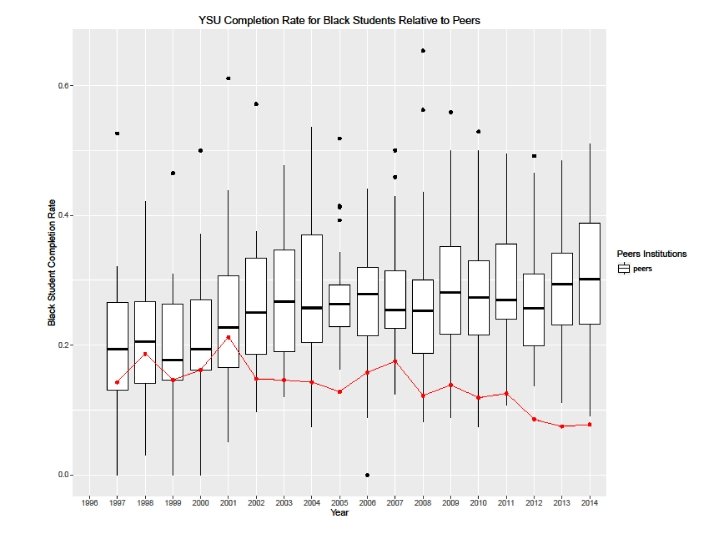
Graduation Rate Black Students (YSU versus Peers)
30. 24% gap between the 6 -year completion rate of Black students and White students at YSU
Peer Schools with Less than 10% Gap Between White & Black Student 6 -Year Graduation Rates Gap Ordered by Similarity to YSU based on distance analysis – see Peer Schools slide for factors Student Body % Minoritized* 30. 2% Youngstown State University 19% 8. 8% Austin Peay State University (Clarksville, TN) 33% 3% Sam Houston State University (Huntsville, TX) 43% . 1% Middle Tennessee State University (Murfreesboro) 33% 2. 4% Northeastern State University (Tahlequah, OK) 47% Texas A & M University – Corpus Christi 61% 7. 7% Columbus State University (Columbus, GA) 47% 3. 8% Northwestern State University of Louisiana (Natchitoches) 42% 1. 6% Texas A & M University – Commerce 49% 9. 1% University of Central Oklahoma (Edmond) 39% -1. 1% The University of Texas at Tyler 38% 9. 7% San Francisco State University 66% 7% * College Scorecard Data accessed April 2017 – Includes Black, Hispanic, Asian, Non-resident alien, Two or more races, Native Hawaiian/Pacific Islander, & American Indiana/Alaska Native categories
Surrounding County Racial/Ethic Makeup White Black Latino/a/x (of any race) “Total Minority” Mahoning* 80. 4% 15. 4% 5% 22. 9% Trumbull 88. 9% 8. 4% 1. 5% 12. 2% Columbiana 95. 4% 2. 2% 1. 4% 5. 5% Stark 88. 8% 7. 1% 1. 8% 12. 6% Portage 91. 8% 4% 1. 5% 9. 3% * City of Youngstown: 47% White, 45. 2% Black, 9. 3% Latino/a/x (of any race) White Black Latino/a/x (of any race) “Total Minority” Cuyahoga 63. 8% 29. 6% 5. 1% 39. 3% Summit 80. 2% 14. 3% 1. 8% 21. 0% https: //development. ohio. gov/reports_countytrends_map. htm
Example: Georgia State • 2003 - Georgia State recognized a problem with a 32% overall graduation rate (22% for Latino/a/x students, 29% for Black students). • Institutuional commitment to address the problem: – Proactive Advising – complete overhaul of advising system using predictive analytics – Expansion of existing high-impact programs (e. g. first -year learning communities) – Increase of scholarship dollars – Piloting innovative new types of financial interventions (mini-grants that filled gaps in aid) * 2015 Status Report Georgia State University, Complete College Georgia
Example: Georgia State • Approach: – “Use data aggressively in order to identify and to understand the most pervasive obstacles to our students’ progressions and completion. – Be willing to address the problems by becoming an early adopter. This means piloting new strategies and experimenting with new technologies. After all, we will not solve decades-old problems by the same old means. – Track the impacts of the new interventions via data and make adjustments as necessary to improve results. – Scale the initiatives that prove effective to have maximal impact. In fact, many of the programs that we offer are currently touching 10, 000 students or more annually. ” * 2015 Status Report Georgia State University, Complete College Georgia (p. 10)
Results: Georgia State* 2003 2011 2015 6 Year Graduation Rate 32% 48% (2, 982) 54% (4, 788) 6 -Year: Black Student Graduation Rate 29% 51% (1, 300) 58% (1, 829) 6 -Year: White Student Graduation Rate - 46% (1, 808) 50% (1, 855) 6 -Year: Latino/a/x Student Graduation Rate 22% 58% (288) 58% (435) 6 -Year: Pell Eligible Student Graduation Rate - 51% (2, 015) 55% (2, 912) Read the full report: http: //faculty. gsu. edu/files/2017/02/Georgia-State-University 2016 -CCG-Report-with-Appendix-10 -26 -16. pdf
Discussion & Recommendations After seeing this data and knowing the context: 1. How do you envision YSU fulfilling our mission statement and core values? 2. What recommendations for practice do you have? 3. How can we better serve all students at YSU?