Diuresis Objectives To measure the volume and determine

Diuresis

Objectives � To measure the volume and determine the composition of urine excreted by 4 groups of volunteers, as follows: ◦ ◦ Control. Drinking one liter of water. Drinking one liter of normal saline. Taking lasix (a diuretic) 40 mg. � To explain the mechanisms behind the different data.

Cont. M & M • Control…. . Nothing. • Water…. drink 1 L water. • Saline…drink 1 L saline. • Lasix…. . take 20 mg lasix. 11 am Empty bladder 1 pm 1: 30 pm 2: 30 pm Empty Bladder (1 st sample) 2 nd sampl e 3 rd sampl e 4 th sampl e • Urine volume, osmolality, and p. H. 3 pm 5 th sampl e

Recording and Analysis of Data � Record the data obtained for each sample in the tables provided. ◦ ◦ ◦ � Urine volume. Osmolality. p. H. [Na+] [K+] Calculate: ◦ Flow rate. ◦ Na excretion. ◦ Total Na excretion Sample no 1 2 3 4 Time 10 am 10. 30 am 11. 30 am Duration (min) 120 30 30 30 Volume (ml) 102 Flow rate (ml/min) 0. 85 Na+ Conc. (mmol/L) 132 Total Na+excretion (mmol Rate of Na+ excretion (μmol/min)
. Sodium excretion(mmoles) = Na")
Calculations � Urine � � flow rate = Volume/time (ml/min). Sodium excretion(mmoles) = Na conc. × Volume of Urine 1000 ◦ Urine Na conc. (mmol/L). ◦ Flow rate (ml/min). ◦ Volume of Urine (ml) ◦ Sodium excretion rate (µmol/ml) =Sodium conc. XVolume of Urine ◦ Time

Sample no 1 2 3 4 Time 10 am 11 am 12 am 1 pm Duration (min) 120 60 60 60 Volume (ml) 102 58 Flow rate (ml/min) 0. 85 ? Na+ Conc. (mmol/L) 132 107 Total + Na excretion (mmol 13. 5 ? Rate of Na+ excretion (μmol/min) 112. 2 ?
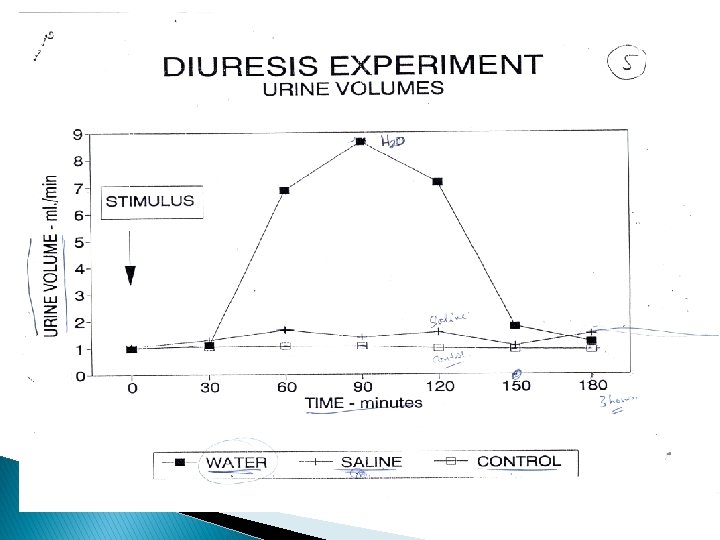
 Urine Flow Rate 9 8 7")
Plotting of Data (e. g. drink water ) Urine Flow Rate 9 8 7 Urine flow rate (ml/min) 6 5 4 3 2 1 0 10 0. 4375000001 0. 458333333 Time 0. 4791666668 12
 100 80 60 40 20 0 10")
Sodium Concentration 140 120 Na concentration (mmol/L) 100 80 60 40 20 0 10 0. 4375000001 0. 458333333 Time 0. 4791666668 12

urine osomality 300 250 urine osomality 200 150 urine osomality 100 50 0 1 st sample 2 nd sample 3 rd sample 4 th sample 5 th sample

Explanation of mechanisms Comparison among the groups

Deprive of H 2 O 1 � Plasma Osmolarity 2 3 Thirst 3 H 2 O drinking 4 5 a Plsma Osmolarity Toward Normal 6 Stimulates Osmoreceptors in anterior hypothalamus ADH secretion from posterior pituitary H 2 O permeability in late distal tubule and collecting duct H 2 O reabsorption 5 b Urine osmolarity and volume urine

Drink H 2 O 2 3 m 1 Plasma Osmolarity and Volume Inhibits osmoreceptors in anterior hypothalamus Thirst 3 H 2 O drinking 4 5 a Plasma osmolarity toward Normal 5 b ADH secretion from posterior pituitary H 2 O permeability in late distal tubule and collecting duct H 2 O reabsorption and excretion Urine Osmolarity and 6 urine volume
 1 liter Volume of E. C. F. Osmolality")
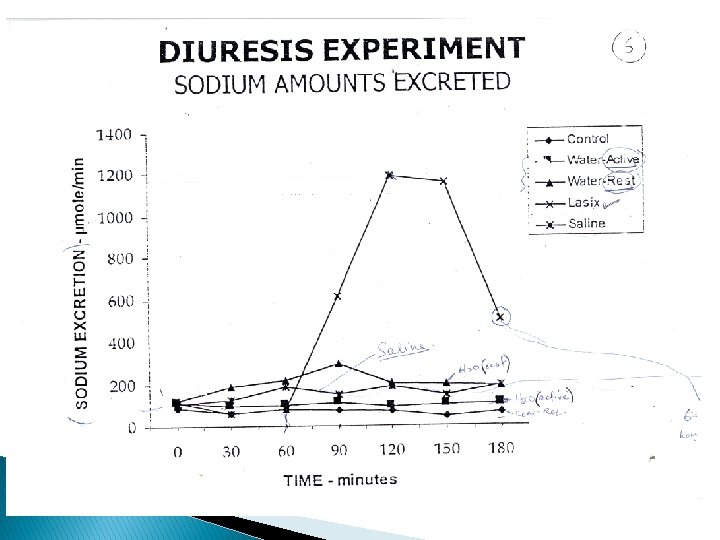
Dieresis Experiment Isotonic Saline (0. 9%) 1 liter Volume of E. C. F. Osmolality same (as isotonic saline) ( total solute amount Stretch on right atrium (volume receptors in right atrium) ANP (Atrial Natriuretic peptide Na excretion by Kidneys

ANP Action � Increase in Blood flow to kidneys (due to relaxation of smooth muscles of blood vessels) � Increase in GFR � Increase in Na loss in urine � Decrease in Aldosterone in Na reabsorption in DCT (increase in Na loss in urine)
 (40 mg) with 25 ml of water")
Dieresis experiment 1 tab of Lasix (furosemide) (40 mg) with 25 ml of water Action starts 1 -2 hours and lasts for 4 -6 hours (1/2 life of furosemide is 6 hr) Acts on thick asending limb of loop of Henle and blocks the Na-K-2 Cl co-transport (called loop diuretic Na exrection in urine and water excretion (osmotic drag) m �

Thank You �
- Slides: 18