Disturbi cognitivi e Sclerosi Multipla Emilio Portaccio Fondazione

Disturbi cognitivi e Sclerosi Multipla Emilio Portaccio Fondazione Don Carlo Gnocchi Firenze

Outline Prevalence and neuropsychological profile Clinical correlates MRI correlates Assessment Treatment

Outline Prevalence and neuropsychological profile Clinical correlates MRI correlates Assessment Treatment

Outline Prevalence and neuropsychological profile Clinical correlates MRI correlates Assessment Treatment

Variables that can influence prevalence rates o Study setting o clinic-based versus community-based o Study epoch o Poser’s versus Mac. Donald’s criteria o Study sample o demographic and clinical characteristics o Assessment tools o Single test o Brief /intermediate/extensive batteries o Computerized batteries o Criteria for defining CI

Prevalence of CI in the MS Population ◦ Prevalence range: 40 -65% Nearly 40% in community-based studies > 65% in clinic-based studies Review article: Chiaravalloti ND, De. Luca J. Lancet Neurol 2008

Percentage of MS group scoring <5 th percentile for healthy controls Prevalence of impairment by cognitive domain Community-based study: 100 MS pts. versus 100 HCs, extensive NP battery Prevalence of CI in the MS sample 43%, (weak) correlation with EDSS 35% 30% 25% 20% 15% 22– 31% 10% 13– 19% 5% 0% 22– 25% Episodic Memory 12– 19% Information Verbal fluency Visual-spatial Processing Conceptual Abilities Speed Reasoning & Working Memory 8– 9% 7– 8% Language Simple Attention Adapted from Rao et al. Neurology, 1991


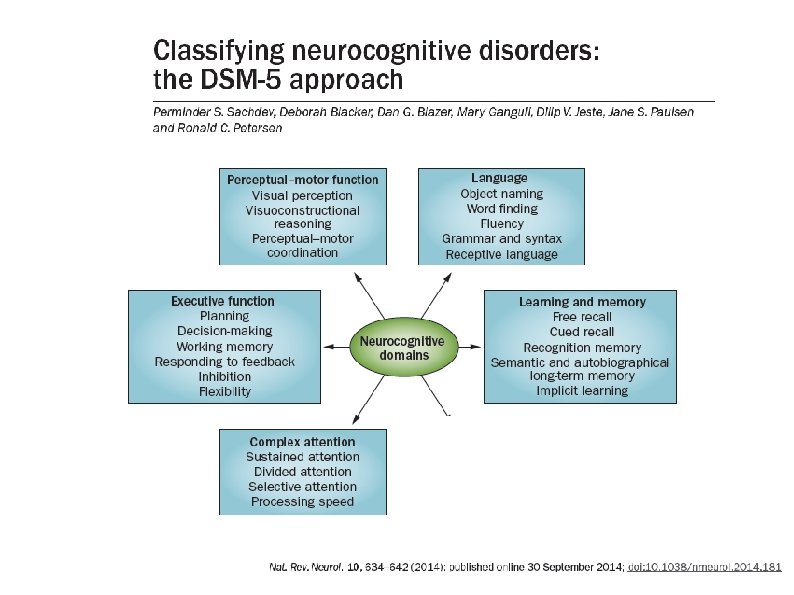
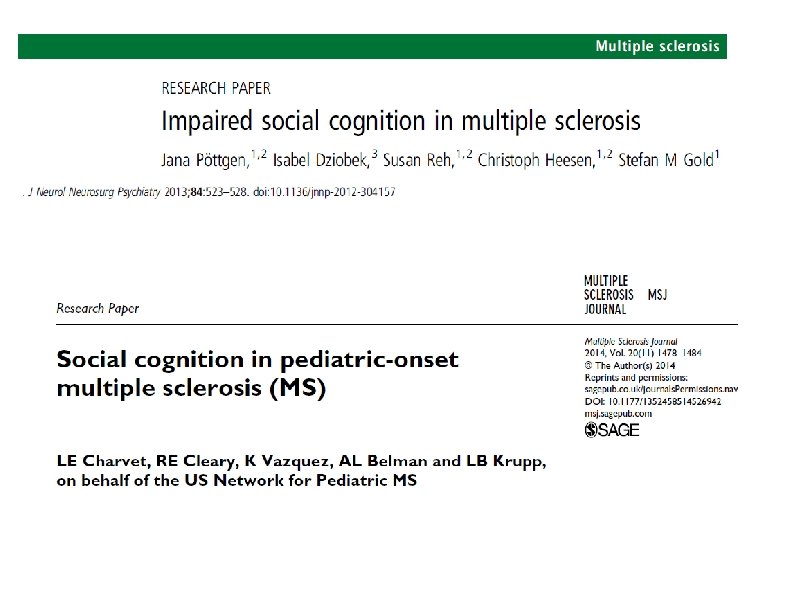
• The means by which we perceive, process and interpret social information • Linked to poor quality of life, mental health problems, unemployment and loneliness


Mean age 39, 9 years; Median disease duration 8 years; Median EDSS 2, 3; RR course 77%

61, 7% 52, 8%


Outline Prevalence and neuropsychological profile Clinical correlates MRI correlates Assessment Treatment

Prevalence of CI in different MS subtypes CIS: range 14 -57% ― 25 -30%* Early RRMS (< 5 years): range 20 -60% ― 30 -40%* SPMS: range 37 -83% ― In most of the studies >60%* time PPMS: range 7 -87% ― In most of the recent studies >50%* o Comparing PP and SPMS, prevalence of CI in PPMS is reported to be inferior, comparable or superior to that reported in SPMS * Criterion for CI : > 2 tests failed, 1. 5 – 2. 0 SDs
 Cognitive performance was")
MINIMUS: an Italian collaborative study (Ruano et al. , MSJ 2017) Cognitive performance was assessed in 1040 patients using a battery validated for MS, the Rao’s Brief Repeatable Battery: Selective Reminding Test (SRT) Verbal and visuo-spatial learning 10/36 Spatial Recall Test (SPART) Paced Auditory Serial Addition Test (PASAT) IPS Symbol Digit Modalities Test (SDMT) Word List Generation (WLG) Stroop Test (ST) • Executive function Test failure was defined as a score ≤ 2 SDs, using Italian normative values adjusted for age, sex and education as reference. • Cognitive impairment was defined as impairment in ≥ 2 cognitive domains.

Clinical and demographic characteristics of the study sample Total CIS RR SP PP n=1040 n=167 n=759 n=114 n=40 Age (mean, years) 40. 1 33. 9 39. 9 51. 6 49. 3 <0. 001 Sex (% female) 67. 7 66. 5 69. 7 58. 1 52. 3 0. 015 12. 2 12. 7 12. 3 11. 0 10. 2 <0. 001 29. 7 32. 5 28. 6 32. 2 36. 4 <0. 001 10. 3 1. 4 11. 2 19. 4 12. 8 <0. 001 Relapses in the previous year (mean) 0. 9 1. 0 1. 3 0. 3 0. 0 <0. 001 EDSS (mean, years) 2. 6 1. 5 2. 4 5. 5 5. 1 <0. 001 Education (mean, years) Age at onset (mean, years) Disease duration (mean, years) * Student’s t test for independent samples or χ2 test adjusted for multiple comparisons p-value*

Frequency of Cognitive Impairment Prevalence of cognitive impairment by clinical subtype n= 167 n=759 n=74 n=44 Significant differences: CIS vs. SP, CIS vs. PP, RR vs. SP and RR vs. PP (p<0. 001, χ2 test adjusted for multiple comparisons) n=1040
 OR=1. 75 [1.")
Frequency of Cognitive Impairment Cognitive impairment by age group (all patients) OR=1. 75 [1. 54; 2. 00] p-value<0. 001 Patient age (years)
 OR=1. 99 [1.")
Frequency of Cognitive Impairment Cognitive impairment by disability level (all patients) OR=1. 99 [1. 68; 2. 36] p-value<0. 001 EDSS score

Multivariate logistic regression model for cognitive impairment in MS Crude OR Adjusted OR [95% CI] p-value (multivariate) Age (10 years) 1. 75 [1. 54; 2. 00] 1. 62 [1. 42; 1. 86] <0. 001 EDSS (2 points) 1. 99 [1. 68; 2. 36]* 1. 80 [1. 51; 2. 15] <0. 001 Sex (female) 1. 08 [0. 82; 1. 43] 1. 10 [0. 81; 1. 49] 0. 55 Fatigue (FSS) 1. 01 [1. 00; 1. 19] 1. 00 [0. 99; 1. 02] 0. 32 Depression (MADRS) 1. 02 [1. 00; 1. 15] 1. 00 [0. 98; 1. 03] 0. 84 Disease duration (10 years) 1. 68 [1. 44; 1. 97] 1. 01 [0. 99; 1. 03] 0. 47 Variables not in the model Clinical course 0. 30 CIS vs. RR 1. 84 [1. 26; 2. 71] 1. 10 [0. 75; 1. 63] 0. 63 CIS vs. SP 4. 80 [2. 57; 9. 01] 1. 42 [0. 69; 2. 92] 0. 35 CIS vs. PP 13. 11 [3. 05; 56. 04] 3. 64 [0. 80; 16. 57] 0. 10

Multivariate logistic regression model for cognitive impairment and for each cognitive domain p-value Cognitive impairment OR [95% CI] <0. 001 1. 62 [1. 42; 1. 86] EDSS (2 points) <0. 001 1. 80 [1. 51; 2. 15] <0. 001 1. 56 [1. 37; 1. 78] Age (10 years) p-value IPS/WM Age (10 years) Verbal learning OR [95% CI] Age (10 years) <0. 001 1. 50 [1. 32; 1. 70] EDSS (2 points) <0. 001 1. 54 [1. 30; 1. 82] Executive function Age (10 years) 0. 007 1. 22 [1. 06; 1. 41] EDSS (2 points) <0. 001 1. 59 [1. 28; 1. 56] Sex (female) <0. 001 1. 99 [1. 43; 2. 77] Clinical course <0. 001 CIS vs. RR 0. 002 1. 84 [1. 26; 2. 71] EDSS (2 points) <0. 001 1. 44 [1. 22; 1. 70] Sex (female) 0. 002 0. 63 [0. 47; 0. 85] Age (10 years) 0. 013 1. 47 [1. 23; 1. 76] RR vs. SP 0. 010 2. 64 [1. 27; 5. 50] EDSS (2 points) <0. 001 1. 32 [1. 14; 1. 53] RR vs. PP 0. 012 14. 46 [1. 74; 116. 97] Visuospatial learning Variable selection was performed using stepwise likelihood ratio method.

• • Study design: cross-sectional, mono-centric Assessment through a computerized tool, the Mindstream GAB (Neuro. Trax Corp. , Bellaire, • 1500 MS patients TX, USA) • In a cluster analysis, CIS and RR patients and, respectively, SP and PP patients had a similar cognitive pattern • Predictors of worse cognitive performance (linear regression): • Older age • Higher EDSS score • Longer disease duration • Sharper decline after 5 years from onset Achiron et al. , Plos. One 2013

Cognitive performance as a function of MS duration Cognitive impairment was evident only at five years from onset suggesting a therapeutic window during which patients may benefit from intervetions to maintain cognitive health Achiron et al. , Plos. One 2013

JNNP 2011 CI at baseline 29% CI after 5 years 54%

A 10 -year longitudinal study Amato et al. Arch Neurol. 1995, 2001 50 patients with early MS (untreated) compared with 70 HCs Study onset 10 years 4. 5 years CI= 26% Predictors of a worse cognitive outcome after 10 years: • Older age • Higher EDSS • Shift from RRMS to SPMS CI 49% CI 56% No impairment (0 -2 failed subtests) Mild impairment (3 -5 failed subtests) Moderate impairment (>5 failed subtests)

RIS None of the RIS had a strictly normal cognitive function and 10/26 failed at least 1 test (PASAT or Digit Span) «It could be suggested that these patients are MS patients with an undiagnosed isolated symptom presenting as cognitive dysfunction»
 (Amato et al. , Neurology 2012) Rao’s battery")
CI in Radiologically Isolated Syndrome (RIS) (Amato et al. , Neurology 2012) Rao’s battery

Cognitive impairment in “Benign MS” 163 patients with “benign” MS (disease duration >15 years and EDSS <3. 0): • 45% cognitive impairment • 49% fatigue • 54% depression In 38% of cases, cognitively impaired patients had reduced their social and work activities measured on the Environmental Status Scale (ESS) A reliable definition of BMS should include the preservation of cognitive functioning as an additional requisite (Rovaris et al. , Neurology 2008)

CI in «BMS» is associated with MRI metrics and may have a prognostic role Cognitive impairment in «benign» MS is associated with Greater T 1 lesion loads in the WM More pronunced cortical tissue changes (reduced volumes, total and regional MTR values) Higher risk of progression to a no longer benign status after 5 years Results confirmed in a 12 -year follow-up (unpublished data) Amato et al. , 2008, Portaccio et al. , 2009

CI: a factor in prognosis - Longitudinal studies • In CIS subjects CI predicted more rapid conversion to CDMS after a 3 year follow -up (Zipoli et al. Mult Scler 2010) • In early RRMS patients (mean duration at baseline 23 months) baseline IPS and verbal memory impairments predicted higher EDSS score after 5 and 7 years (Deloire et al. , Mult Scler 2010) • In newly diagnosed MS patients CI predicted faster progression to EDSS 4 and shift to SPMS in a 10 -year follo-up (Moccia et al. , Mult Scler 2015) Implications for therapeutic conduct?

A «cortical variant» of MS? Clinica findings • prominent cognitive and/or psychiatric disorders at presentation • most often PP course • Positive CSF OB Neuropsychological findings Severe cognitive deficits, sometimes with a «cortical pattern» (aphasia, apraxia) MRI findings • both discrete and confluent, diffuse WM abnormalities • severe brain atrophy at presentation • higher reduction of GM fraction compared with WM fraction • high number of CLs with DIR
 Study Region")
CI in pediatric onset MS (Amato et al, Neurology 2016 Suppl 2) Study Region MS/HC Definition of CI % CI Major areas of impairment (>20% of MS pts. ) Mac. Allister 2005 U. S. MS 37 > 2 test scores >1. 5 SDs below normative data 35. 1% Complex attention, Verbal memory [Naming 18. 9%] Amato 2008 Italy, multicenter MS 63 HC 63 performance on > 3 tests < 5 th percentile of HC performance 31% Verbal and visual memory Complex attention, Executive functions, Expressive and receptive language IQ reduced in 8% (younger age at onset) Till 2011 Canada MS 35 HC 33 ≥ 3 test scores <1. 5 SDs below normative data 29. 4% Attention, IPS, Visuomotor integration, Verbal fluency, Spelling abilities Julian 2013 U. S. , multicenter ≥ 33% of test scores <1 SD below 35% normative data 18% MS 187 CIS 44 Fine motor speed, Visuomotor integration, IPS

Evolution of CI in pediatric onset MS: five-year follow-up (Amato Change in Cognitive Impairment Index et al, Neurology 2012) CCI Year 0 -5 (same versions of the tests): • 56. 3% presented deterioration • 25% improvement • 18. 7% stability Functions more prone to deteriorate: • visual spatial learning • verbal fluency • expressive language In the univariate analysis, CI was associated with: • younger age at MS onset • lower education

How do cognitive problems affect the lives of people with MS? Activity and Participation Safety Disease Employment Driving Medical decisions Relationships Falls Medication adherence Social function Rehabilitation benefit Daily activities Symptom management Physical independence Coping Leisure activities Risk appraisal Mood General Life satisfaction, Quality of Life Review article: Langdon DW, Curr Opin Neurol. 2011 Jun; 24(3): 244 -9.

What about Pediatric MS? Results of an interview with the parents (30 patients, 25 classified as having CI) • School activities Negative impact in 10 out of 30 cases (33%), all classified as having CI 3 cases had a teacher of support 7 cases had to repeat a year in school • Daily living activities Negative impact on hobbies and sport activities in 16 out of 30 cases (53%) 8 cases had to reduce or change their usual sport activities 8 cases had to quit sport activities altogether • Family and social relationships ─ Negative impact in 11 out of 30 cases (37%) (behavioural changes, anxiety, aggressiveness, isolation…) Amato et al. , Neurology 2012

Outline Prevalence and neuropsychological profile Clinical correlates MRI correlates Assessment Treatment

MRI correlates of CI • Role of t 1 and t 2 lesion volumes and location

MRI correlates of CI • Role of t 1 and t 2 lesion volumes and location • Damage in NAWM • Role of grey matter involvement


 matter – cortical volumes")
Cognitive impairment in MS: the grey (does) matter – cortical volumes
 matter – cortical volumes NC and MS")
Cognitive impairment in MS: the grey (does) matter – cortical volumes NC and MS subgroups 5 SIENA X ZNCV 0 ns -5 -10 Amato MP, et al Neurology 2004 -15 p=0. 02 NC MS Cognitively Preserved No significant difference in terms of whole brain volumes or lesion loads MS Cognitively Impaired

Amato MP, et al. Arch Neurol 2007
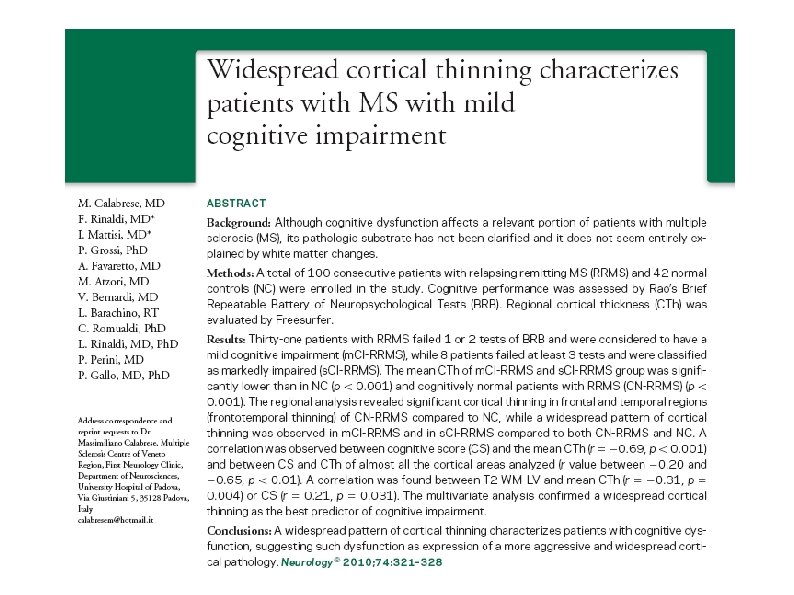

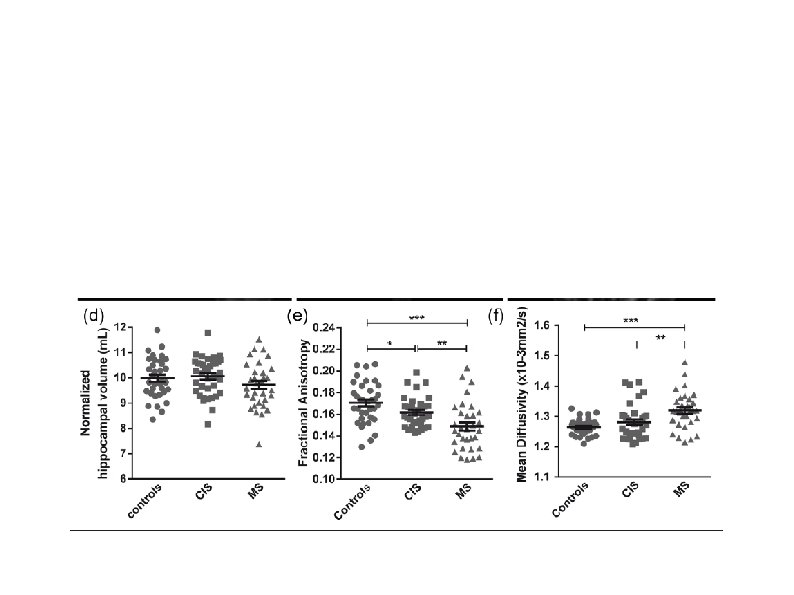
Cognitively preserved Cognitively impaired Healthy controls MS patients Calabrese M, et al Neurology 2010
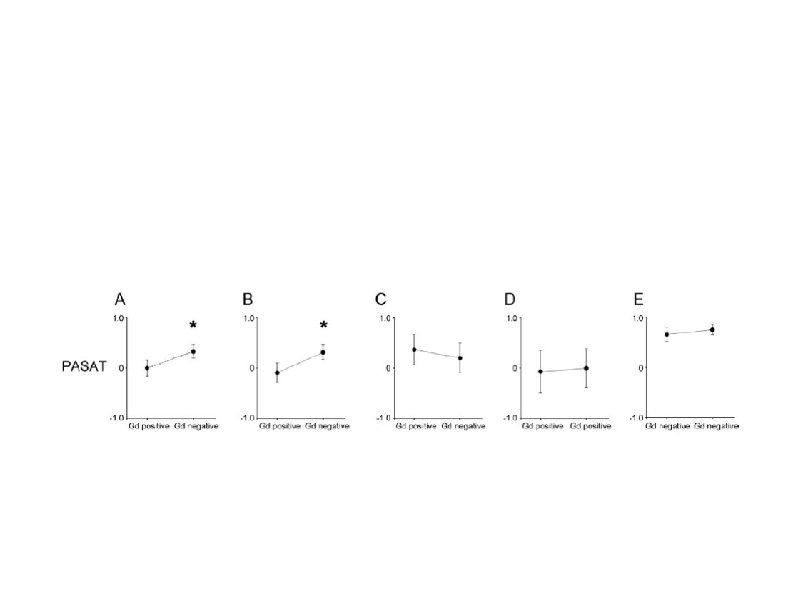
 PASAT")
NGMV was the strongest MRI predictor of: EDSS (OR: 0. 67; p<0. 001) PASAT (beta: 0. 19; p<0. 001)

In RIS subjects, the number of tests failed was related with Higher T 1 LV (rho=0. 526; p=0. 025) Lower NCV (rho=-0, 481; p=0, 043) Amato MP, et al. Neurology 2012
 matter – cortical lesions Calabrese M, et")
Cognitive impairment in MS: the grey (does) matter – cortical lesions Calabrese M, et al. Arch Neurol 2009

Calabrese M, et al. Arch Neurol 2009


Cortical lesions were found in 6 of 15 RIS subjects Giorgio A, et al. Neurology 2011

Minagar A, et al. Neurology 2013

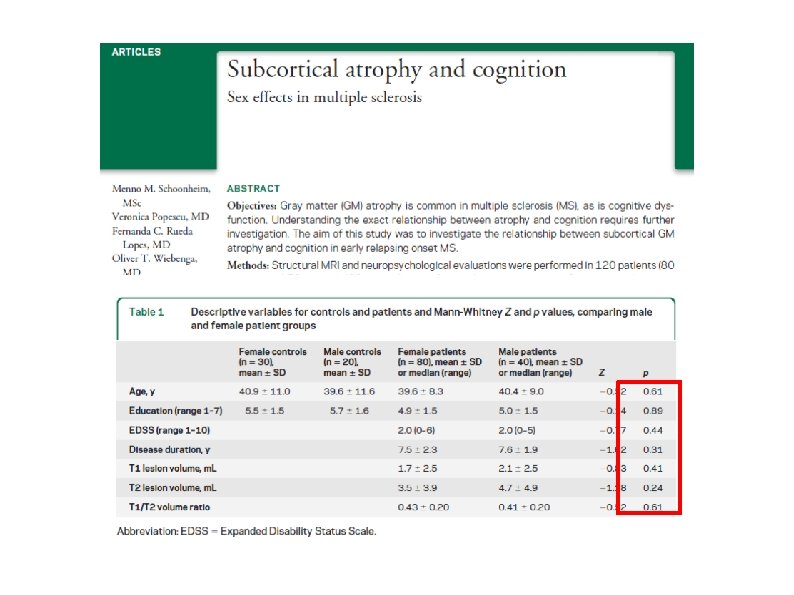
Houtchens MK, et al. Neurology 2007

Houtchens MK, et al. Neurology 2007


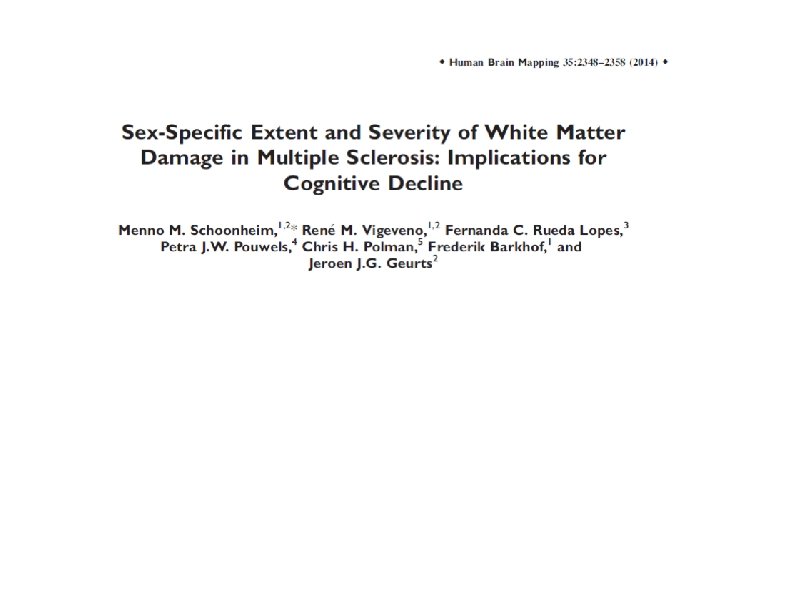

MEN WOMEN

Significant correlations only in men

WOMEN

«…most evident when attempts to correlate a nonspecific marker focal brain damage (T 2) with a crude clinical measure (EDSS)» Barkhof D, Curr Opin Neurol 2008


GRAZIE PER L'ATTENZIONE!!
- Slides: 75