
DISTRIBUTIONS OF RESIDENCE TIMES FOR CHEMICAL REACTORS By
DISTRIBUTIONS OF RESIDENCE TIMES FOR CHEMICAL REACTORS By Azalina Mohamed Nasir
STUDENTS SHOULD BE ABLE TO; DEFINE and DESCRIBE the cumulative F(t), external age E(t), and internal age I(t) residence time distribution (RTD) functions RECOGNIZE these function for PFR, CSTR and laminar flow reactions. APPLY these functions to CALCULATE the conversion and concentrations exiting a reactor using the segregation model and maximum mixedness model for both single and multiple reactions.
OVERVIEW; Learn about nonideal reactors, that is reactors do not follow the models we have developed for ideal CSTRs, PFRs and PBRs. Describe nonideal reactors using ; A)residence time distribution function, E(t) B) The mean residence time, tm C) The cumulative distribution fuction, F(t) D)The variance, σ2
OVERVIEW; Evaluate E(t), tm, F(t) and σ2 for ideal reactor, so we have a reference point as to how for our real (nonideal) reactor Recognize all these functions & apply to calculate the conversion & concentrations exiting a reactor using certain model.
RESIDENCE-TIME DISTRIBUTION (RTD) FUNCTION… In an ideal plug flow reactor, all the atoms of material leaving the reactor have been inside it for exactly the same amount time. Similarly, in an ideal batch reactor, all the atoms of materials within the reactor have been inside it for an identical length of time. The time the atoms have spent in the reactor is called the RESIDENCE TIME of the atoms in the reactor.
RESIDENCE-TIME DISTRIBUTION (RTD) FUNCTION…CONT… The idealized plug-flow and batch reactors are the only 2 classes of reactors in which all the atoms in the reactors have the same residence time. In all other reactor types, the various atoms in the feed spend different times inside the reactor, that is a DISTRIBUTION OF RESIDENCE TIMES of the material within the reactor.
RESIDENCE-TIME DISTRIBUTION (RTD) FUNCTION…CONT… The residence-time distribution (RTD) of the reactor is a characteristic of the mixing that occurs in the chemical reactor. There is no axial mixing in a plug flow reactor and this omission is reflected in the RTD. The CSTR is thoroughly mixed and processes a far different kind of RTD than the plug flow reactor.
MEASUREMENT OF RTD… RTD is determined experimentally by injecting an inert chemical, molecule, or atom called a tracer, into the reactor at some time t=0 and then measuring the tracer concentration, C in the effluent stream as a function of time. Tracer – nonreactive species that easily detectable (similar physical properties to reacting mixture and be completely soluble in the mixture) and should not adsorb on the walls @ other surface in the reactor. Eg; colored & radioactive materials along with inert gasses are the most common type of tracer.
THEORY OF RTD Definition of Residence Time Distribution (RTD) - Probability distribution function that describes the amount of time that a fluid element could spend inside the reactor Purpose of RTD Analysis - To characterize the mixing and flow within reactors - To compare the behavior of real reactors to their ideal models Why? . . - For reactors troubleshooting - Estimation of yield for given reaction - Future reactor design The theory of RTD generally begins with 3 assumptions: 1. The reactor is at steady-state, 2. Transports at the inlet and the outlet takes place only by advection 3. The fluid is incompressible (v = constant).
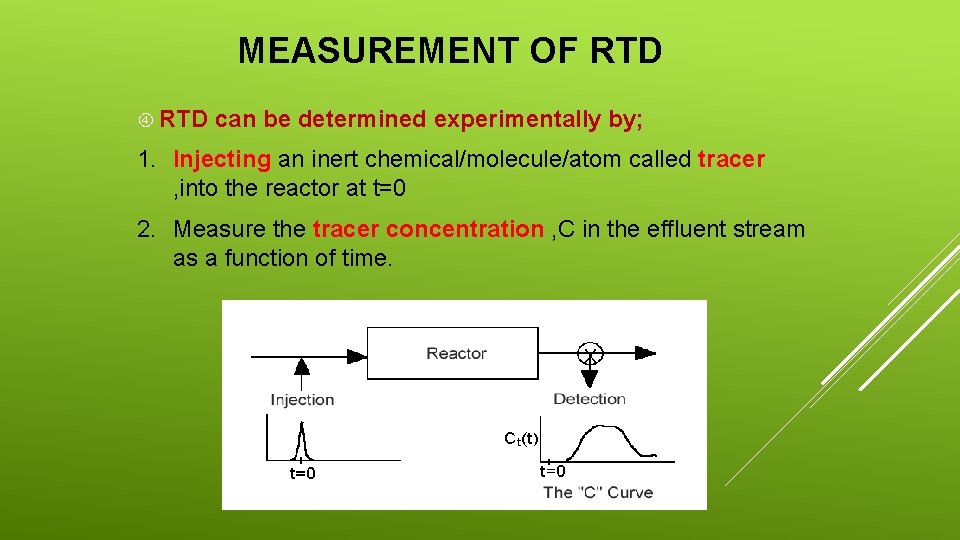
MEASUREMENT OF RTD can be determined experimentally by; 1. Injecting an inert chemical/molecule/atom called tracer , into the reactor at t=0 2. Measure the tracer concentration , C in the effluent stream as a function of time.
Properties of tracer : - Non reactive species - Easily detectable - Physical properties similar to reacting mixture - Completely soluble in the mixture - Not adsorb on the wall or other reactor surface Common type tracer- Colored an radioactive materials along with inert gases RTD can be determined by two experimental methods (based on injection method: pulse or step) 1. Pulse experiment 2. Step experiment
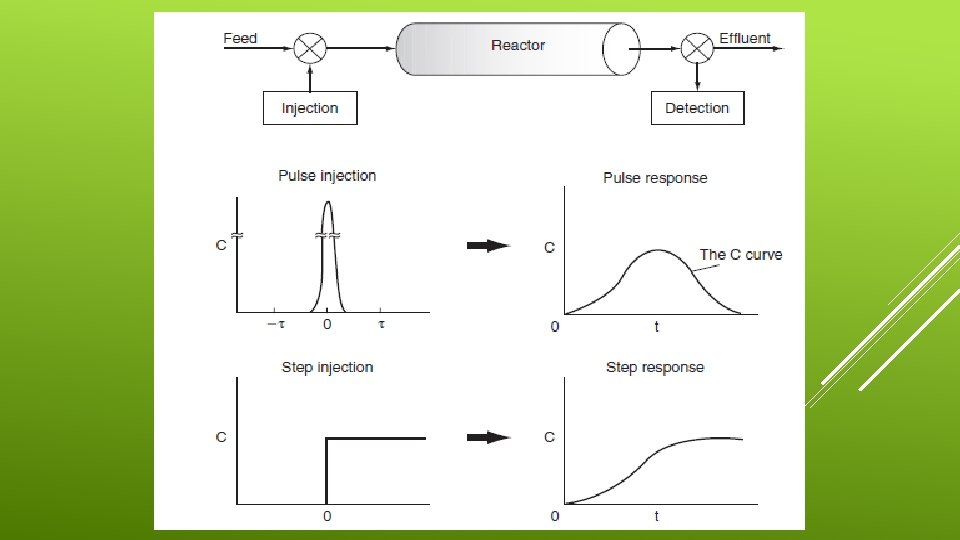
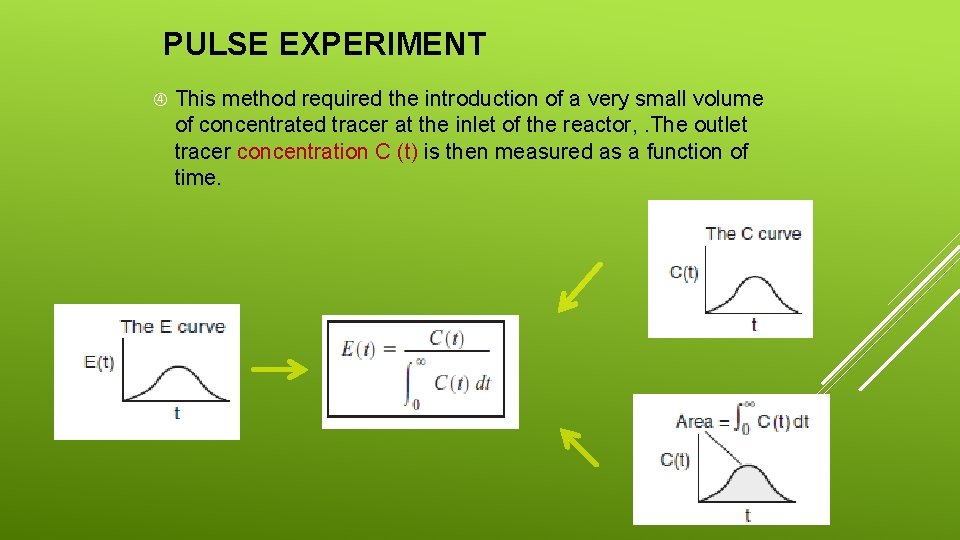
PULSE EXPERIMENT This method required the introduction of a very small volume of concentrated tracer at the inlet of the reactor, . The outlet tracer concentration C (t) is then measured as a function of time.
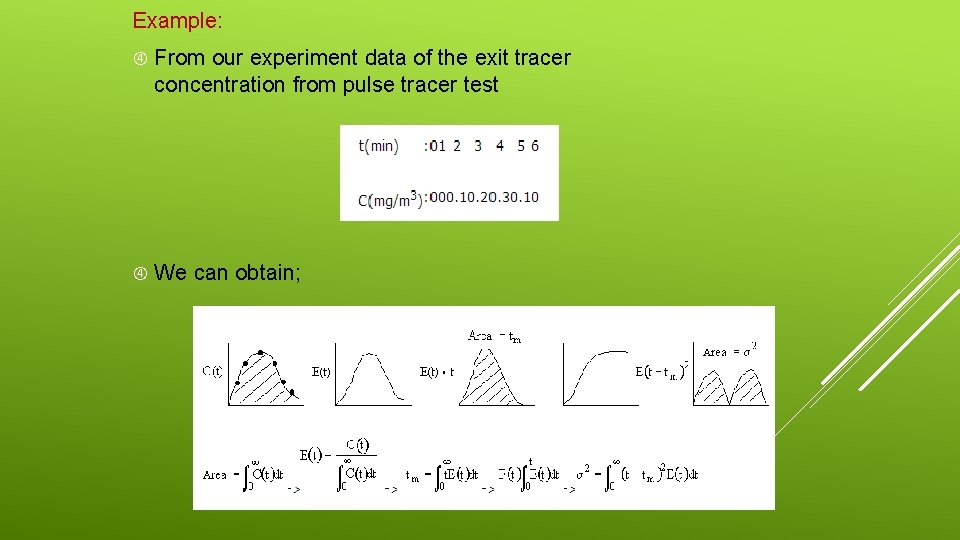
Example: From our experiment data of the exit tracer concentration from pulse tracer test We can obtain;
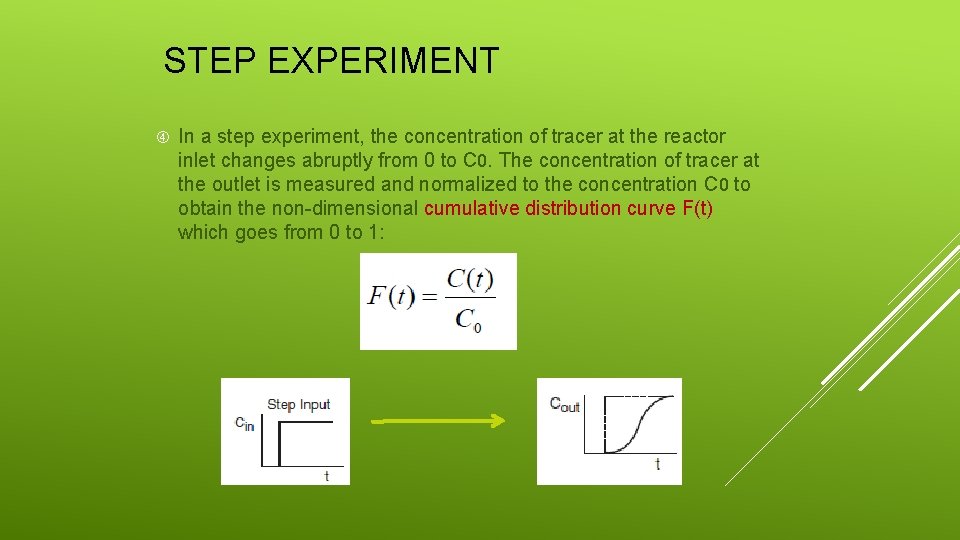
STEP EXPERIMENT In a step experiment, the concentration of tracer at the reactor inlet changes abruptly from 0 to C 0. The concentration of tracer at the outlet is measured and normalized to the concentration C 0 to obtain the non-dimensional cumulative distribution curve F(t) which goes from 0 to 1:
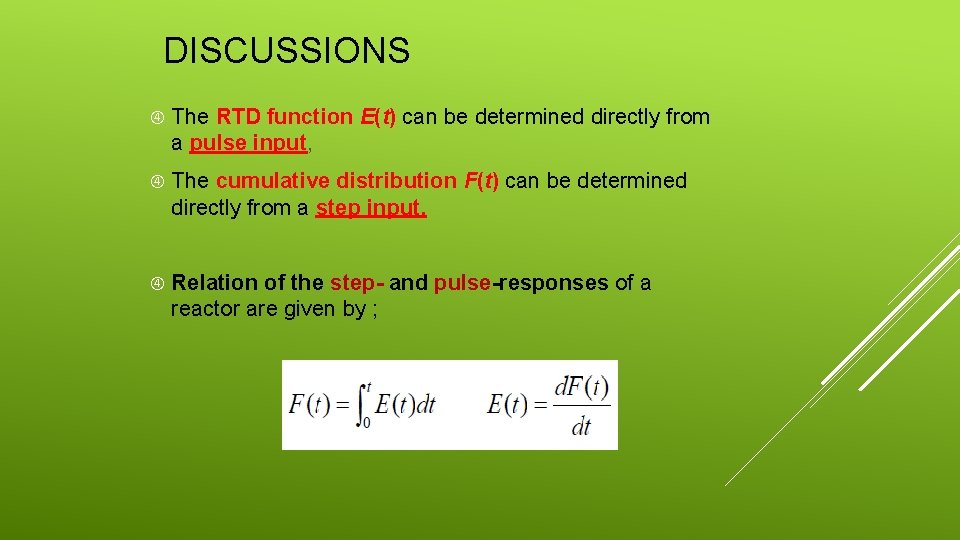
DISCUSSIONS The RTD function E(t) can be determined directly from a pulse input, The cumulative distribution F(t) can be determined directly from a step input. Relation of the step- and pulse-responses of a reactor are given by ;
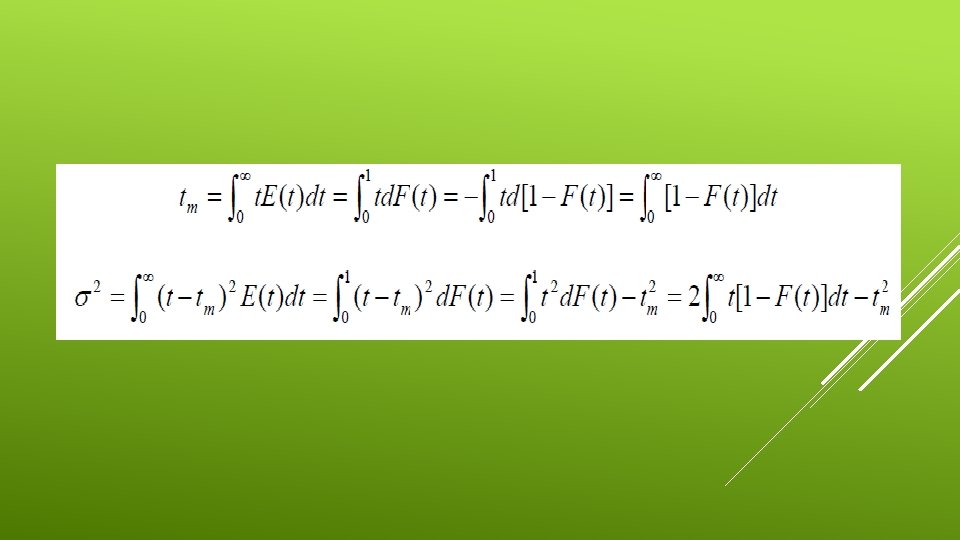
The value of the mean residence time (tm) and the variance (σ2) can also be deduced from the cumulative distribution function F(t):
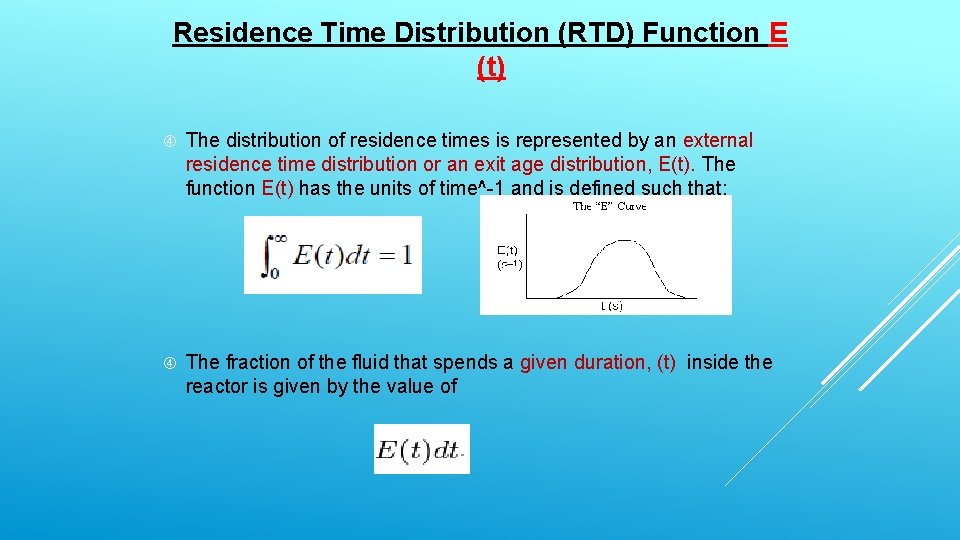
Residence Time Distribution (RTD) Function E (t) The distribution of residence times is represented by an external residence time distribution or an exit age distribution, E(t). The function E(t) has the units of time^-1 and is defined such that: The fraction of the fluid that spends a given duration, (t) inside the reactor is given by the value of
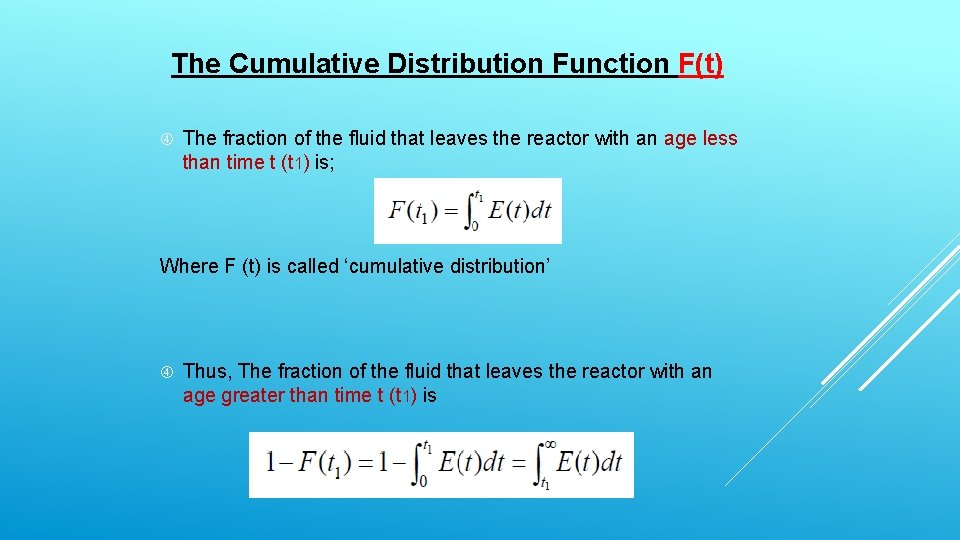
The Cumulative Distribution Function F(t) The fraction of the fluid that leaves the reactor with an age less than time t (t 1) is; Where F (t) is called ‘cumulative distribution’ Thus, The fraction of the fluid that leaves the reactor with an age greater than time t (t 1) is
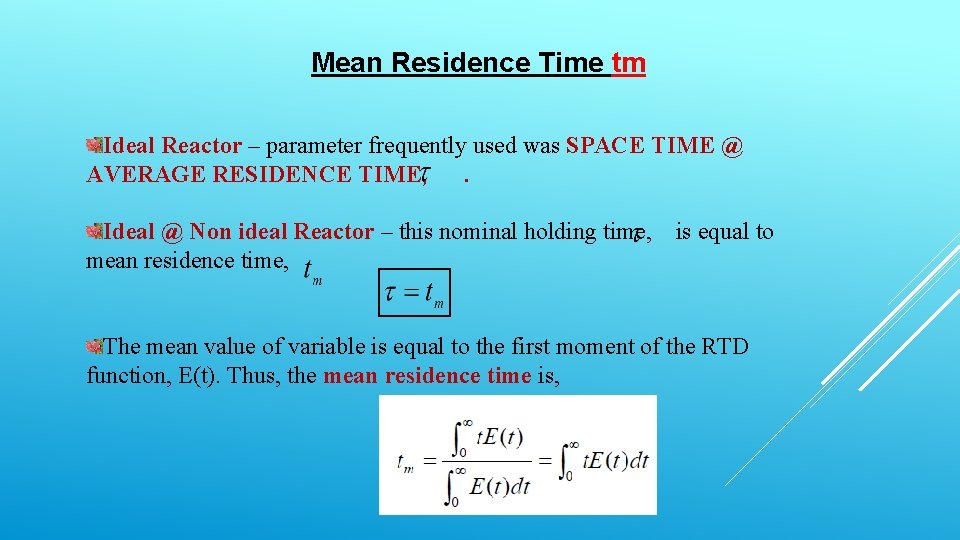
Mean Residence Time tm Ideal Reactor – parameter frequently used was SPACE TIME @ AVERAGE RESIDENCE TIME, . Ideal @ Non ideal Reactor – this nominal holding time, mean residence time, is equal to The mean value of variable is equal to the first moment of the RTD function, E(t). Thus, the mean residence time is,
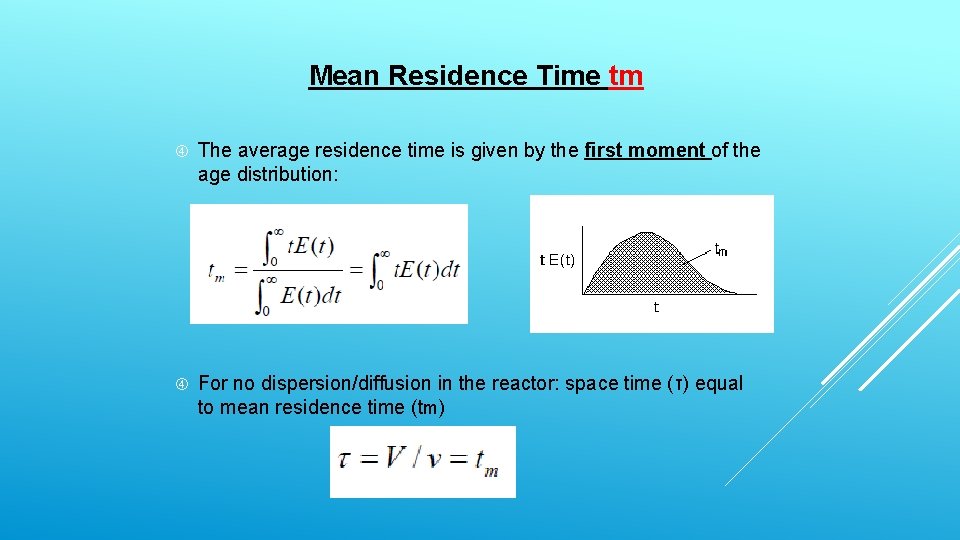
Mean Residence Time tm The average residence time is given by the first moment of the age distribution: For no dispersion/diffusion in the reactor: space time (τ) equal to mean residence time (tm)
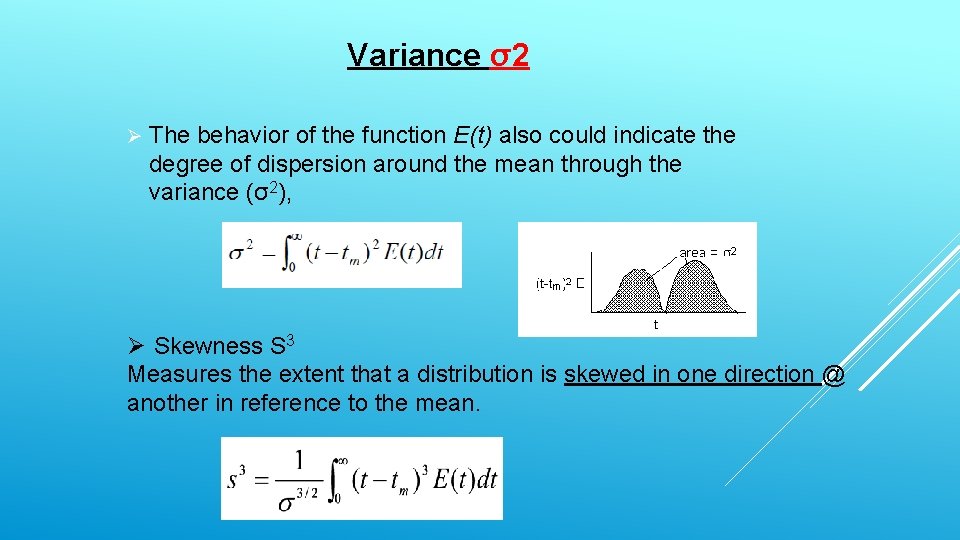
Variance σ2 Ø The behavior of the function E(t) also could indicate the degree of dispersion around the mean through the variance (σ2), Ø Skewness S 3 Measures the extent that a distribution is skewed in one direction @ another in reference to the mean.

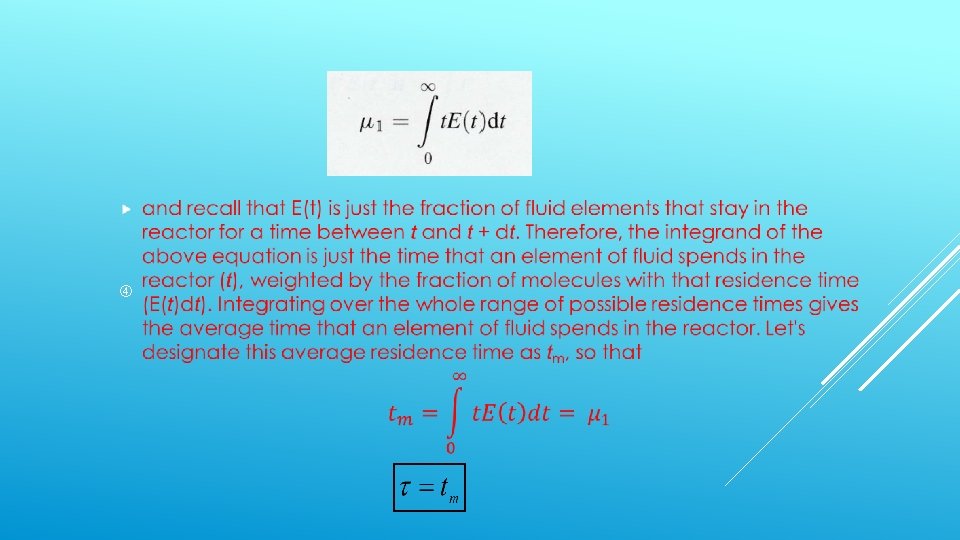
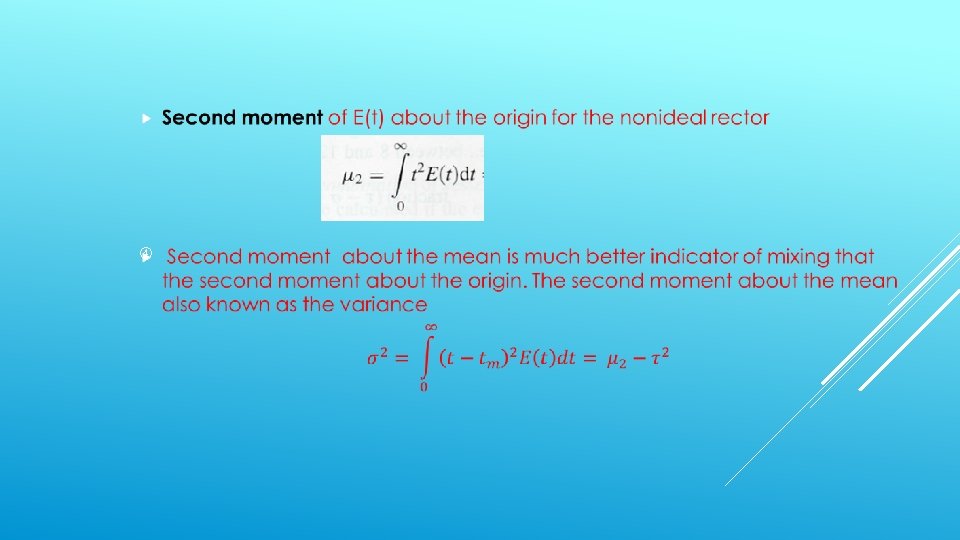
MOMENTS OF RESIDENCE TIME DISTRIBUTONS nth moment of a function f(x) about the origin is designated µn and is defined as The function f(x) distribution function just like E(t) The material balance on the tracer So the zeroth moment of a function of C(t), where C(t) is the concentration of tracer in the effluent from a reactor at any time t. Dividing both side by the volumetric flow rate υ gives an expression for the zeroth moment of C(t) about the origin
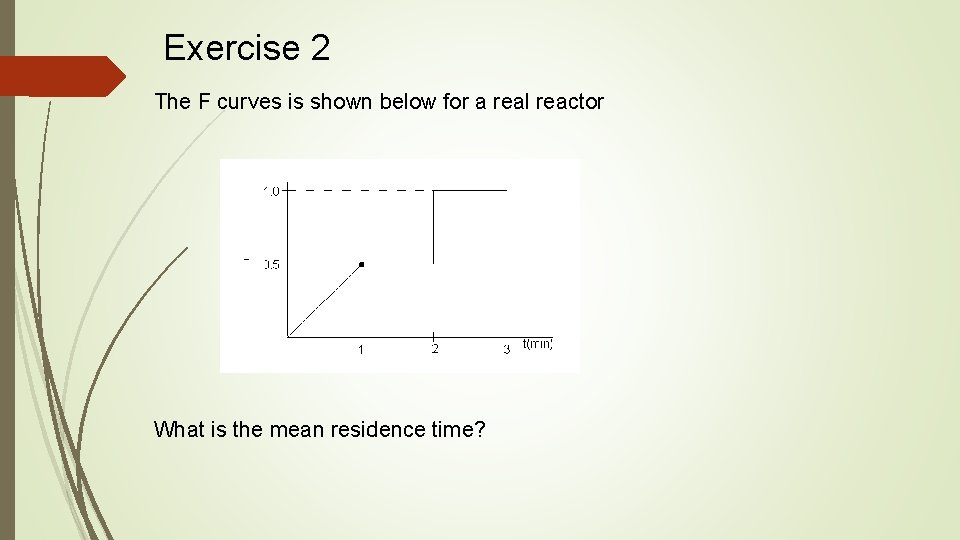
Exercise 2 The F curves is shown below for a real reactor What is the mean residence time?
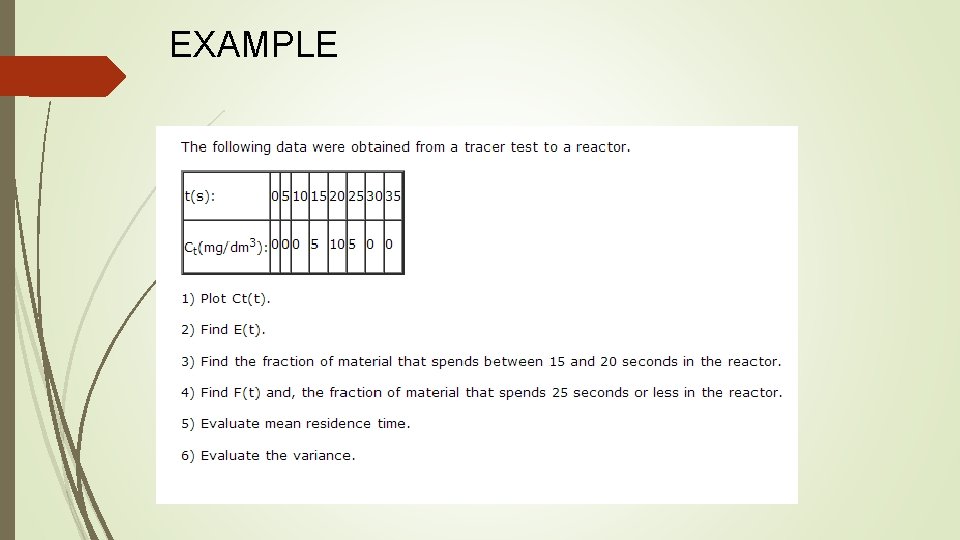
EXAMPLE
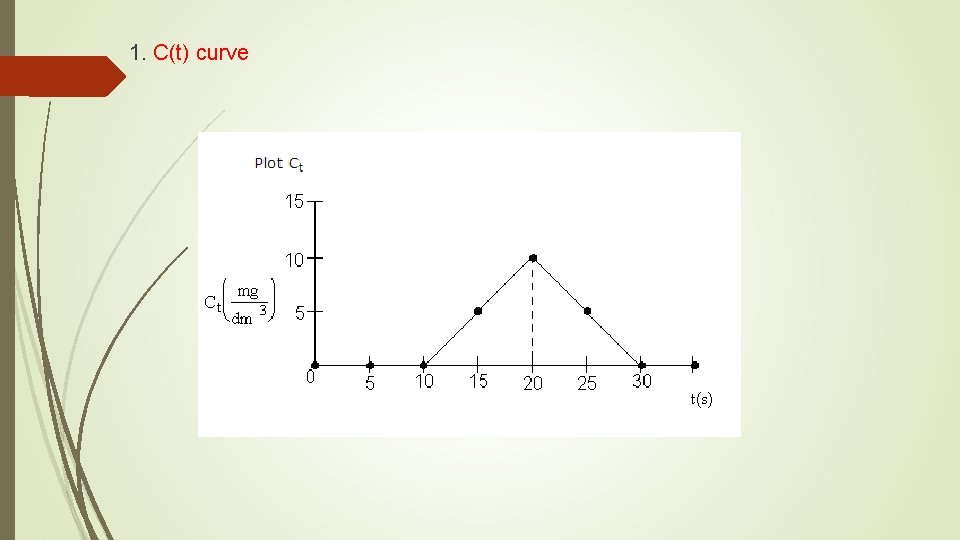
1. C(t) curve
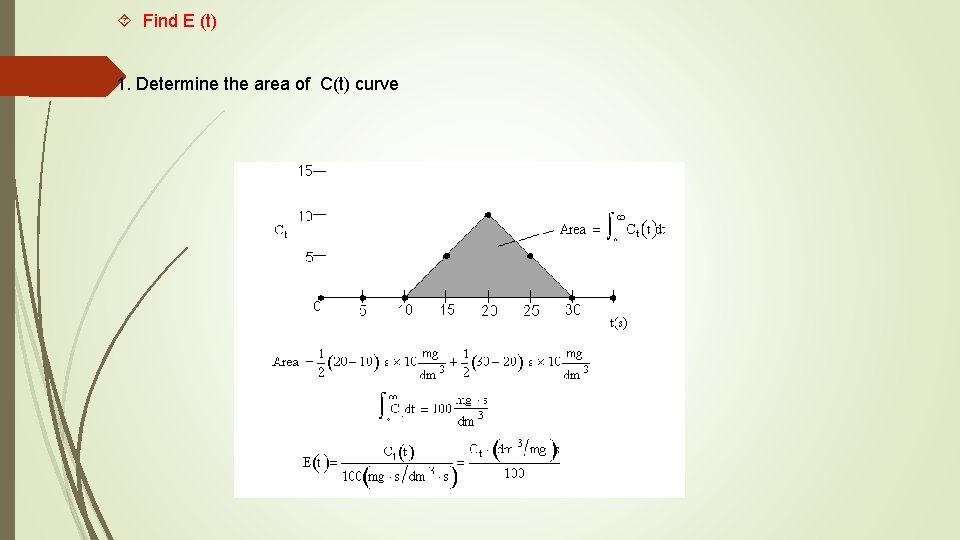
Find E (t) 1. Determine the area of C(t) curve
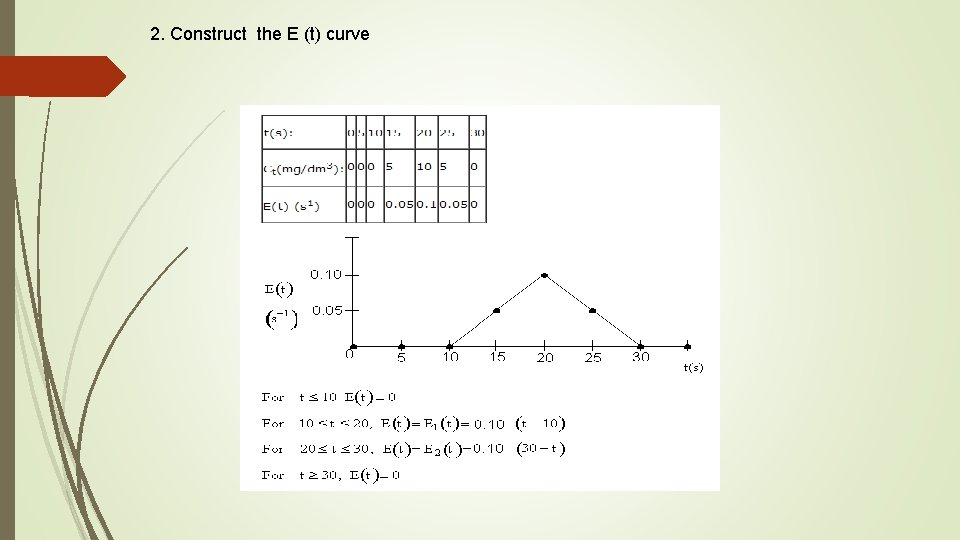
2. Construct the E (t) curve
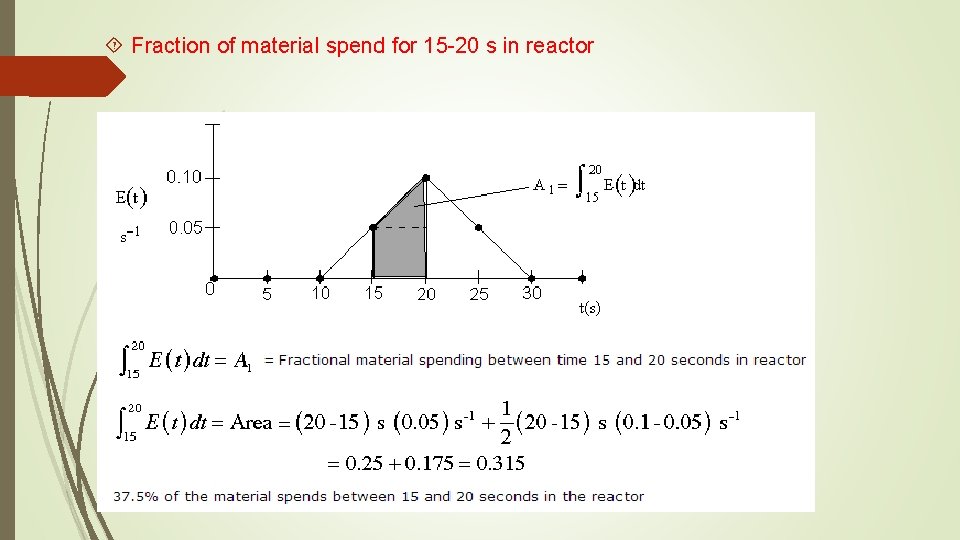
Fraction of material spend for 15 -20 s in reactor
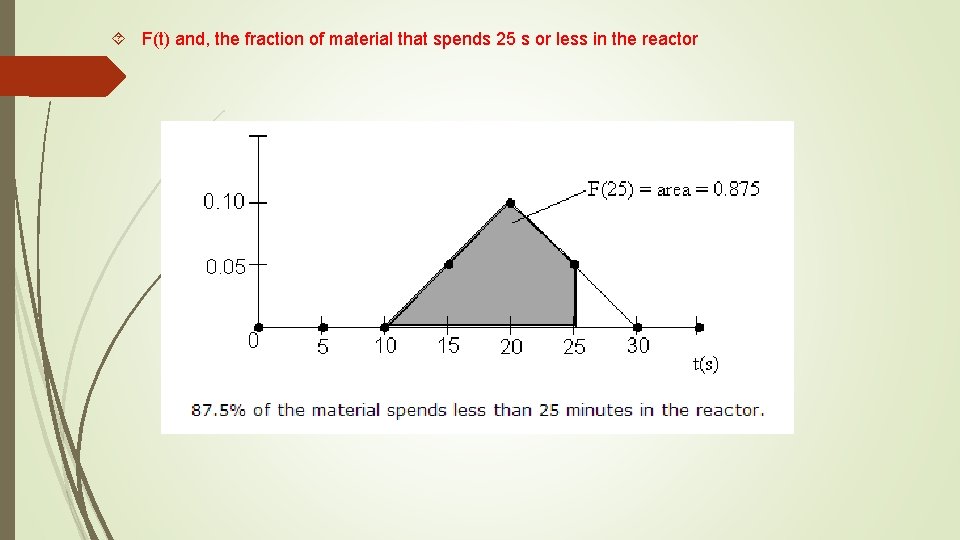
F(t) and, the fraction of material that spends 25 s or less in the reactor
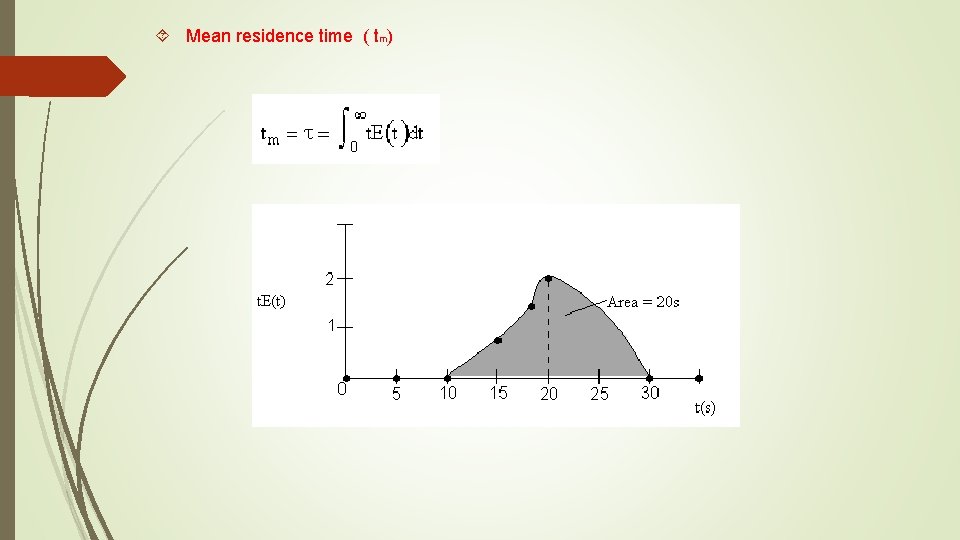
Mean residence time ( tm)
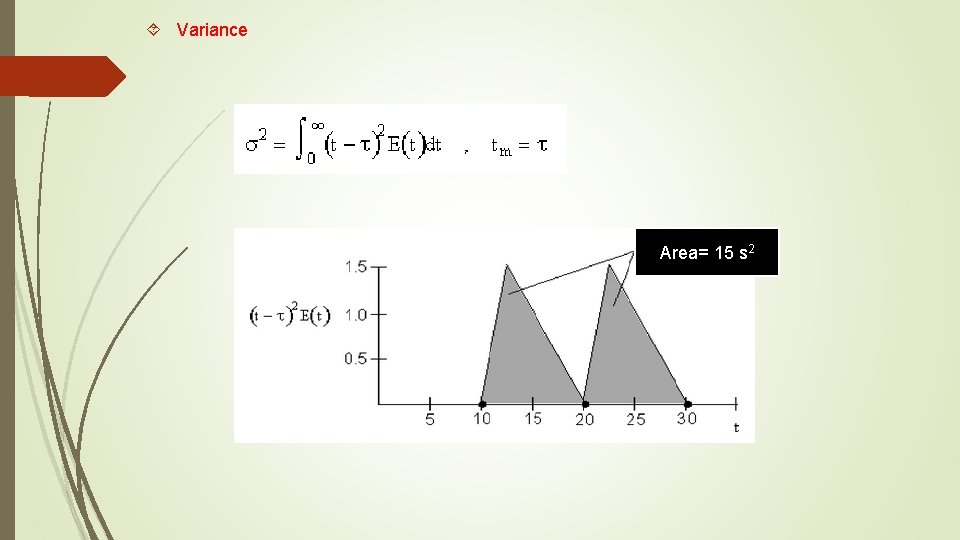
Variance Area= 15 s 2

EXAMPLE 13 -1
EXAMPLE 13 -1(C)

EXAMPLE 13 -2
RTD FOR IDEAL REACTORS The RTD of a reactor can be used to compare its behavior to that of two ideal reactor models: the PFR and the CSTR (or mixed-flow reactor). This characteristic is important in order to calculate the performance of a reaction with known kinetics.
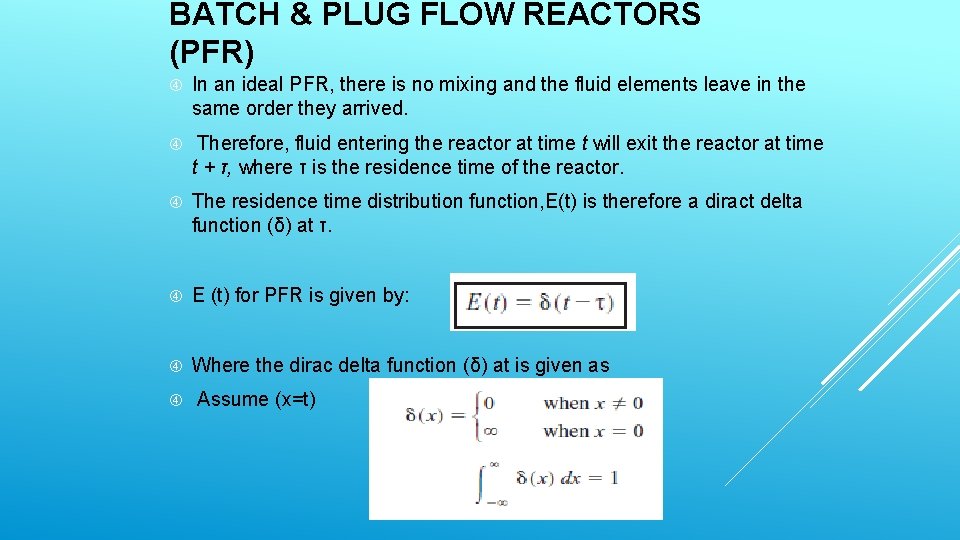
BATCH & PLUG FLOW REACTORS (PFR) In an ideal PFR, there is no mixing and the fluid elements leave in the same order they arrived. Therefore, fluid entering the reactor at time t will exit the reactor at time t + τ, where τ is the residence time of the reactor. The residence time distribution function, E(t) is therefore a diract delta function (δ) at τ. E (t) for PFR is given by: Where the dirac delta function (δ) at is given as Assume (x=t)
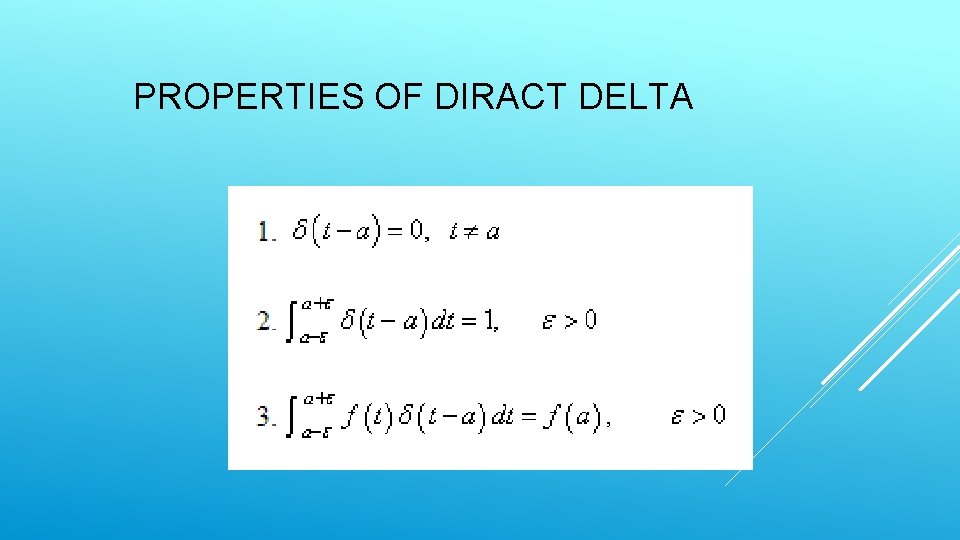
PROPERTIES OF DIRACT DELTA
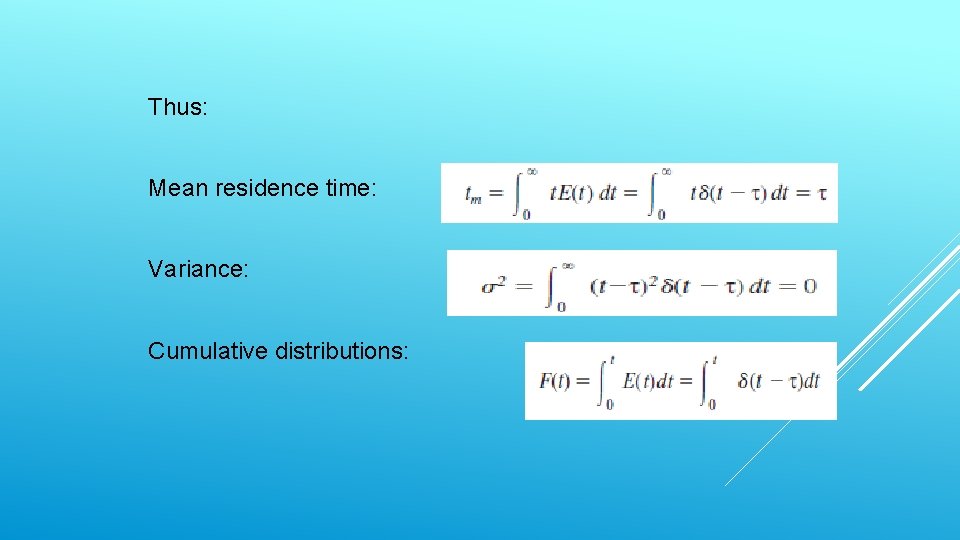
Thus: Mean residence time: Variance: Cumulative distributions:
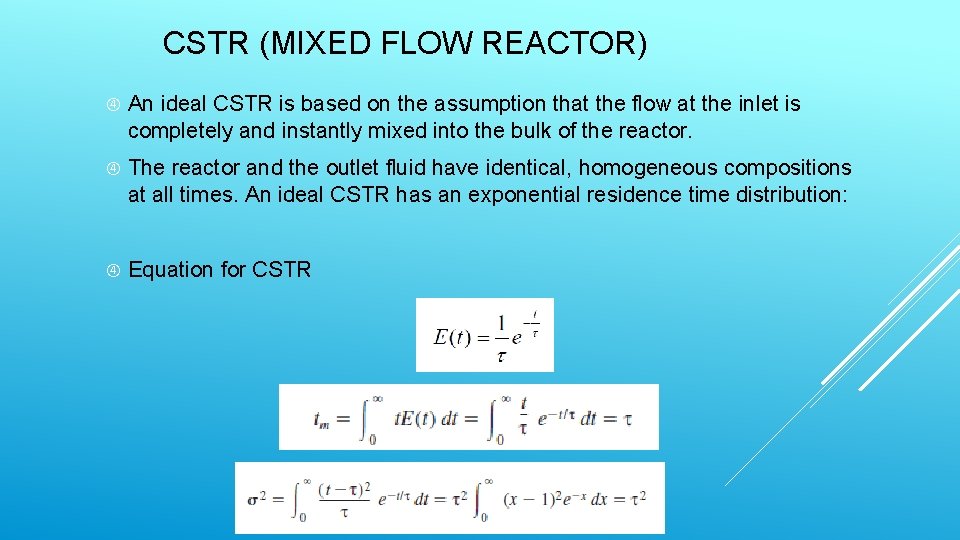
CSTR (MIXED FLOW REACTOR) An ideal CSTR is based on the assumption that the flow at the inlet is completely and instantly mixed into the bulk of the reactor. The reactor and the outlet fluid have identical, homogeneous compositions at all times. An ideal CSTR has an exponential residence time distribution: Equation for CSTR
PREDICTING CONVERSION AND EXIT CONCENTRATION The RTD tells us how long the various fluid elements have been in the reactor, but it does not tell us anything about the exchange of matter between the fluid elements. The length of time each molecule spends in the reactor is all that is needed to predict conversion.
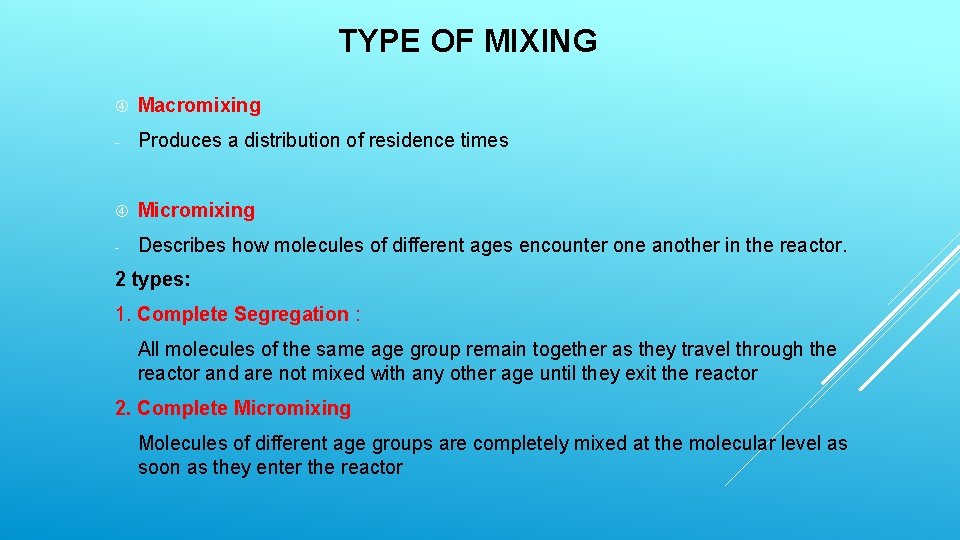
TYPE OF MIXING Macromixing - Produces a distribution of residence times Micromixing - Describes how molecules of different ages encounter one another in the reactor. 2 types: 1. Complete Segregation : All molecules of the same age group remain together as they travel through the reactor and are not mixed with any other age until they exit the reactor 2. Complete Micromixing Molecules of different age groups are completely mixed at the molecular level as soon as they enter the reactor
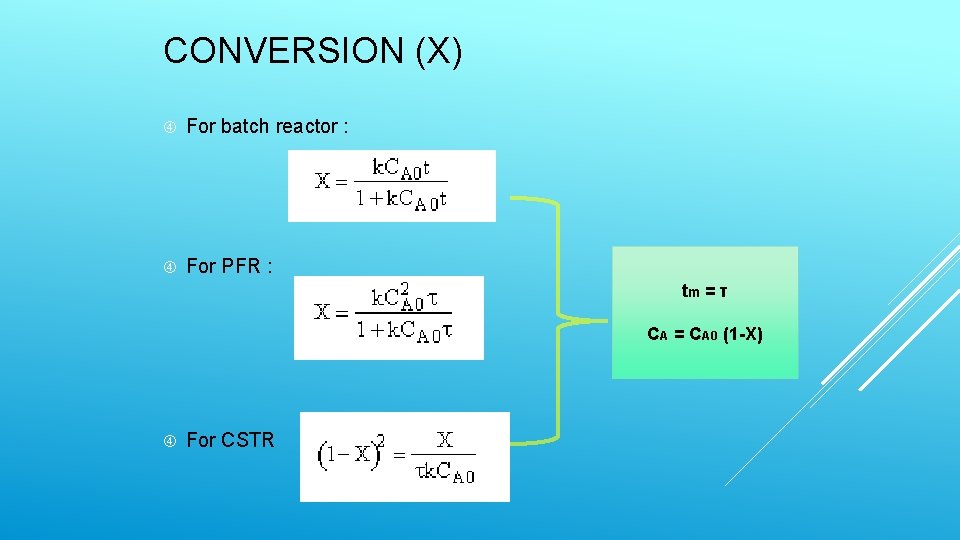
CONVERSION (X) For batch reactor : For PFR : tm = τ CA = CA 0 (1 -X) For CSTR
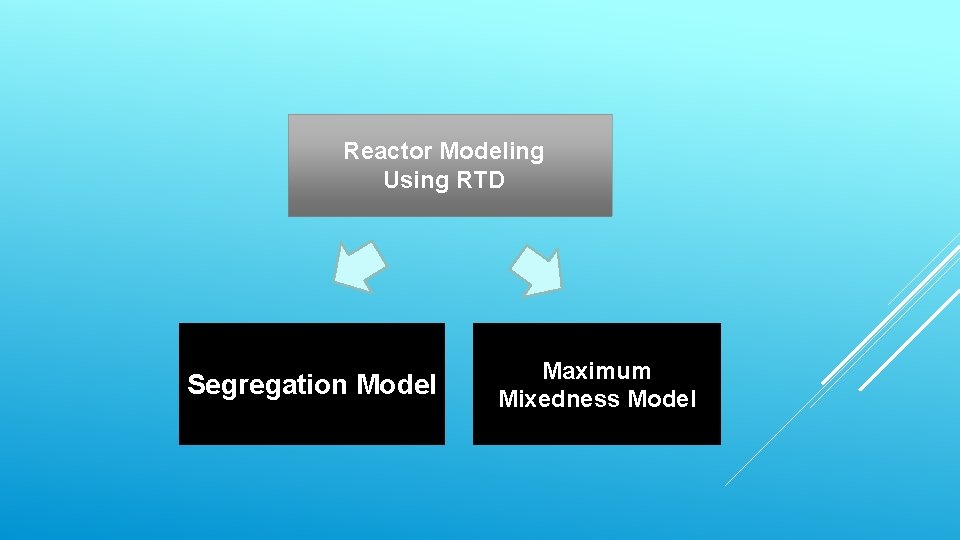
Reactor Modeling Using RTD Segregation Model Maximum Mixedness Model
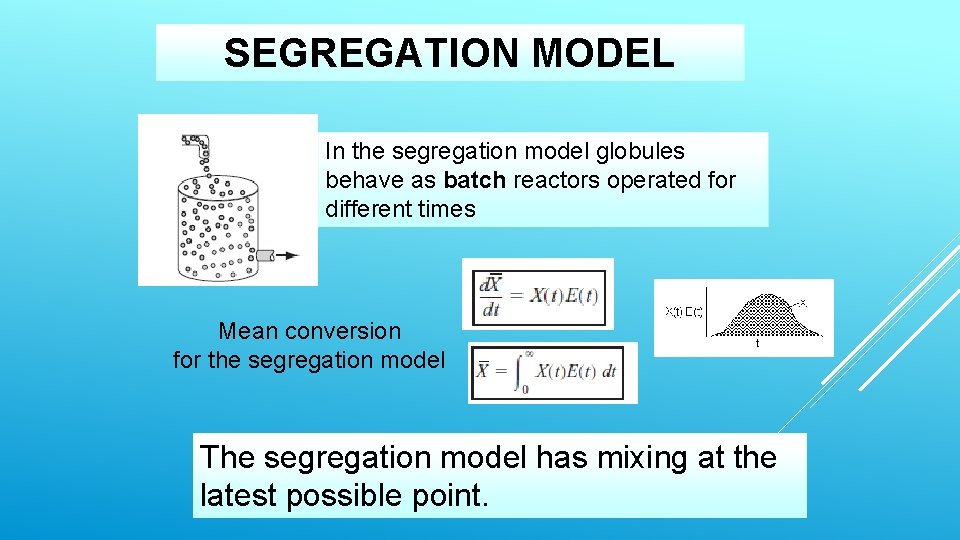
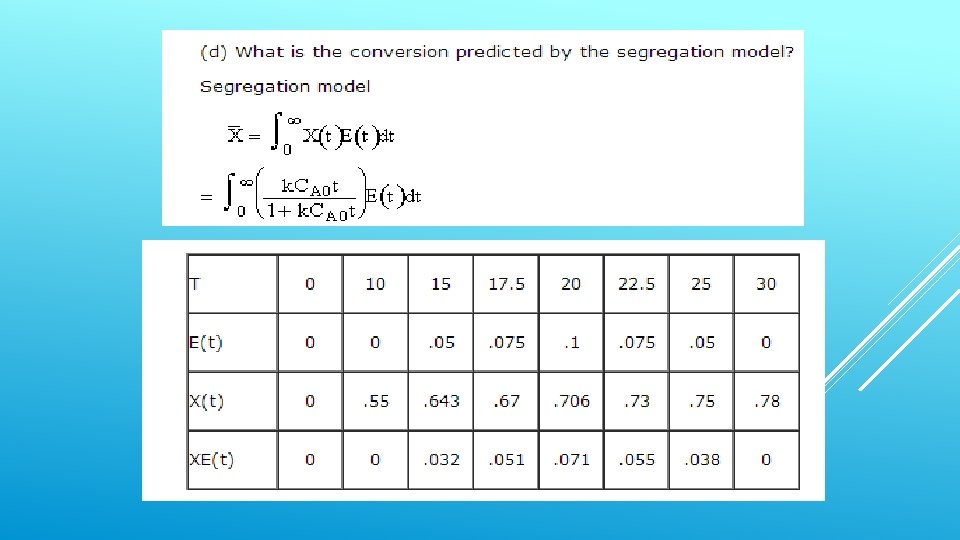
SEGREGATION MODEL In the segregation model globules behave as batch reactors operated for different times Mean conversion for the segregation model The segregation model has mixing at the latest possible point.
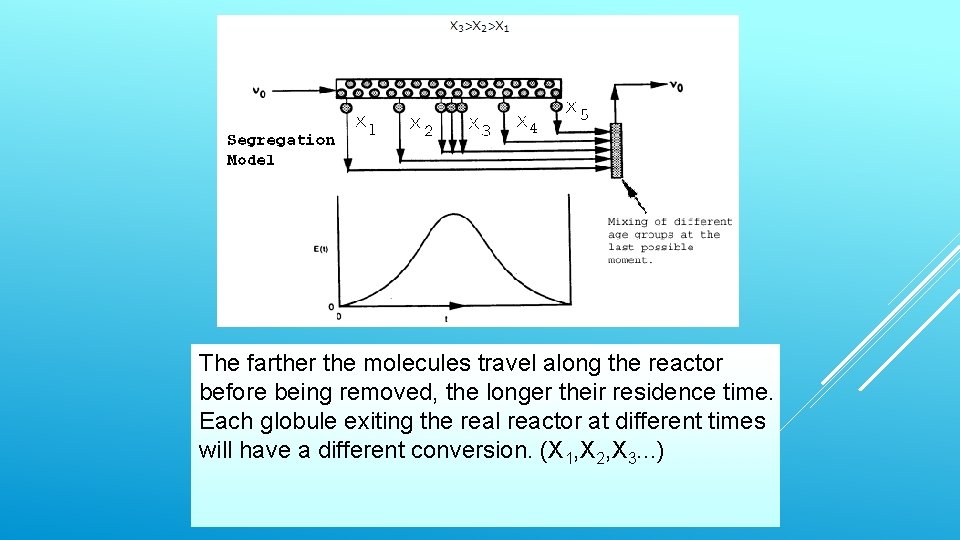
The farther the molecules travel along the reactor before being removed, the longer their residence time. Each globule exiting the real reactor at different times will have a different conversion. (X 1, X 2, X 3. . . )
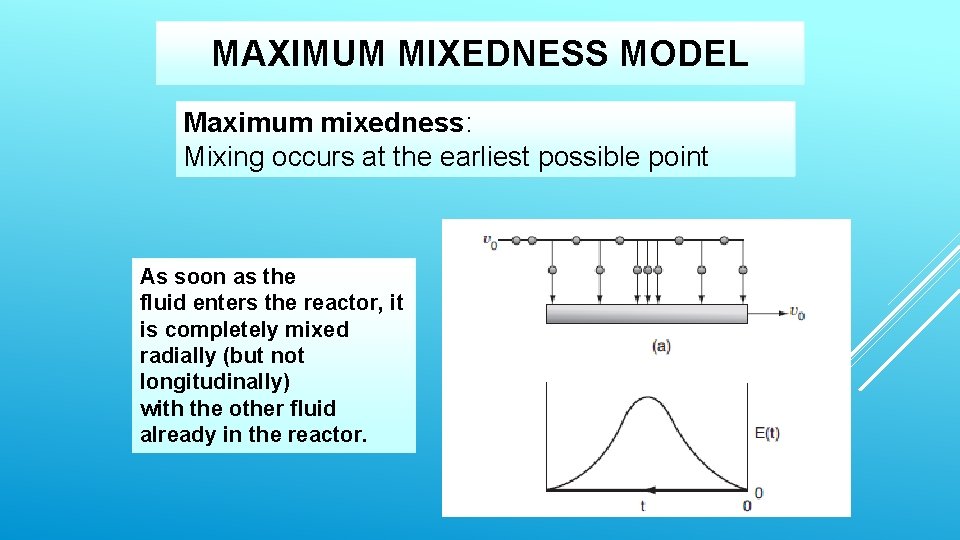
MAXIMUM MIXEDNESS MODEL Maximum mixedness: Mixing occurs at the earliest possible point As soon as the fluid enters the reactor, it is completely mixed radially (but not longitudinally) with the other fluid already in the reactor.
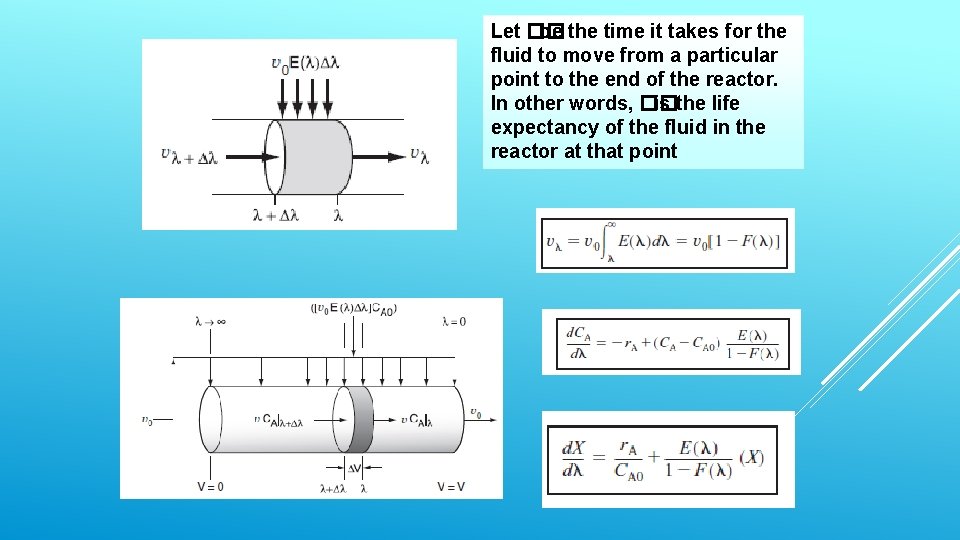
Let �� be the time it takes for the fluid to move from a particular point to the end of the reactor. In other words, �� is the life expectancy of the fluid in the reactor at that point
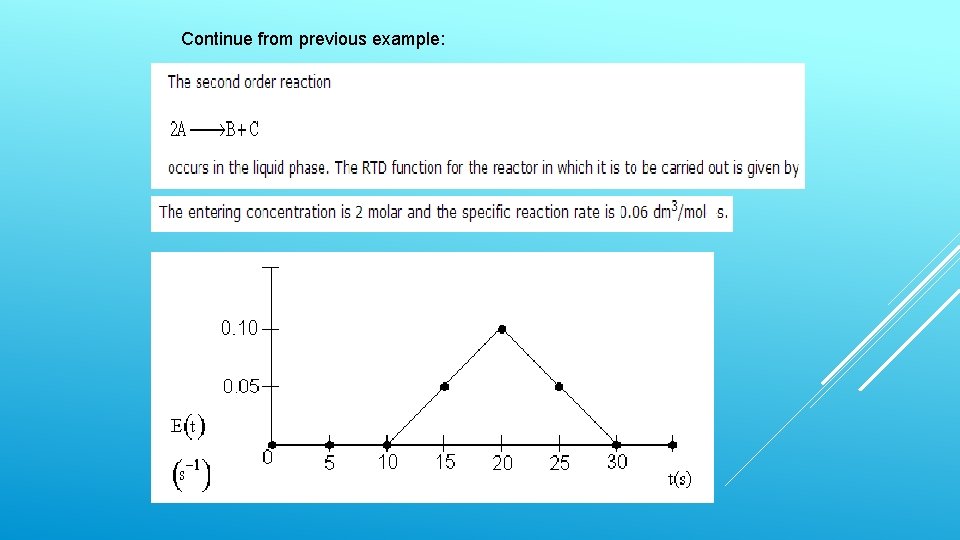
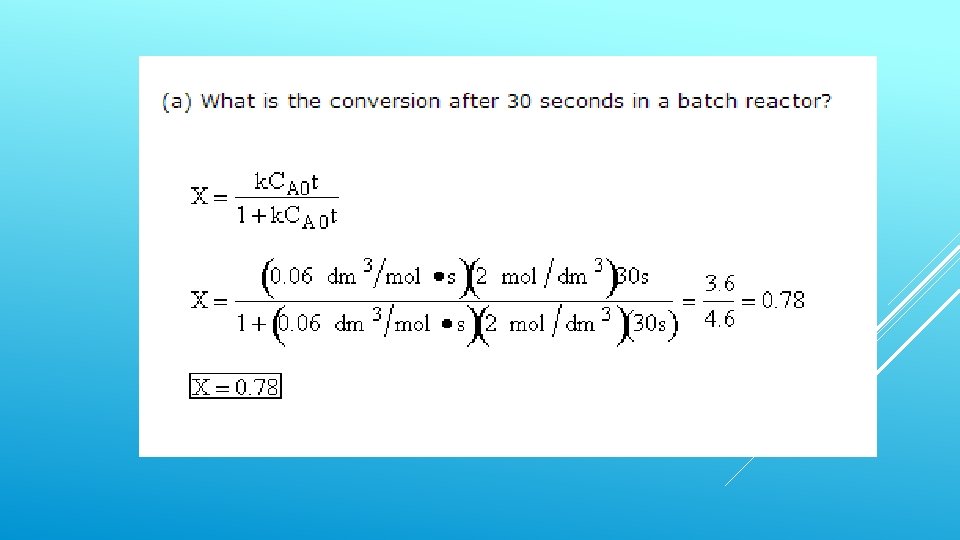
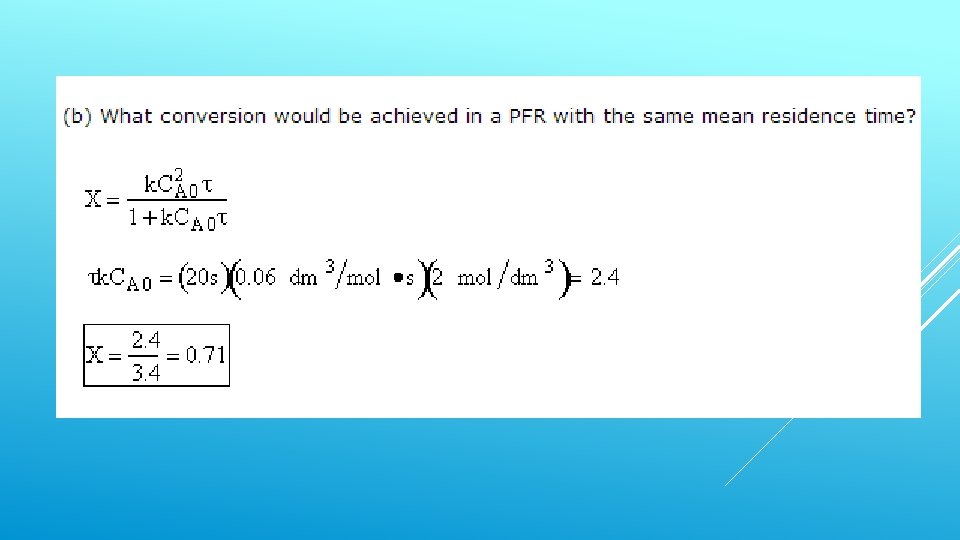
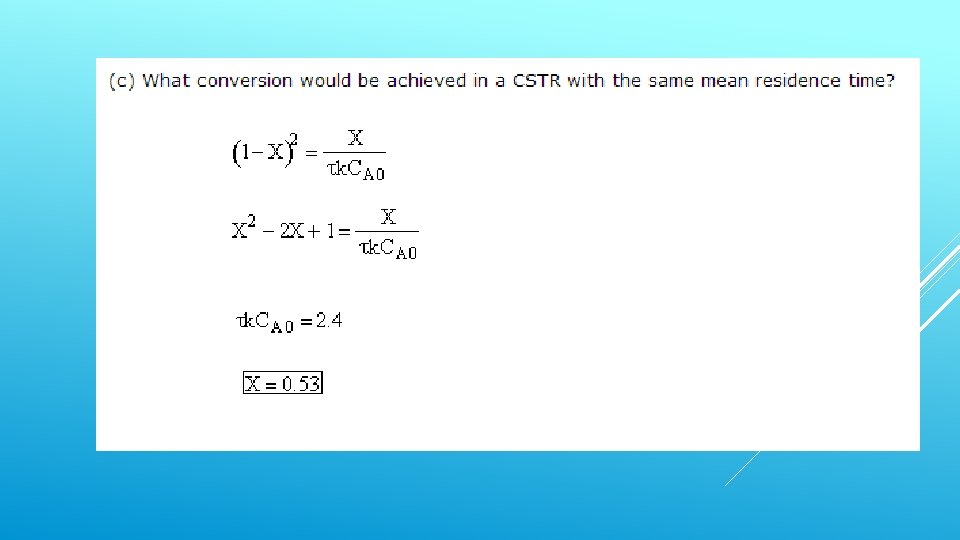
Continue from previous example:
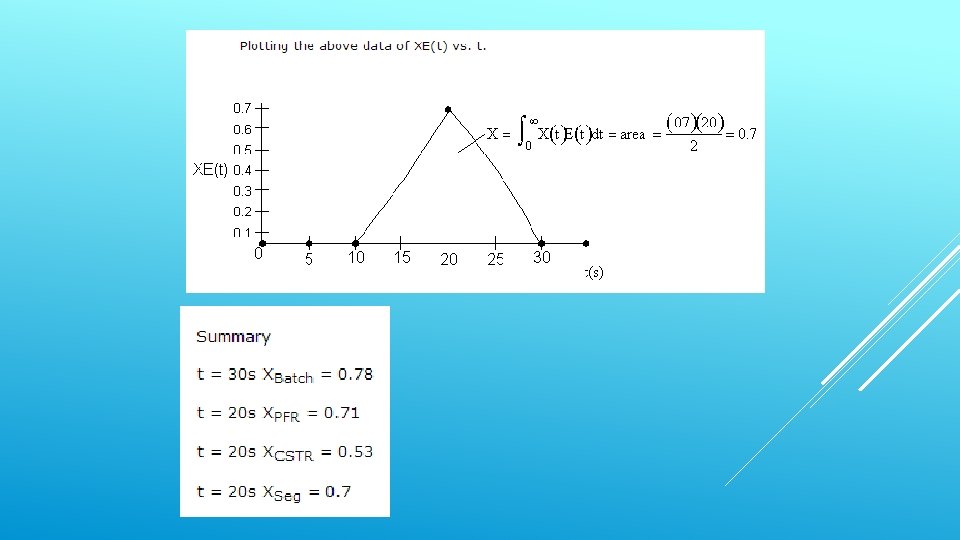
CHAPTER ENDED. ALL THE BEST =)
- Slides: 57