DISTRIBUTION CAPACITY ANALYSIS AND PROCESS IMPROVEMENTS AT Project

DISTRIBUTION CAPACITY ANALYSIS AND PROCESS IMPROVEMENTS AT Project Review of P 09271 Aaron Heyman Abe Taleb Adam Cook Jose Rodriguez Spring 2009

Agenda Background Needs and Specs Review of MSD II Goals Capacity Analysis Tool Execution & Validation Results Process Improvement Lessons Learned

Overview Capacity & Labor Analysis Process Improvements

Project Description Problem Statement: What is the maximum # of orders/lines/units this facility can process in a given time period based on the current equipment/software? Processes In Scope: Receiving > Put Away > Replenishment > Picking > Packing > Shipping Pick and pack were the areas of focus 4

Customer Needs Customer Need # Importance CN 1 5 The time required to train users is minimal. Met CN 2 5 The computer tool is user friendly. Met CN 3 3 The computer tool is able to be upgraded and/or modified in the future. Met CN 4 5 The computer tool represents the real world. Met CN 5 3 The computer tool identifies invalid data inputs. Met CN 6 1 The computer tool executes commands quickly. Met CN 7 3 The computer tool alerts the user when a given demand input is not realizable given actual capacity. Met CN 8 3 The computer tool allows the user to visualize all the information on a single screen. Met CN 9 3 The computer tool provides the option to print a report of the output. Met Description Comments/Status Importance Scale: 5= Must Have 3= Nice To Have 1= Preferential 5

Metrics & Specifications Engineering Specifications 1 The training time is less than 30 minutes. 2 The computer tool is user friendly. 3 The computer tool is able to be upgraded and/or modified in the future. 4 The system represents the real world. 5 The system identifies invalid data inputs. 6 The system executes a command in no more than 0. 25 minutes. Metrics Training Time Ease of use Flexibility Validity Test Ease of use Execution Time 7 The system alerts the user when a given demand input is not realizable given actual capacity. Validity Test 8 The computer tool allows the user to visualize all the information on a single screen. Validity Test 9 The computer tool provides the option to print a report of the output. Validity Test Table 1. 1 Relationship of customer needs to metrics Target Specifications 1 2 3 4 5 Metrics Training Time Ease of use Flexibility Validity Test Execution Time Units Need Nos. Importance Ideal Value 1 5 Minutes <30 2, 5 5 Subjective 5 3 3 Binary Yes 4, 7, 8, 9 1 Binary Pass 6 1 Minutes 0. 05 Marginal value <60 3 Yes Pass 0. 25 Table 1. 2 Target Specifications Importance Scale: 5= Must Have 3= Nice To Have 1= Preferential Binary: Pass or Fail. 6

Review of MSD II Goals from MSD I Add Pack area to computer tool Validate computer tool through historical data and on floor trials Turn computer tool over to customer for implementation Identify process improvement opportunities and present to customer Implement desired process improvement projects
 rev 3. 4 Calculates the labor")
What did we do? Capacity Analysis Tool (CAT) rev 3. 4 Calculates the labor hours needed to process a given demand for Pick and Pack Within 1% and 2% respectively Calculated current maximum throughput for facility Approximately 114, 000 lines Current demand is around 55, 000 lines

Execution of Plan Week 1 Week 2 Week 3 Week 4 Week 5 Week 6 Week 7 Week 8 Week 9 Week 10 Get Pack data Add Pack to Model Revise Pack Model OVERALL CAPACITY Pack Formulas Validate Model Identify Opportunities On Floor Trials Document Ideas, Present to Customer Revisions Pack Formulas Turn over to CV Model Complete Revisions, Validate Pack Implementation if desired Mid Quarter Presentation 75% Tech Paper IMAGINE RIT Final Presentation

Pack Labor & Individual Capacity Analysis Added pack labor hour calculations Unable to use Mean Time Between Failure, Mean Time to Repair due to lack of data Upper Bounds on Throughput based on maximum number of workers per area Used Excel Solver to maximize capacity, given the constraint on FTE’s

Verification and Validation How did we know the CAT was accurate? Used historical data Expert opinion from customer Pack was more difficult due to recent implementation of WFM

Results and Conclusions Pick Validation: Labor hours within 1% Pack Validation: Shrinking gap over past four weeks of data, currently within 2% Ability to determine needed labor for any given demand for facility Determined maximum orders that the Henrietta facility can process in its current state

Process Improvements

ADM Kaizen Initial meeting April 17, 2009 9: 00 am People present Inventory control Replenishment personnel ADM operators Pick Supervisors RIT Students Meeting was very productive, everyone contributed with good suggestions and critiques.

Ideas Discussed Ideas discussed Single label with color coding, and barcode included Two labels: one with barcode and another with three digits and colors

Ideas Discussed Re-slotting carton flow racks v. s. Incorporate a flag system

Meeting Conclusions Single label with barcode Re-slotting carton flow racks, not agreed The benefits obtained from this are not so large when compared to the effort to be invested Flags are to be incorporated only for the high movers as having 500 flags will drive operators crazy

Final Label Design Two sizes, one for ADM and one for carton flow racks If white background is allowed next to barcode, number of colors can increase

Cost/Benefit Analysis Assumptions Define a defect as replenishing a slot in the ADM with wrong product. Considered only locations with <95% accuracy Sample cycle counted is representative of the state of whole system Labor costs $10/hr Assume 920 slots currently being used
 2 Packing defect recognition")
Cost/Benefit Analysis Time spent on a single defect Time (mins) 2 Packing defect recognition 3 Packing notifies the search and rescue team 12 Fill out form and travel to and from ADM to pick the right product 2 Repack the order 5 Check the slot that contained the wrong product potentially remove items that are not supposed to be there. TOTAL minutes per 24 defect Cycle Count ADM - Results # of locations <95% accurate # of Locations <95% Nov. 08 920 16% 147. 2 Dec. 08 920 17% 156. 4 Jan. 09 920 20% 184 Feb. 09 920 33% 303. 6 Total defects 791. 2 Costs - Results Number of defects (1) Number of hours per defect (2) Cost of labor hour (3) Total cost of defects (1 x 2 x 3) Cost of labels Cost of defects Payback period (months) $ $ 1, 200. 00 3, 168. 00 4. 55 792 0. 4 10. 00 3, 168. 00

Implementation Plan If approval is not obtained within timeframe, transition document will be developed. If approval is obtained in time and product is received before Thursday may 14 th, the implementation will be executed. To minimize potential errors, no two stickers will be removed at the same time.

ADM Replenishment Flags Solution that all parties want but difficult to implement Other Solutions involved showing the current levels of all channels Idea for spring activated flag was generated but mechanics are difficult Advantage would be flag would only show when current channel needed product. Refilling channels before they become empty would increase productivity

Current Prototype

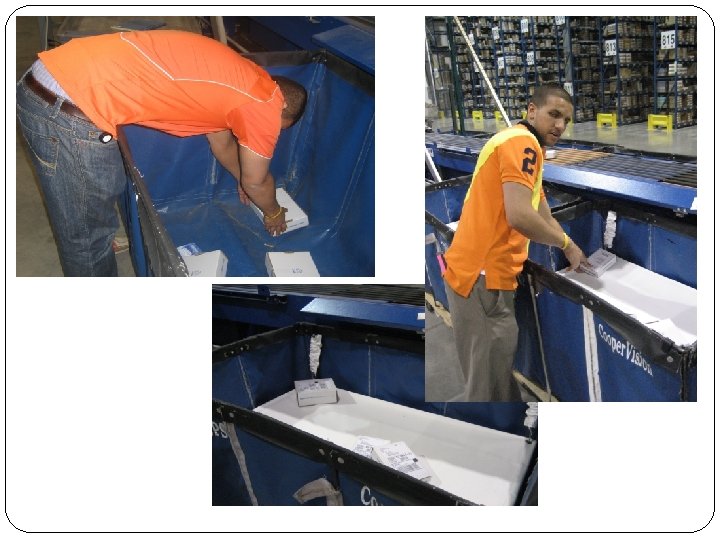
Shipping Conveyor Kaizen Event The Shipping Conveyor Kaizen was attended by representatives from packing, shipping and engineering. Quick decision was made to add Spring-loaded bottoms to re-sort bins, especially in light of the recent injuries. Discussion of mechanical solution lead to mostly dead ends. Most solutions have been tried before (Adding chutes instead of rollers, speeding up/down conveyors).

Shipping Conveyor Kaizen Event The final discussion focused on boxes being placed on the conveyor incorrectly Lisa defended that it is difficult to place the box correctly every time with the expectation to ship so many orders per hour Solution was generated to remind packers at weekly meetings to place boxes label side up and vertically oriented

Shipping Conveyor Today Spring bottoms have arrived and installed in the resort bins UPS blue bins will be switched out of those locations and replaced with either red or green bin Labeling has also been designed for bin stating “DO NOT REMOVE” Movement of MTO to a spot on the shipping conveyor will go a long way to reduce the number of packed boxes that need resorted.

Lessons Learned Keep track of assignments in a long term way to make sure work is evenly distributed Because we are all IE’s and able to handle all the work if needed No real division of skills Project Manager was also a full contributor Difficult to establish timeline because of fluidity of project and time cushion Required a lot of feedback from customer, which led to some delays Split up into sub-teams during MSD I for better execution

Acknowledgements Sarah Pittman John Kaemmerlen Andres Carrano Jim Fiorino Jim Della Valle Mike Sixby Participants in the Kaizen Events
- Slides: 29