Distributed Tracing How to do latency analysis for

Distributed Tracing How to do latency analysis for microservice-based applications Reshmi Krishna @reshmi 9 k

About Me § Software Engineer § Platform Architect, Pivotal § Women In Tech Community Members Twitter : @reshmi 9 k Meet. Up : Cloud-Native-New-York

Agenda § Distributed Tracing § Tracers and Tracing Systems § Zipkin § Incorporating distributed tracing into an existing micro service § Demo

From Monolith …. Customer Web Frontend Loyalty Payment Notifications

To Microservices.

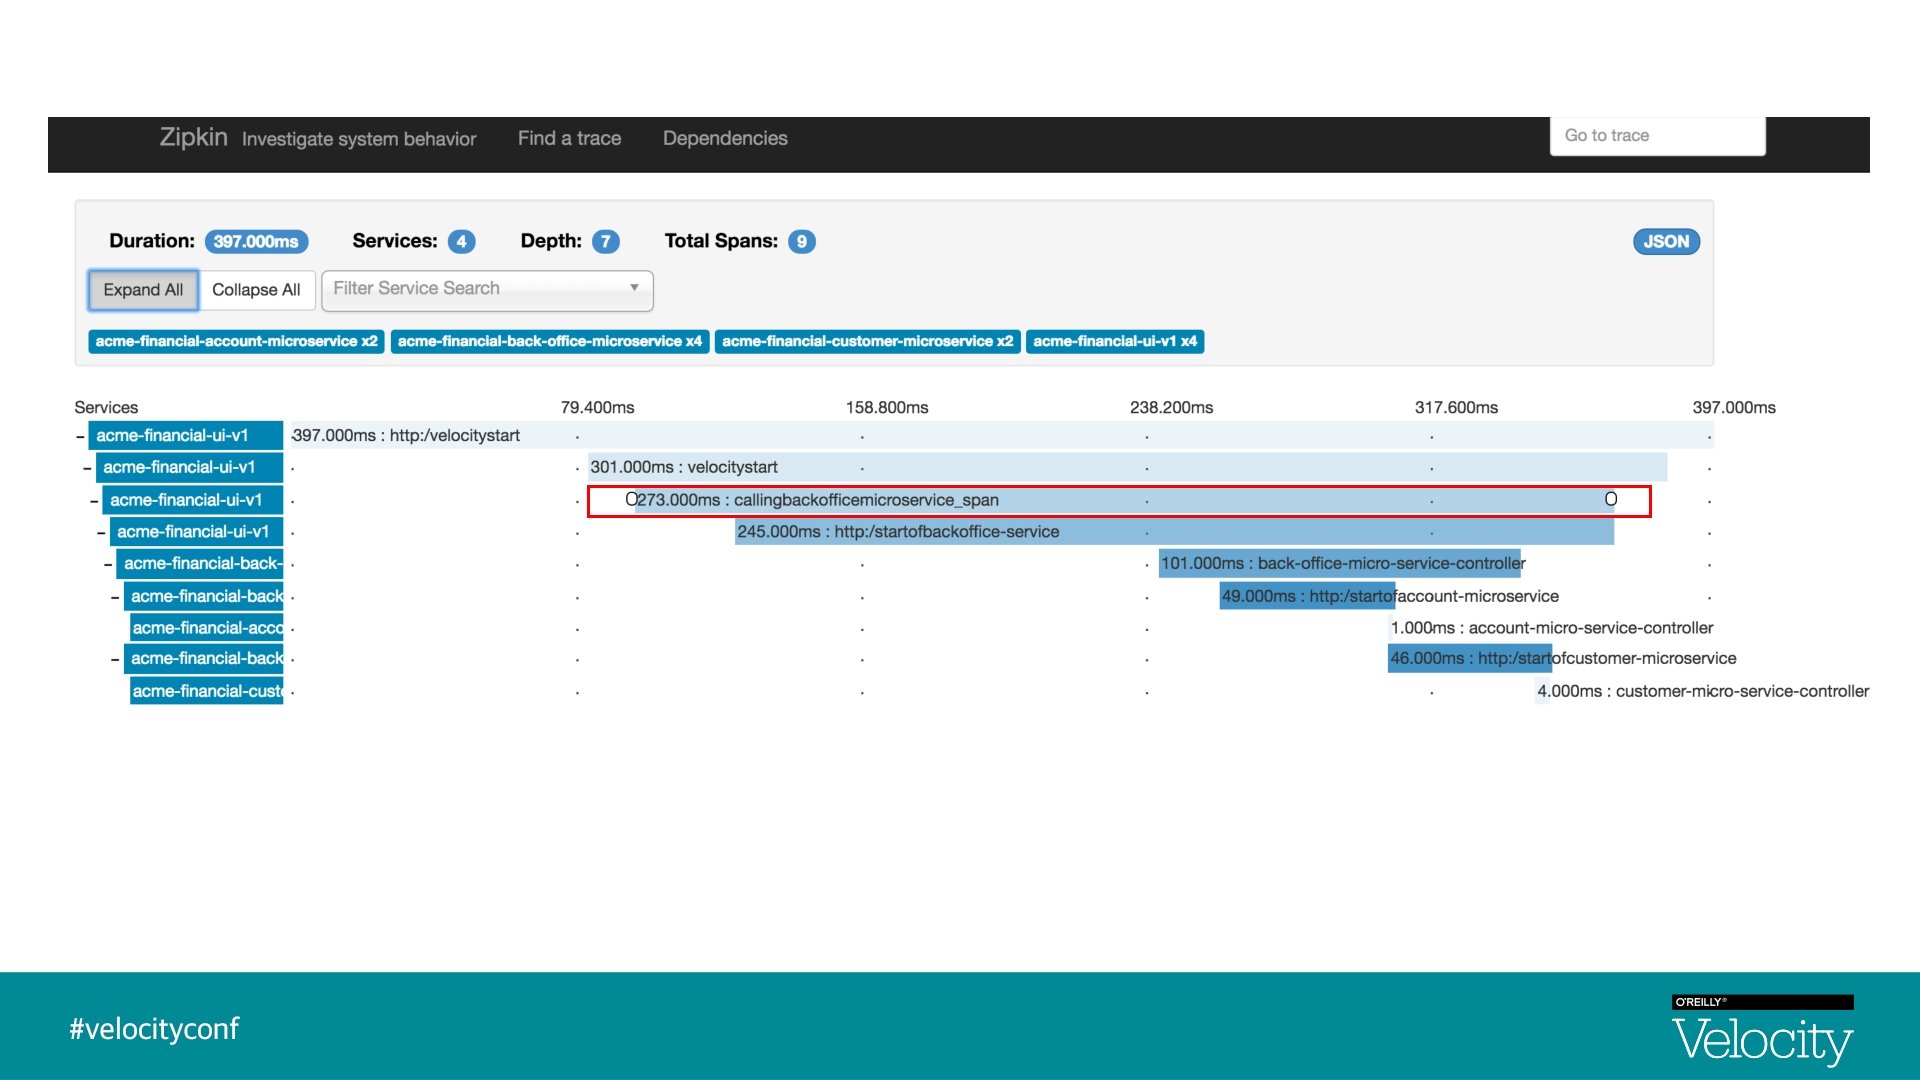
Troubleshooting Latency issues § When was the event? How long did it take? § How do I know it was slow? § Why did it take so long? § Which microservice was responsible?

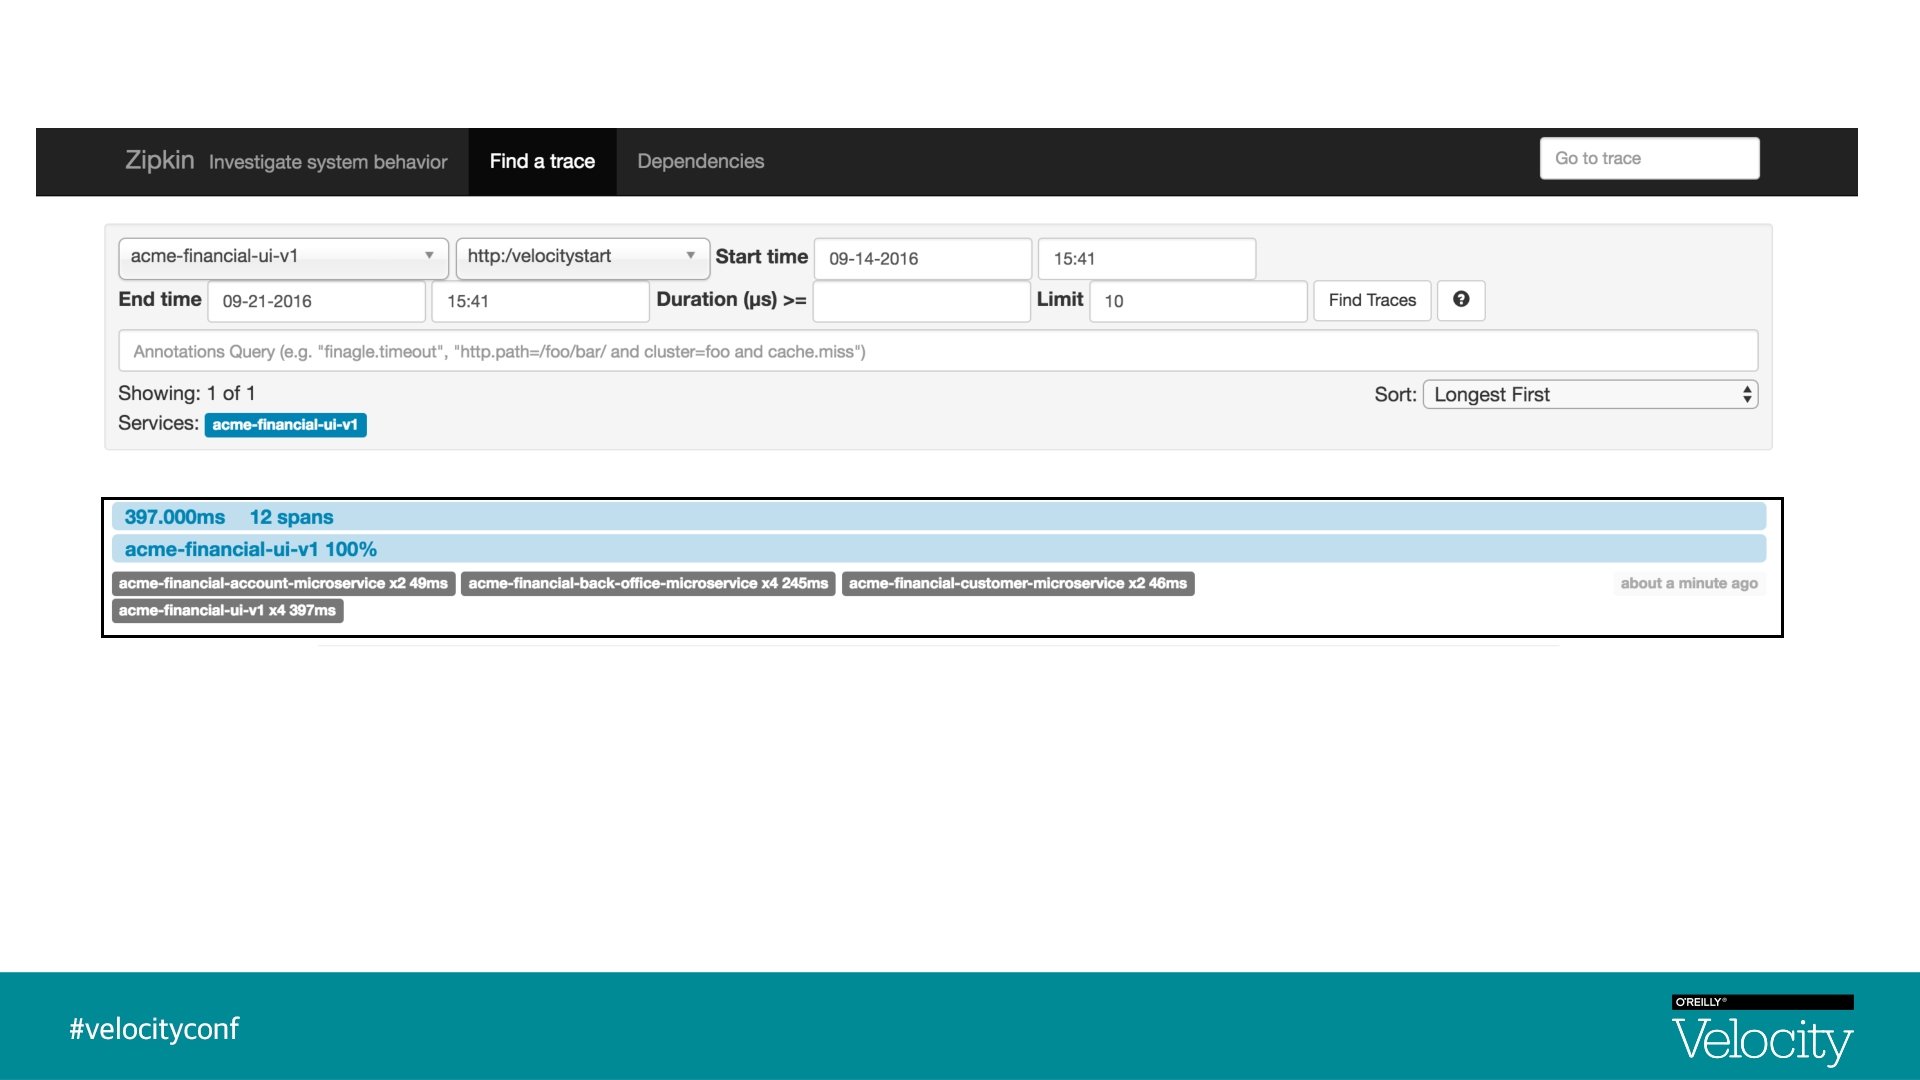
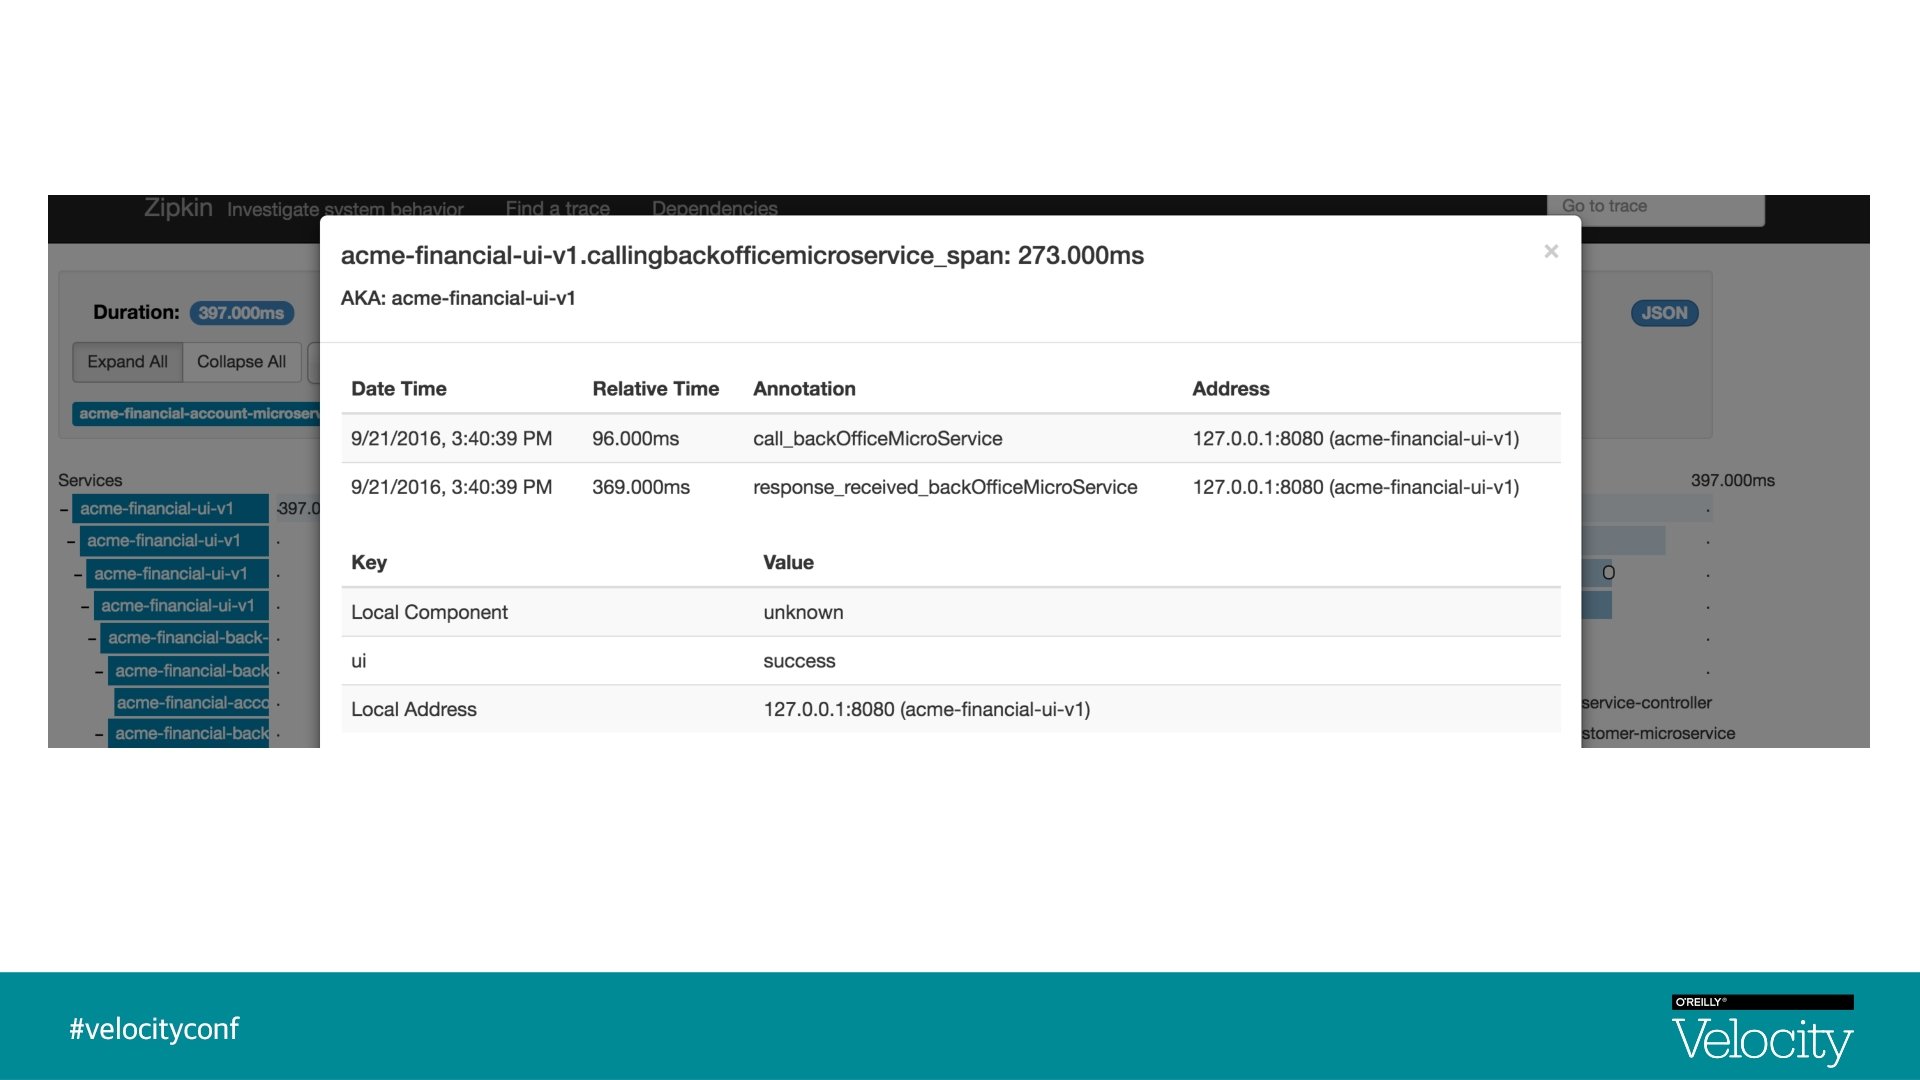
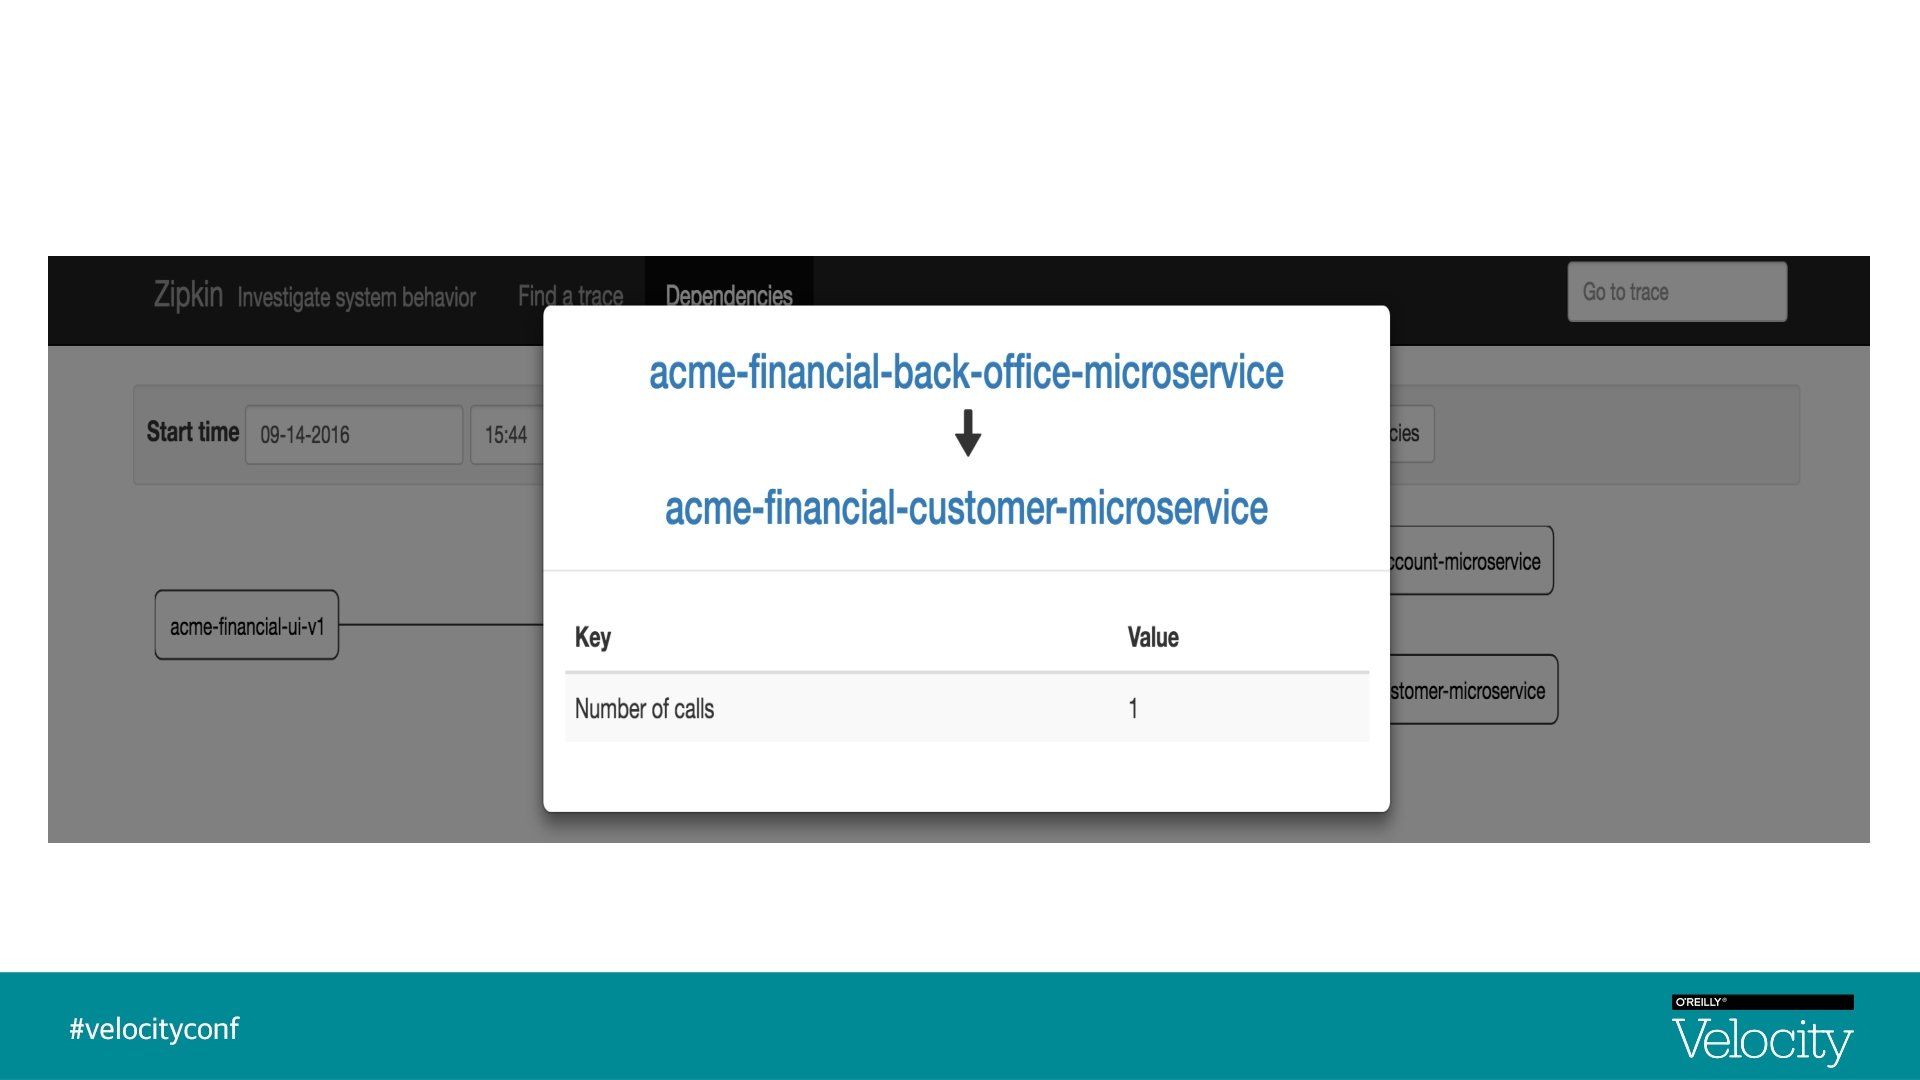
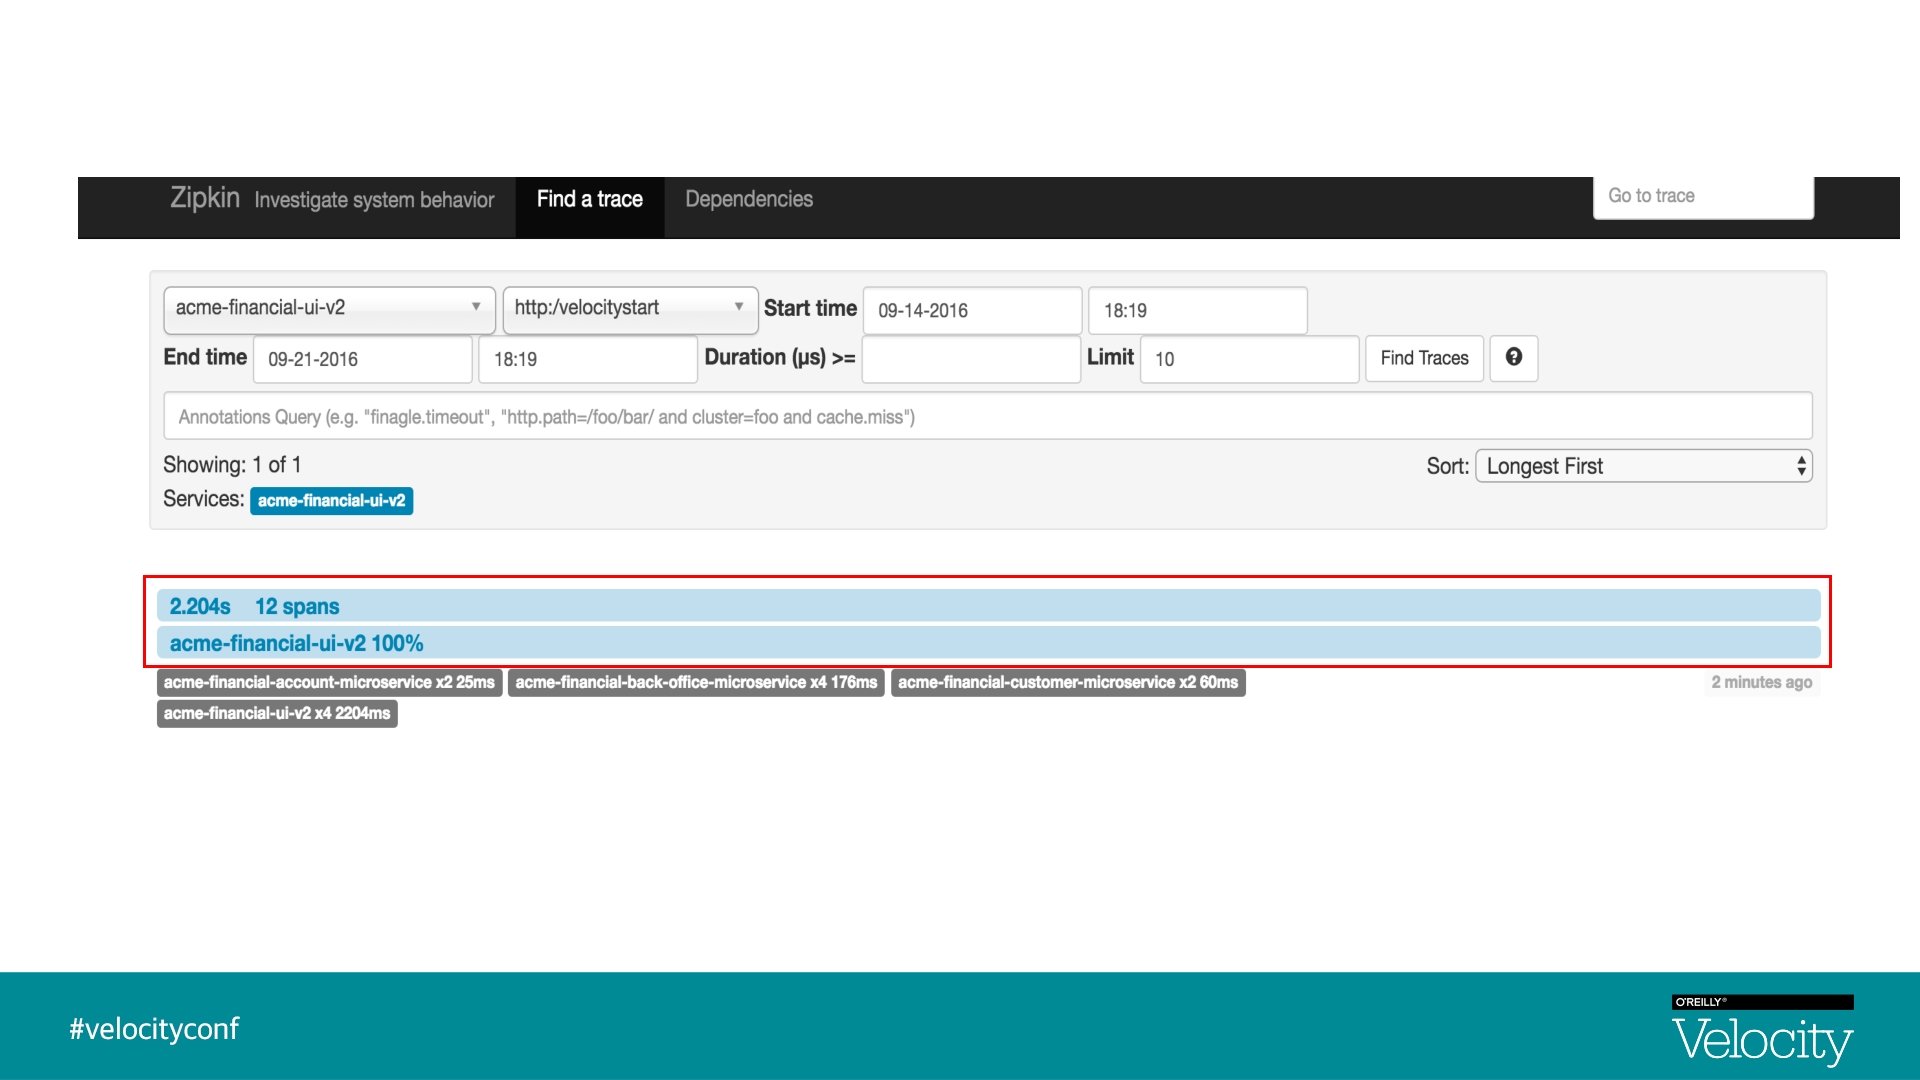
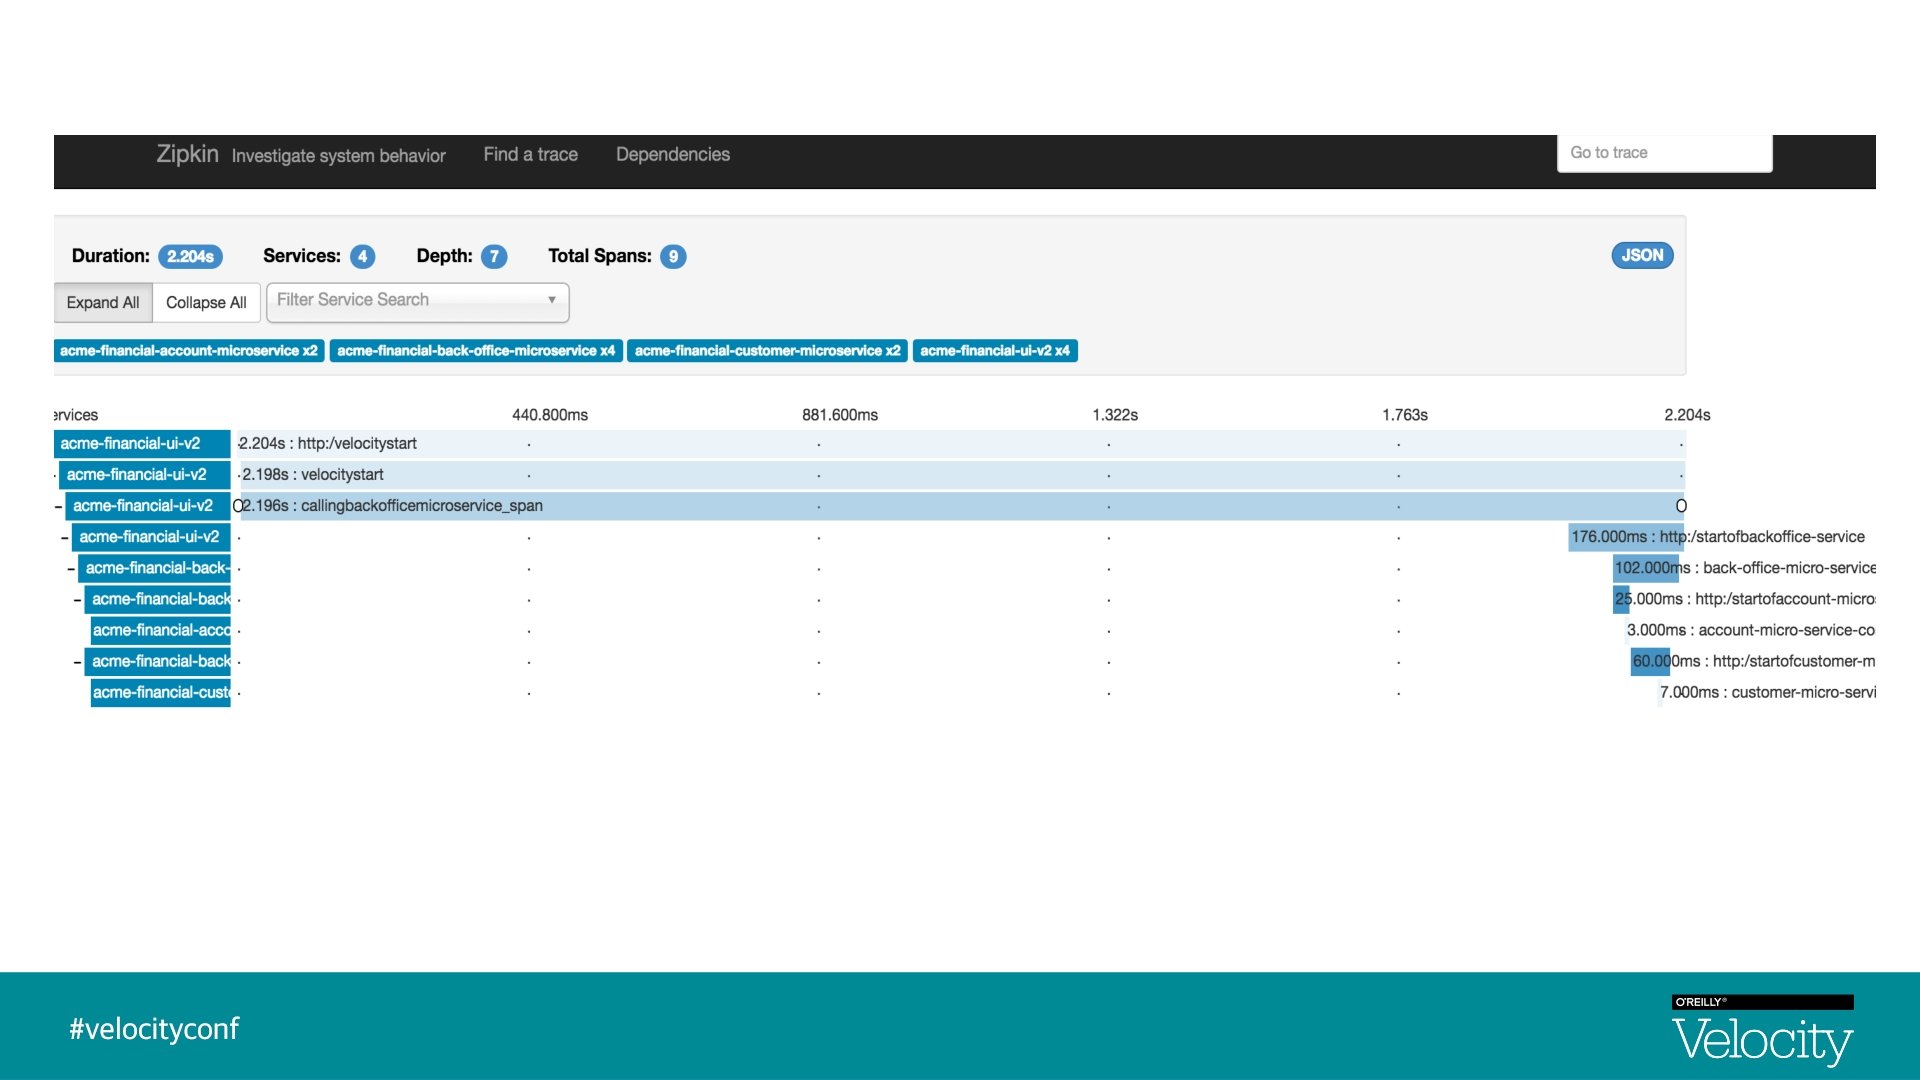
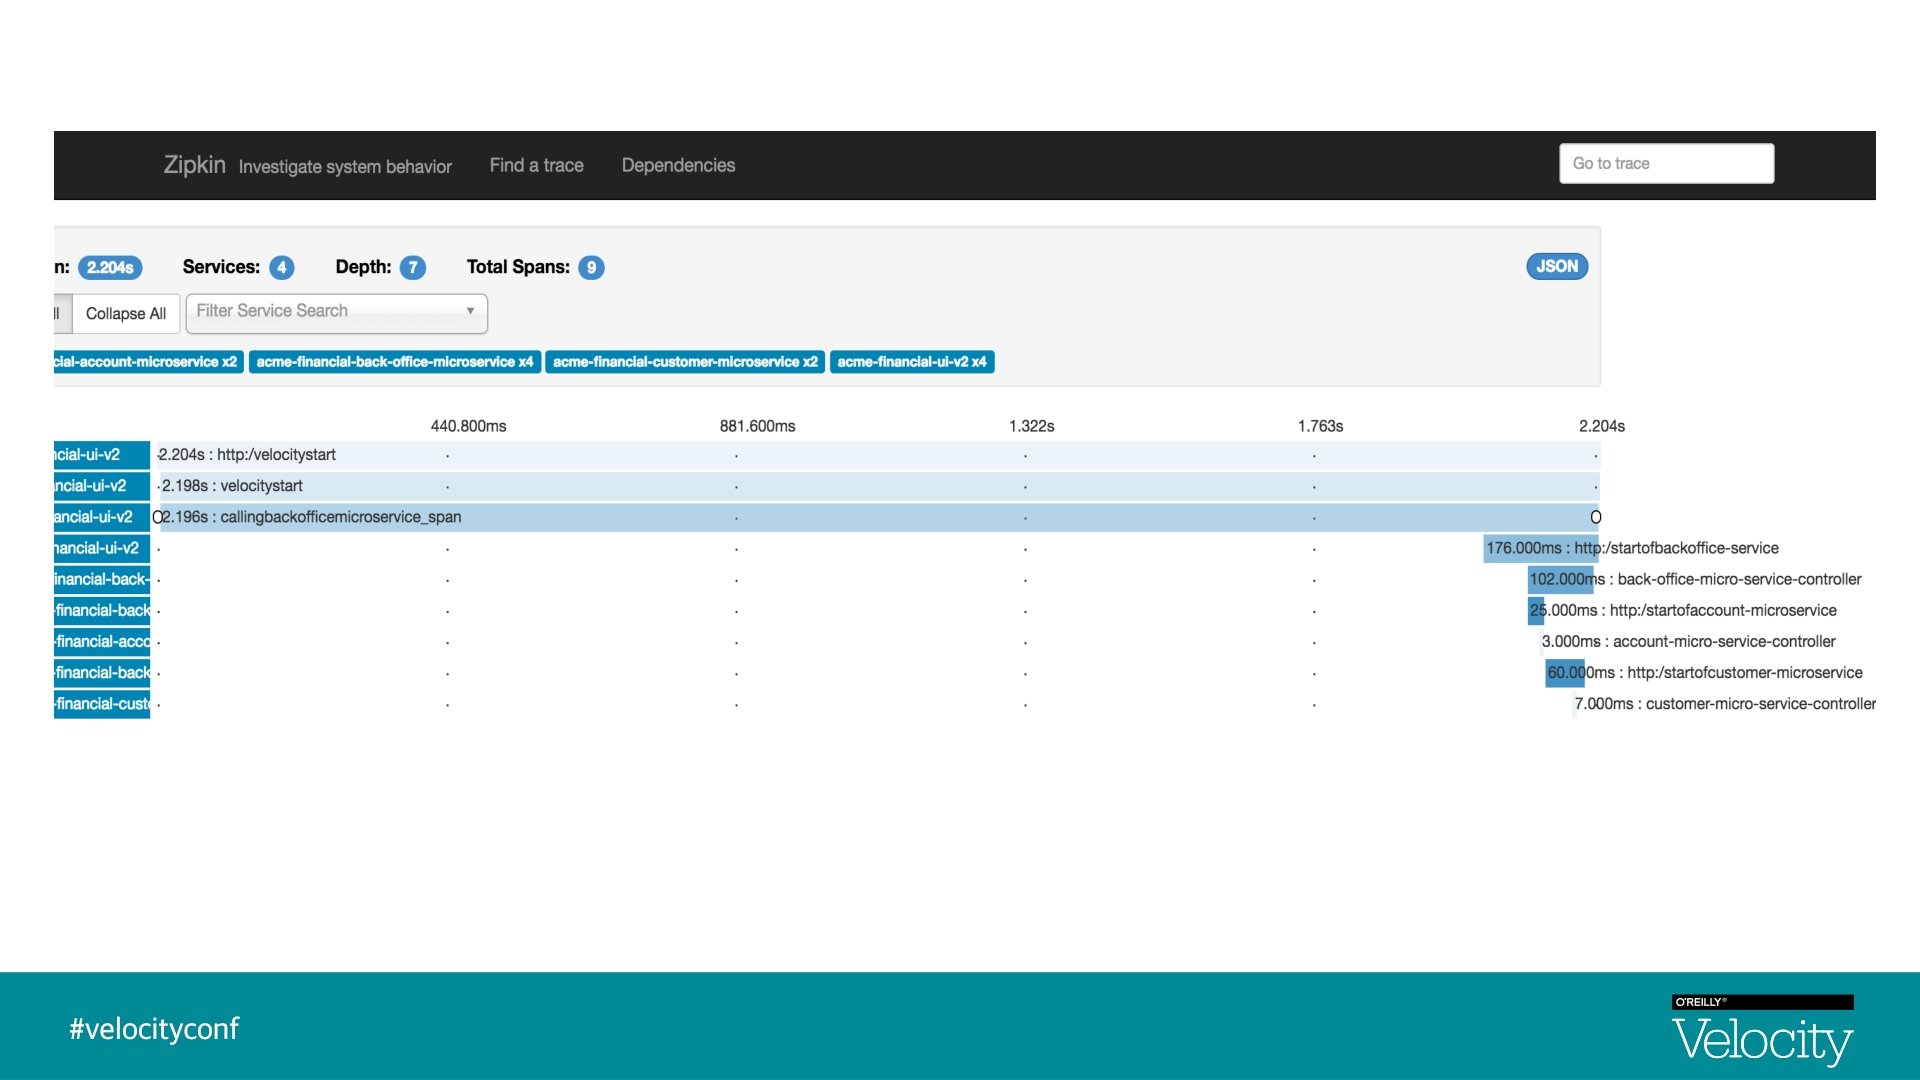
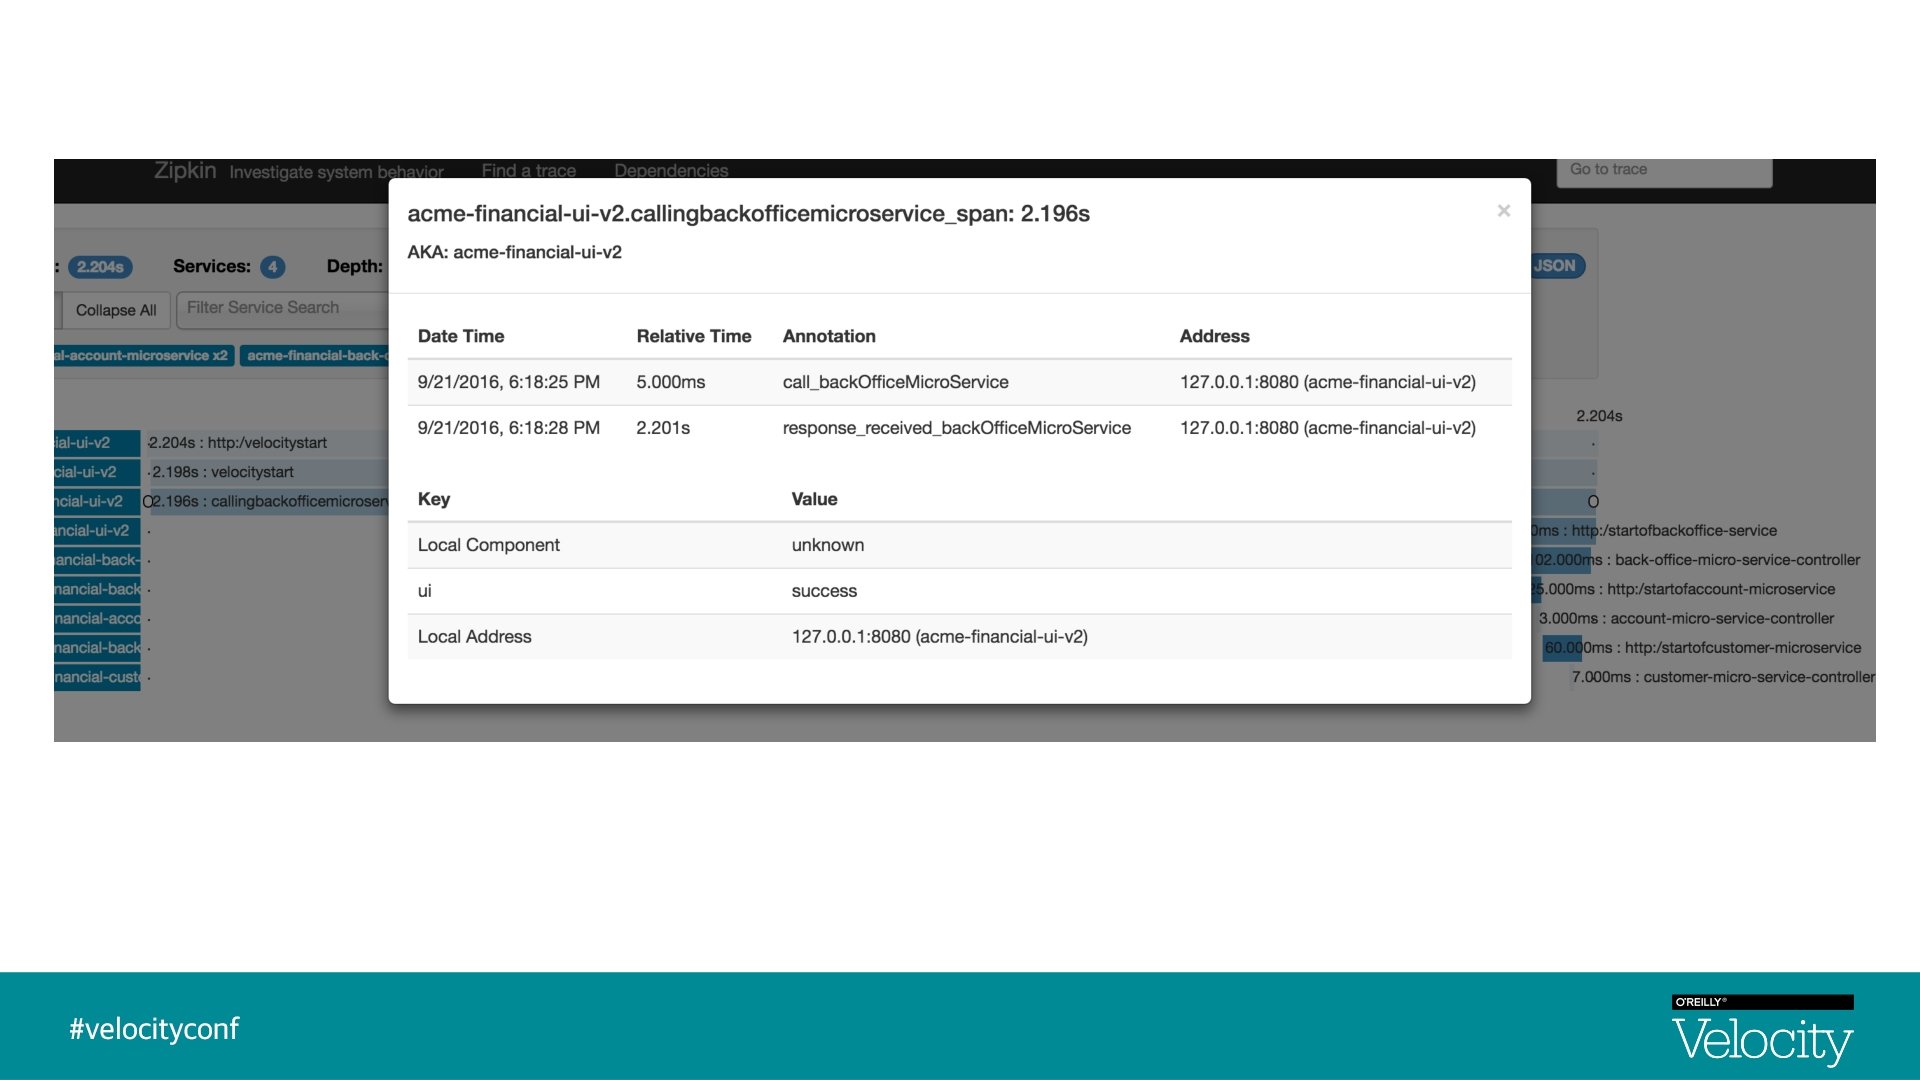
Distributed Tracing § Distributed Tracing is a process of collecting end-to-end transaction graphs in near real time § A trace represents the entire journey of a request § A span represents single operation call § Distributed Tracing Systems are often used for this purpose. Zipkin is an example § As a request is flowing from one microservice to another, tracers add logic to create unique trace Id, span Id

Visualization - Traces & Spans UI Trace Id : 1, Span Id : 1 Back-Office-Microservice Trace Id : 1, Parent Id : 1, Span Id : 2 Customer-Microservice Account-Microservice Trace Id : 1, Parent Id : 2, Span Id : 4 Trace Id : 1, Parent Id : 2, Span Id : 5

Dapper Paper By Google This paper described Dapper, which is Google’s production distributed systems tracing infrastructure Design Goals : Low overhead Application-level transparency @reshmi 9 k Scalability @reshmi 9 k

Zipkin § Zipkin is a distributed tracing system § Implementation based on Dapper paper, Google § Aggregate spans into trace trees § Manages both collection and lookup of the data § In 2015, Open. Zipkin became the primary fork

Initial Zipkin Architecture

Tracers § § § Tracers add logic to create unique trace ID Trace ID is generated when the first request is made Span ID is generated as the request arrives at each microservice Example tracer is Spring Cloud Sleuth Tracers execute in your production apps! They are written to not log too much Tracers have instrumentation or sampling policy

Demo : Architecture Diagram Transport Mq/Http/Log APP Spring Cloud Sleuth ZIPKIN Zipkin UI Collector Query Server Span Store

Let’s look at some code & Demo
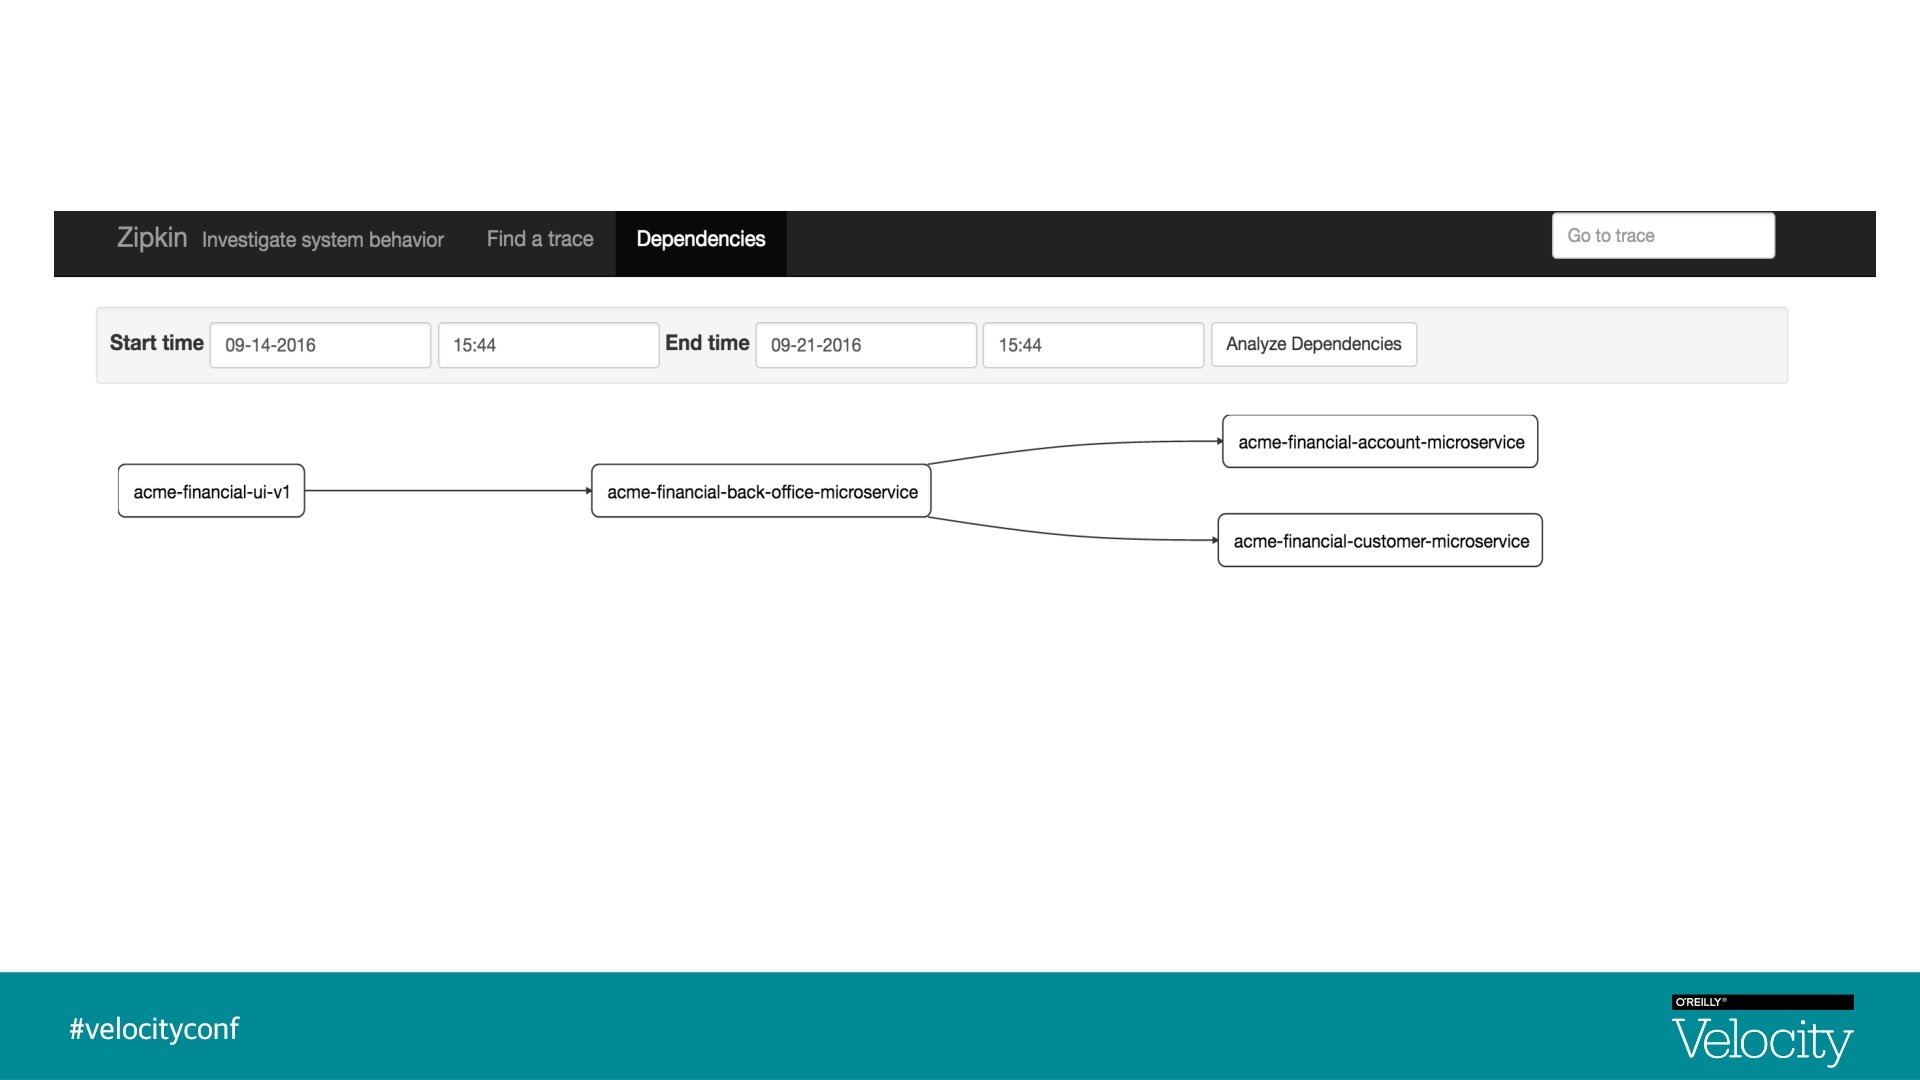
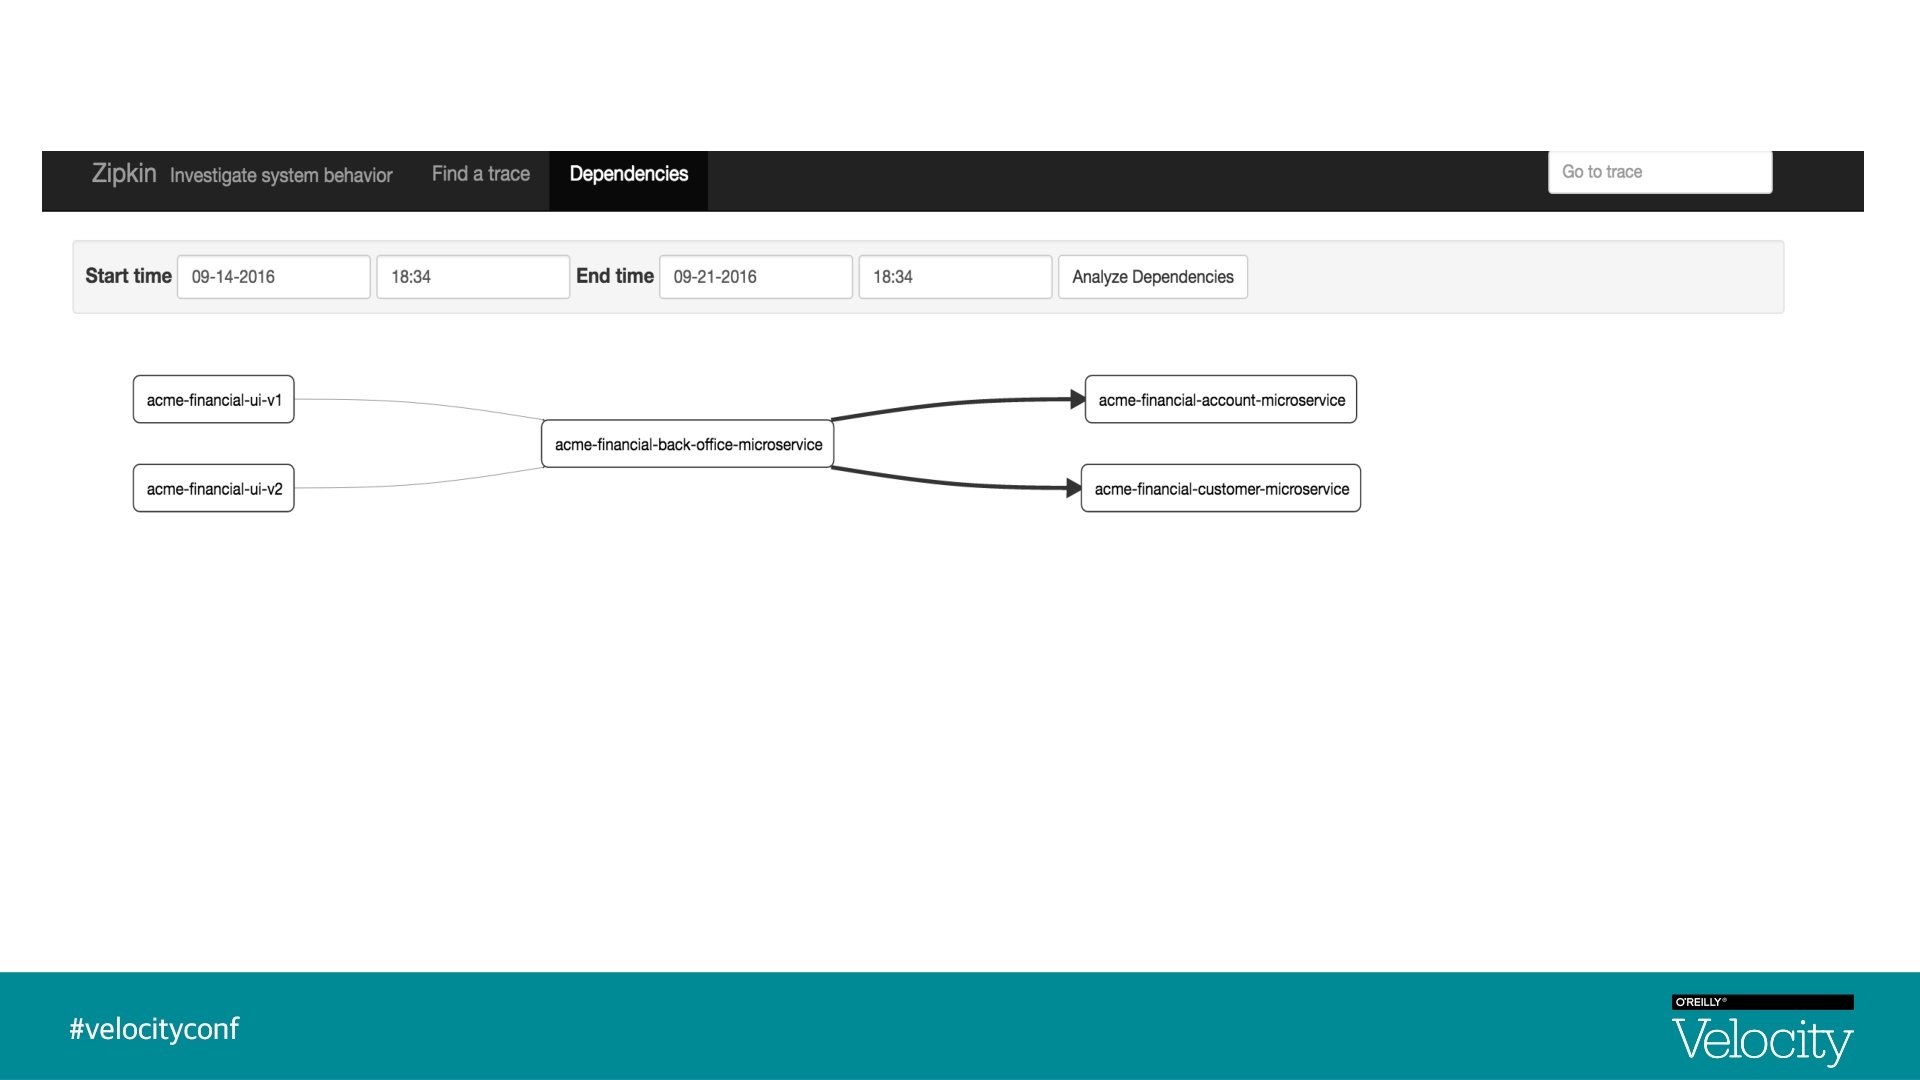

Summary § Distributed tracing allows you to quickly see latency issues in your system § Zipkin is a great tool to visualize the latency graph and system dependencies § Spring Cloud Sleuth integrates with Zipkin and grants you log correlation § Log correlation allows you to match logs for a given trace § Pivotal Cloud Foundry makes integration of your apps and Spring Cloud Sleuth and Zipkin easier

Links § Dapper, Google : http: //research. google. com/pubs/pub 36356. html § Code for this presentation : https: //github. com/reshmik/Distributed. Tracing. Demo_Velocity 2016. git § Sleuth’s documentation: http: //cloud. spring. io/spring-cloud-sleuth. html § Repo with Spring Boot Zipkin server: https: //github. com/openzipkin/zipkin-reporter-java. git § Zipkin deployed as an PCF : https: //github. com/reshmik/Zipkin/tree/master/spring-cloud-sleuthsamples/spring-cloud-sleuth-sample-zipkin-stream § Pivotal Web Services trial : https: //run. pivotal. io/ § Pivotal. Cloud. Foundry on your laptop : https: //docs. pivotal. io/pcf-dev/ @reshmi 9 k
- Slides: 26