
Distributed Solar Generation Final Presentation May 12 2017
Distributed Solar Generation Final Presentation – May 12, 2017 Laura Criste ● Josh Grant ● John Hoffman
Distributed Generation • Distributed generation is energy at the point of consumption • Common modes of generation include: • • • Solar photovoltaic (PV) Small wind turbine Combined heat and power Fuel cells Micro-turbines • Solar PV is the largest percentage of distributed generation • United Sates annual solar PV generation is currently about nine gigawatts and in the next few years, it is expected to exceed 20 gigawatts 2
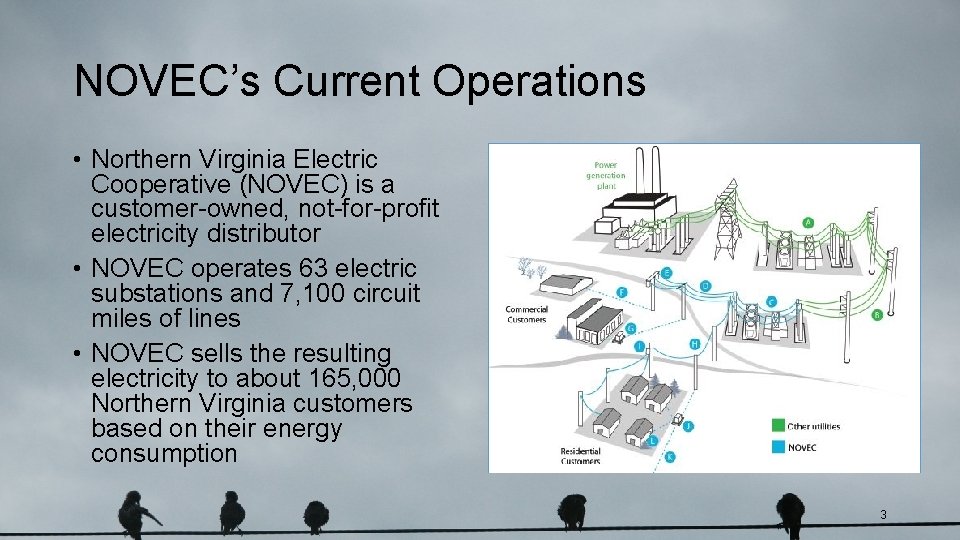
NOVEC’s Current Operations • Northern Virginia Electric Cooperative (NOVEC) is a customer-owned, not-for-profit electricity distributor • NOVEC operates 63 electric substations and 7, 100 circuit miles of lines • NOVEC sells the resulting electricity to about 165, 000 Northern Virginia customers based on their energy consumption 3
NOVEC’s Current Operations • NOVEC recovers annual operating costs using a pricing structure that includes: • Flat fee to all customers • Distribution charge per kilowatt hour of energy used • Electricity use charge per kilowatt hour of energy used • Approximately 0. 1% of NOVEC’s customers use solar PV distributed generation • NOVEC’s pricing structure is currently the same for solar and non-solar customers 4
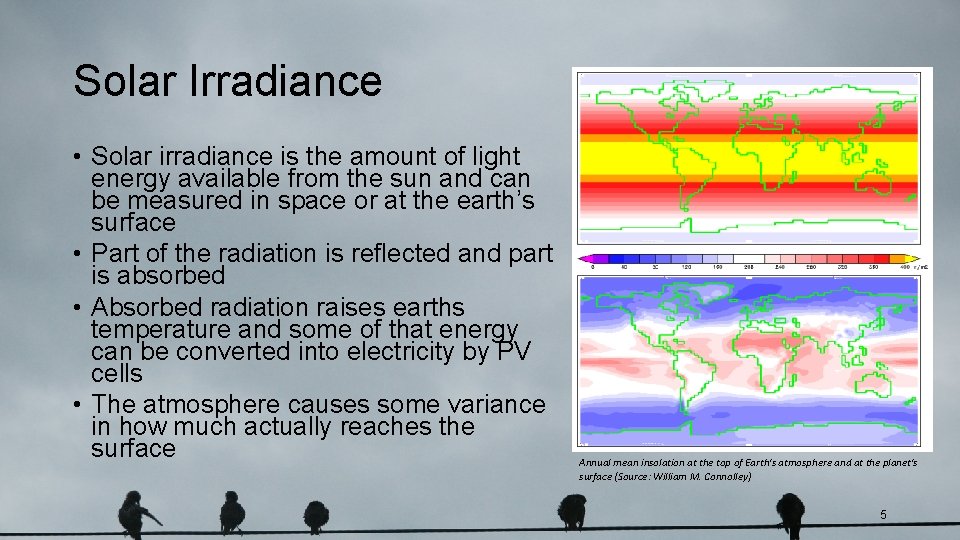
Solar Irradiance • Solar irradiance is the amount of light energy available from the sun and can be measured in space or at the earth’s surface • Part of the radiation is reflected and part is absorbed • Absorbed radiation raises earths temperature and some of that energy can be converted into electricity by PV cells • The atmosphere causes some variance in how much actually reaches the surface Annual mean insolation at the top of Earth's atmosphere and at the planet's surface (Source: William M. Connolley) 5
Solar Incentives • Historically, there have been tax incentives at the federal, state, and local government levels for residential solar panels • At the federal level there is a 30 percent solar investment tax credit for residential installation of solar panels through 2019, which drops to 26 percent in 2020, 22 percent in 2021, and then to no incentive • Prince William County offers a property tax exemption, which is good for five years as long as the solar equipment is operational during that year 6
Impact of Solar on NOVEC’s Operations • Customers who own solar panels complicate NOVEC’s operations • Panels reduce the amount electricity that solar customers need from NOVEC • NOVEC buys back excess solar-generated energy at the cost it provides electricity • Energy generated from solar is unpredictable because it is based on irradiance, yet NOVEC must provide enough electricity to meet all customer needs at any time • NOVEC expects an increase in solar customers due to the interest in renewable energies and decreasing solar costs, which would intensify the problem • NOVEC will see reduced revenue without a change in price structure 7
Problem Statement • Cost to operate and maintain a reliable electric grid should be recovered in a way that is fair to all who utilize and rely on its power • Solar customers reduce their total purchased electricity from the grid, but are still fully dependent on it and add operational requirements • Under the current pricing structure, the reduction in purchased electricity due to solar generation is passed onto non-solar customers • By evaluating how solar and non-solar customers utilize the electric grid, we propose two methods of recovering costs in a more balanced way 8
Problem Scope • Ensures NOVEC meets the operational and financial requirements of a healthy utility provider • Does not discourage NOVEC customers from supplementing power requirements through the installation of solar panels • Includes recommendations at different solar penetration levels (one, three, five, 10, 15, and 20 percent) • Focuses on cost of energy distribution, not cost of energy itself • Focuses on residential customers, not commercial 9
Assumptions • Operating costs will not change over time • Number of customers will remain steady • Solar users will not increase the size of their solar panels • The solar panels have a 17 percent efficiency • No storage (batteries) at point of generation • Data the team received is a good representation of all NOVEC customers • Not constrained by current legislative environment 10
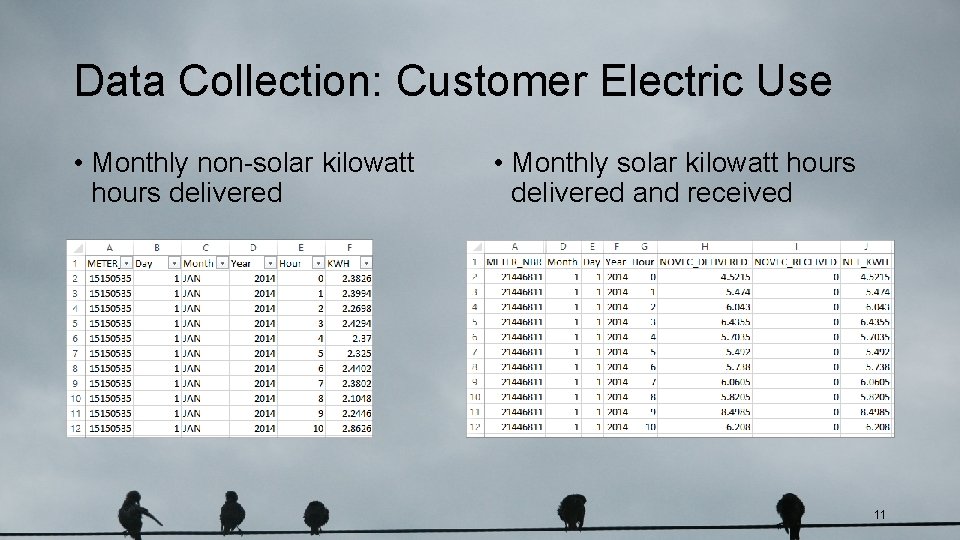
Data Collection: Customer Electric Use • Monthly non-solar kilowatt hours delivered • Monthly solar kilowatt hours delivered and received 11
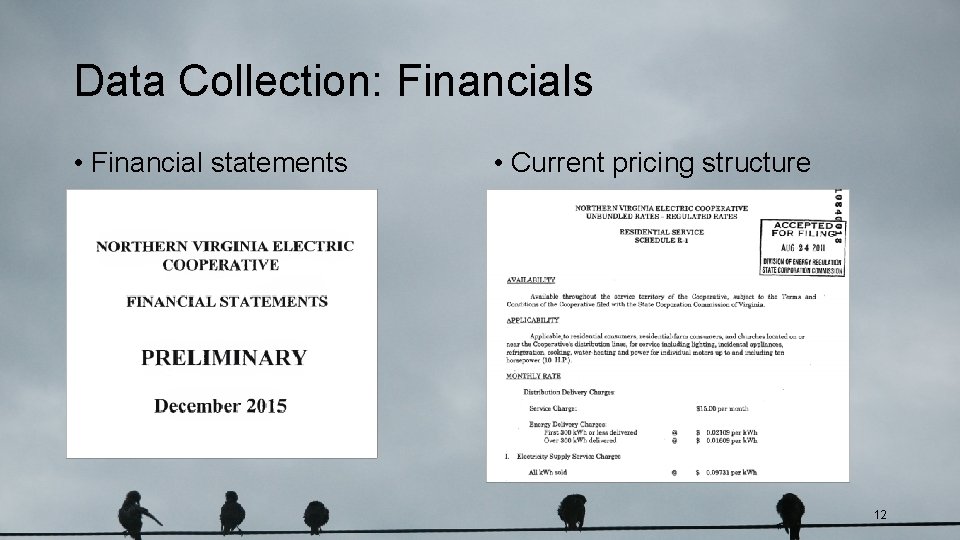
Data Collection: Financials • Financial statements • Current pricing structure 12
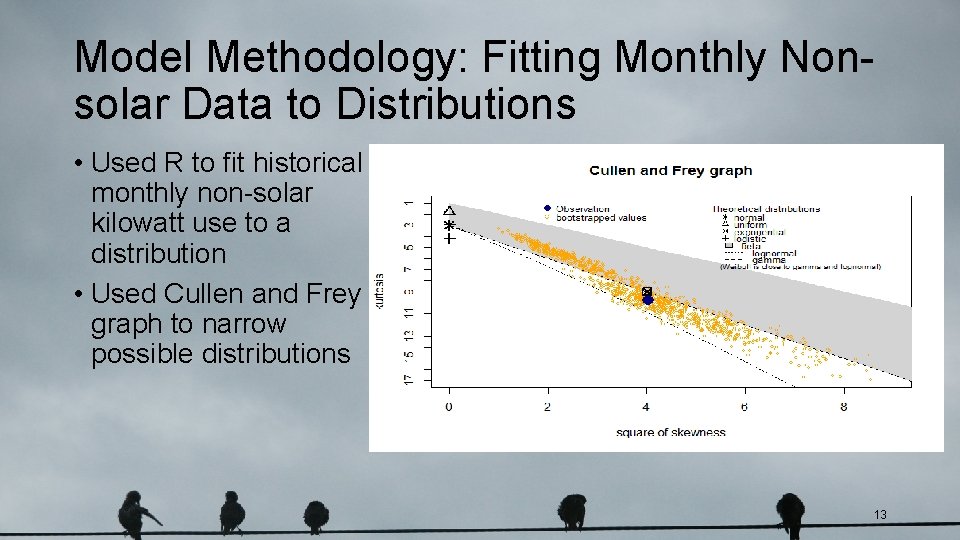
Model Methodology: Fitting Monthly Nonsolar Data to Distributions • Used R to fit historical monthly non-solar kilowatt use to a distribution • Used Cullen and Frey graph to narrow possible distributions 13
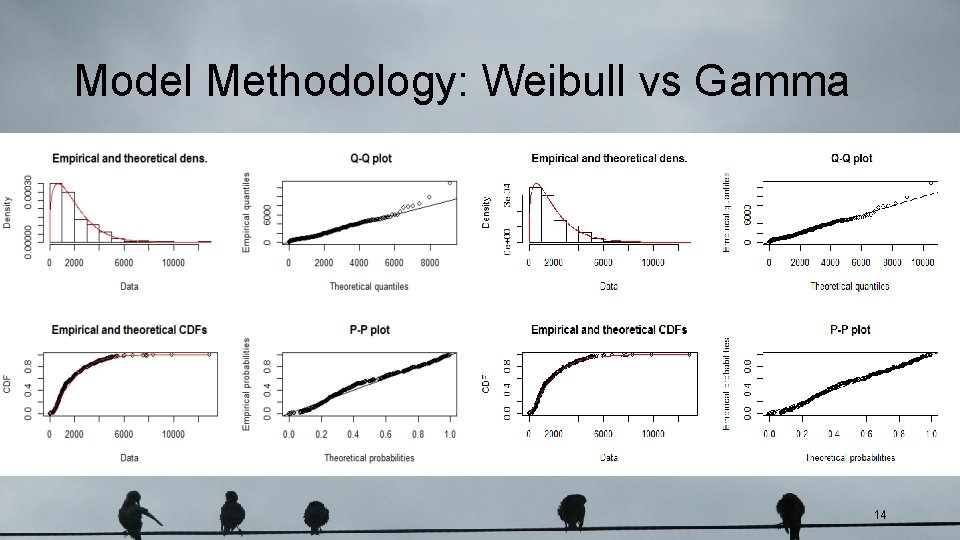
Model Methodology: Weibull vs Gamma 14
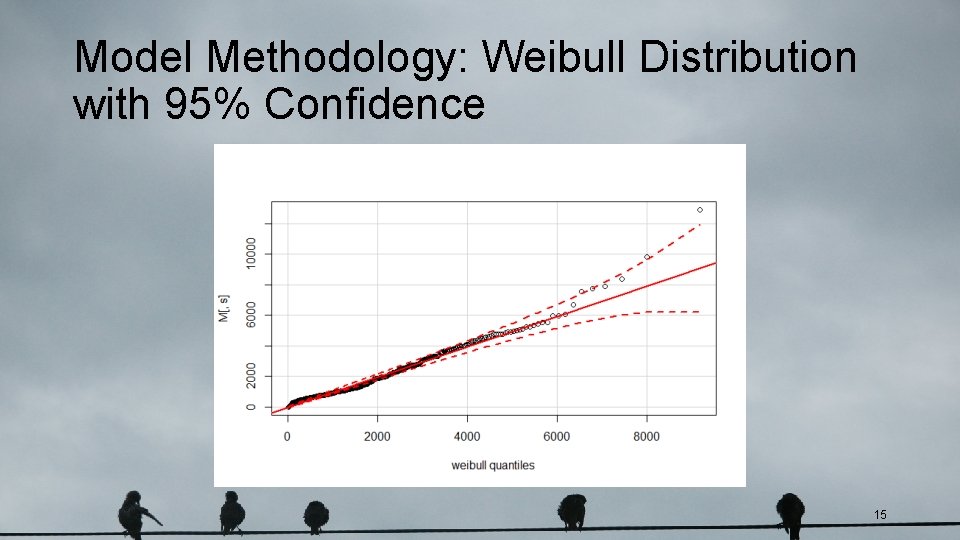
Model Methodology: Weibull Distribution with 95% Confidence 15
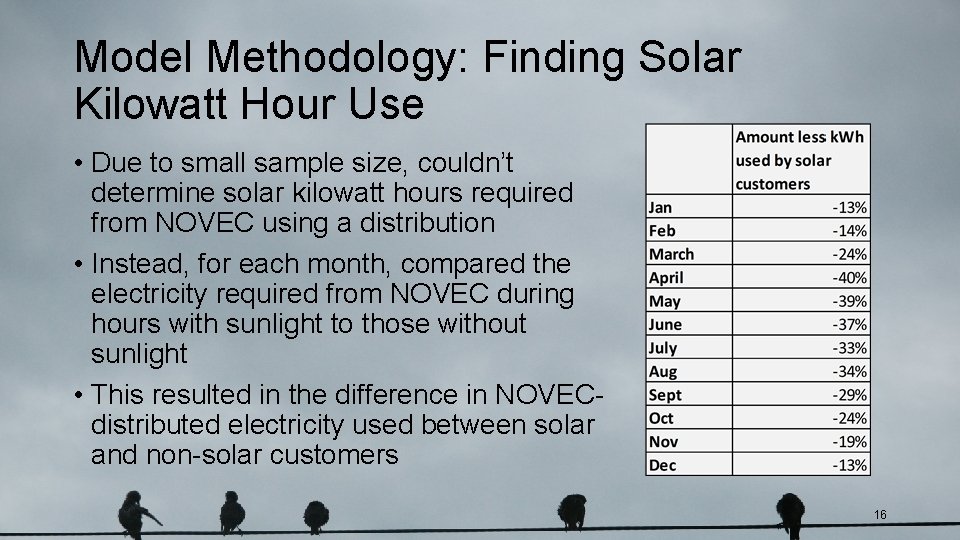
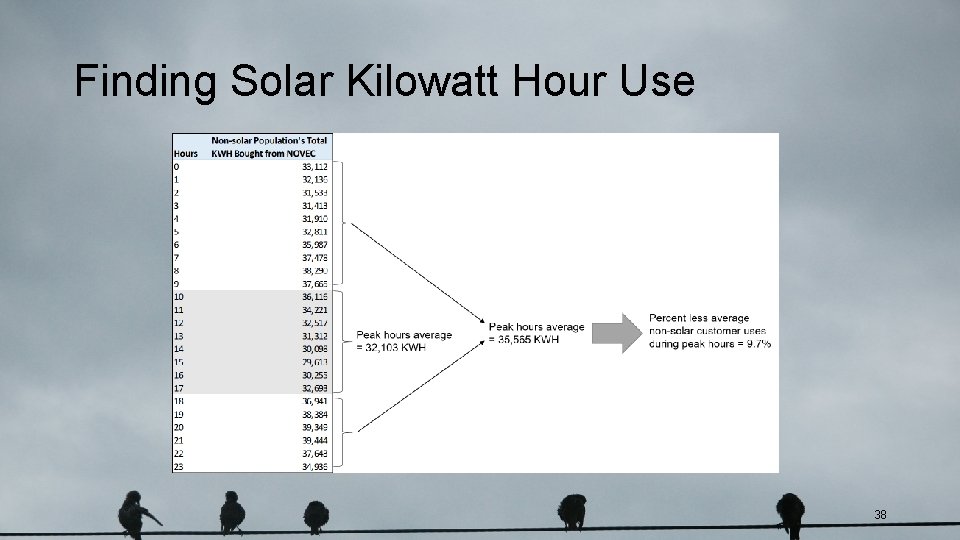
Model Methodology: Finding Solar Kilowatt Hour Use • Due to small sample size, couldn’t determine solar kilowatt hours required from NOVEC using a distribution • Instead, for each month, compared the electricity required from NOVEC during hours with sunlight to those without sunlight • This resulted in the difference in NOVECdistributed electricity used between solar and non-solar customers 16
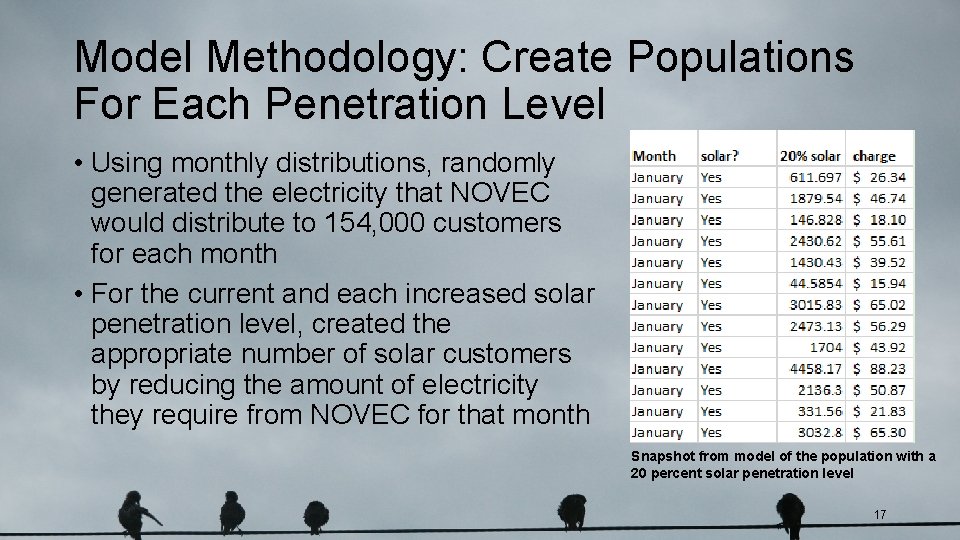
Model Methodology: Create Populations For Each Penetration Level • Using monthly distributions, randomly generated the electricity that NOVEC would distribute to 154, 000 customers for each month • For the current and each increased solar penetration level, created the appropriate number of solar customers by reducing the amount of electricity they require from NOVEC for that month Snapshot from model of the population with a 20 percent solar penetration level 17
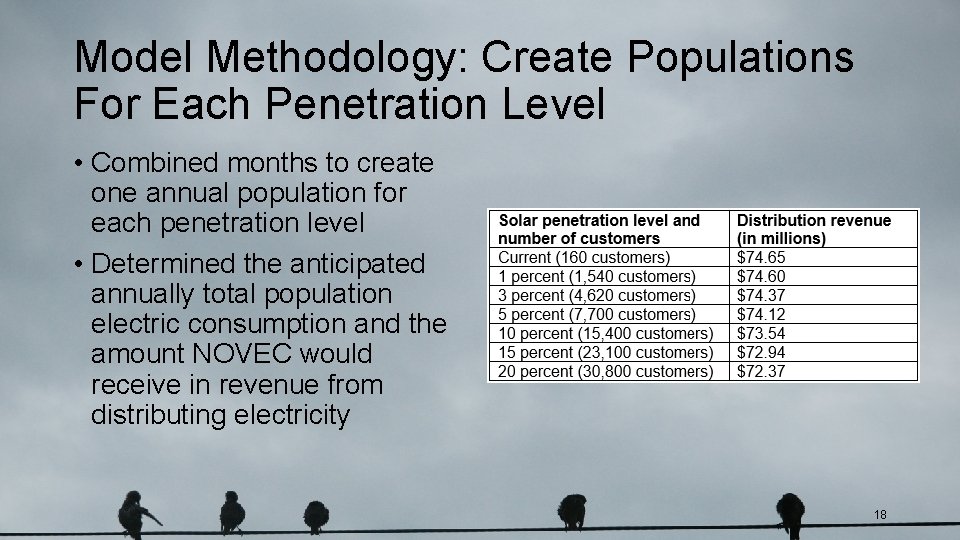
Model Methodology: Create Populations For Each Penetration Level • Combined months to create one annual population for each penetration level • Determined the anticipated annually total population electric consumption and the amount NOVEC would receive in revenue from distributing electricity 18
Model Methodology: Changing the Pricing Structure • Increase the flat fee • Increase per k. Wh distribution rates • Charge solar customers a higher distribution rate that covers the loss in distribution revenue • Charge solar customers to distribute excess solar back to NOVEC at same rate electricity is delivered to them and if costs are not covered, increase distribution rate for all customers 19
Results: Two Fair Ways To Recover NOVEC’s Costs 1. Solar covers the decrease in 2. Solar pays to distribute distribution revenue with an excess energy back to increase in pricing structure NOVEC Any remaining lost revenue is equally distributed across all customers, solar and non -solar In both methods, solar customers have a different pricing structure from non-solar customers 20
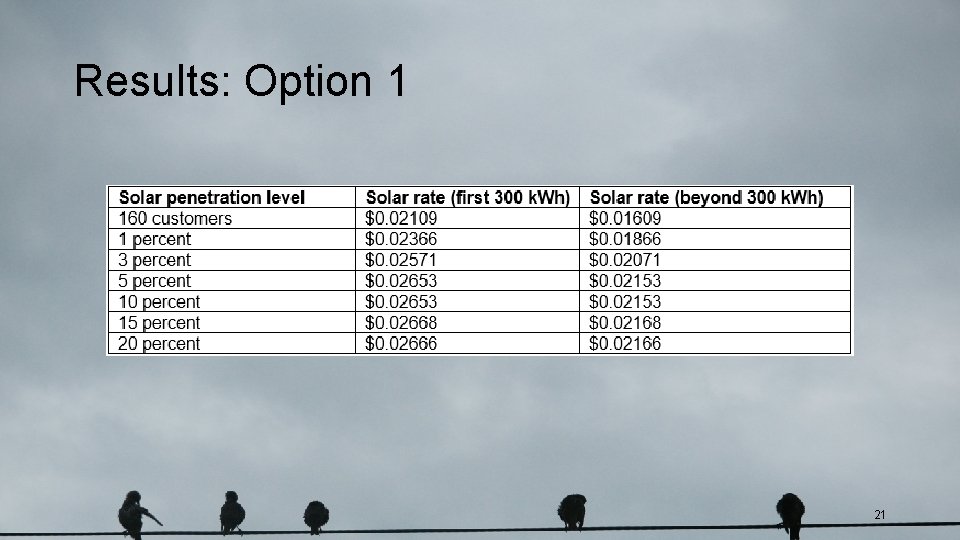
Results: Option 1 21
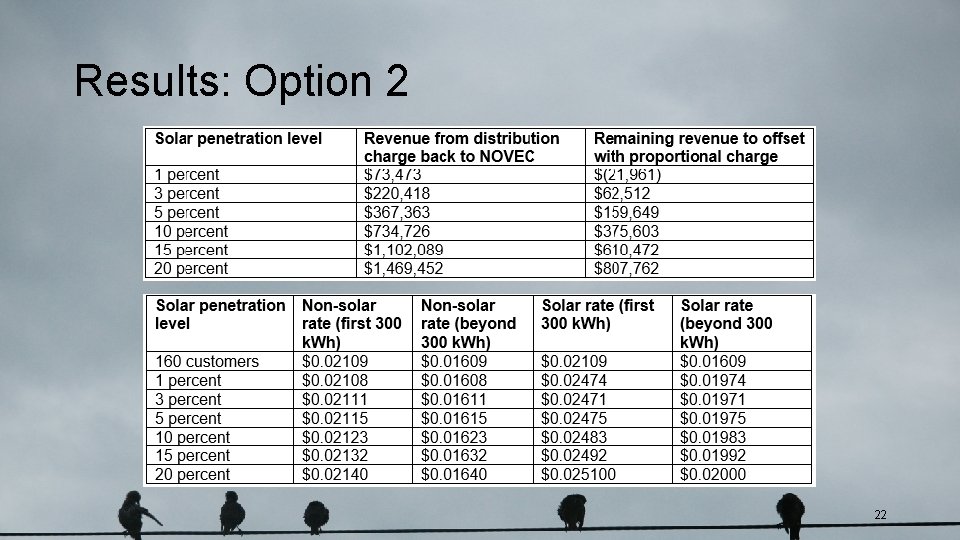
Results: Option 2 22
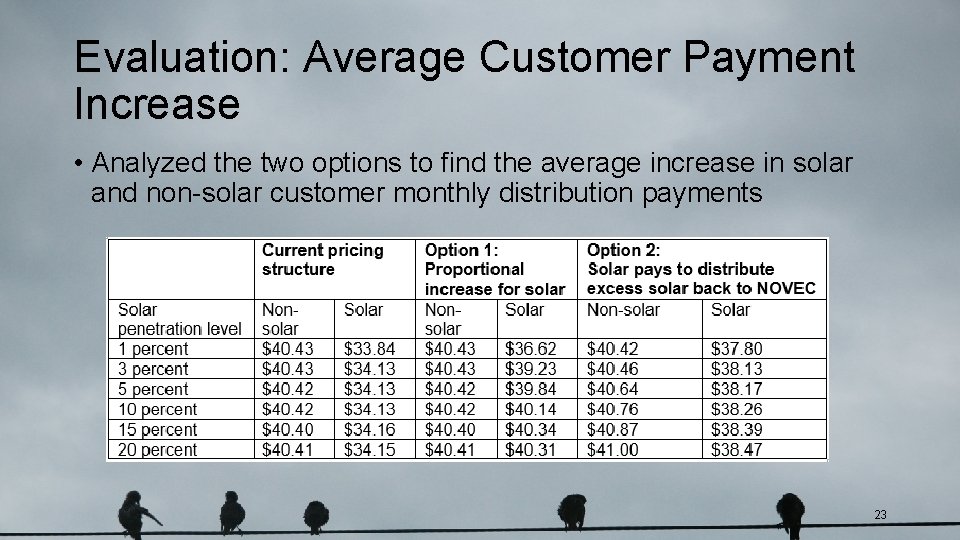
Evaluation: Average Customer Payment Increase • Analyzed the two options to find the average increase in solar and non-solar customer monthly distribution payments 23
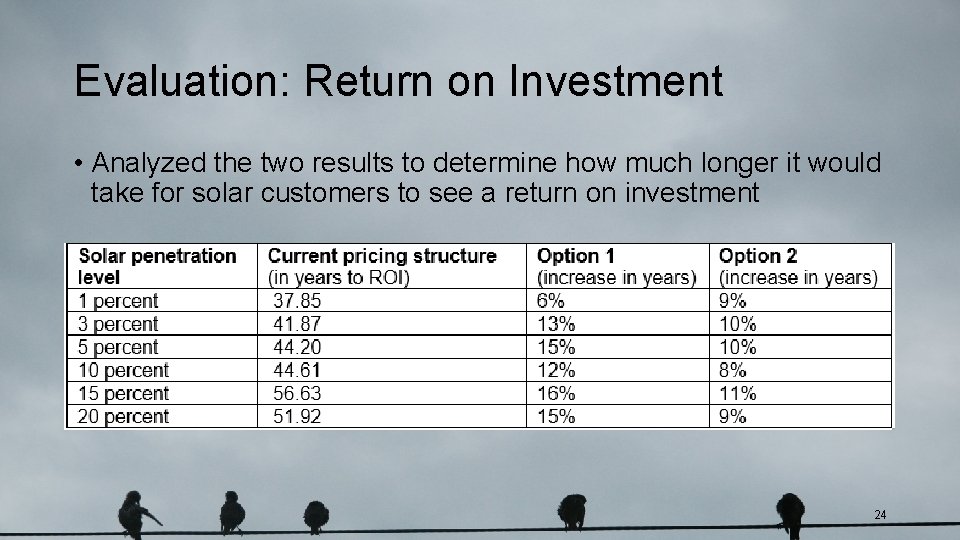
Evaluation: Return on Investment • Analyzed the two results to determine how much longer it would take for solar customers to see a return on investment 24
Sensitivity Analysis • One of our stated assumptions was that our solar users are using solar panels that are 17 percent efficient • For our first sensitivity analysis we decided to see how solar users having more efficient solar panels going forward would impact our model • The sensitivity analysis are the last of our analysis work, and we’ll be looking to expand improve over the next few days 25
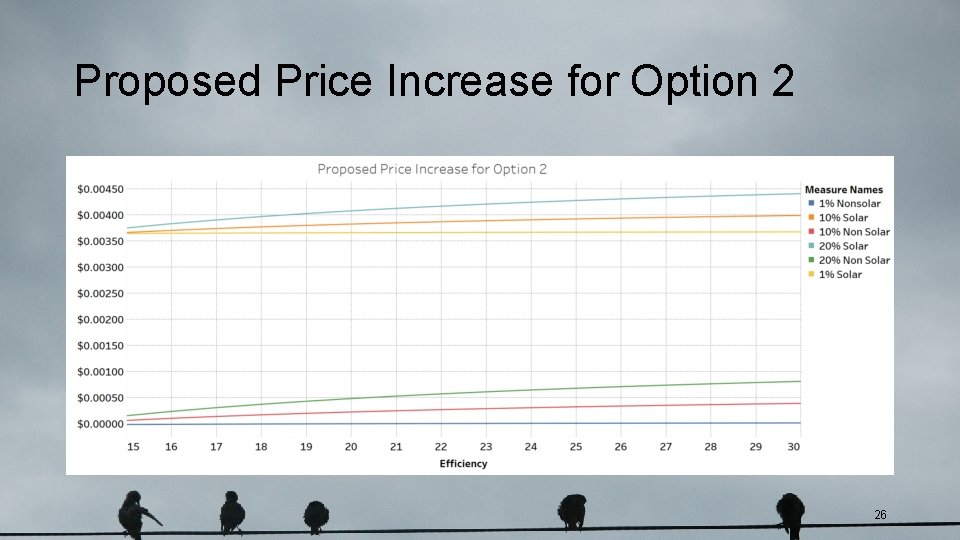
Proposed Price Increase for Option 2 26
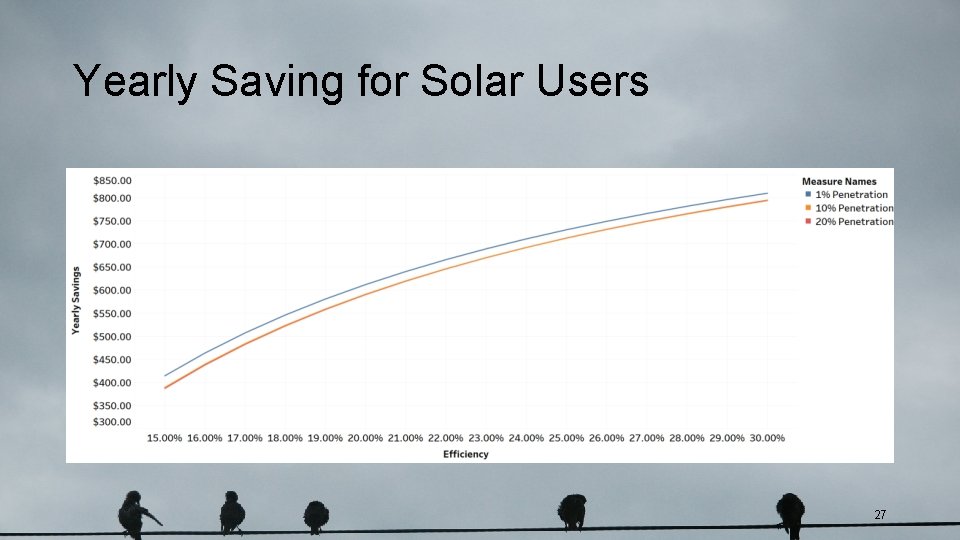
Yearly Saving for Solar Users 27
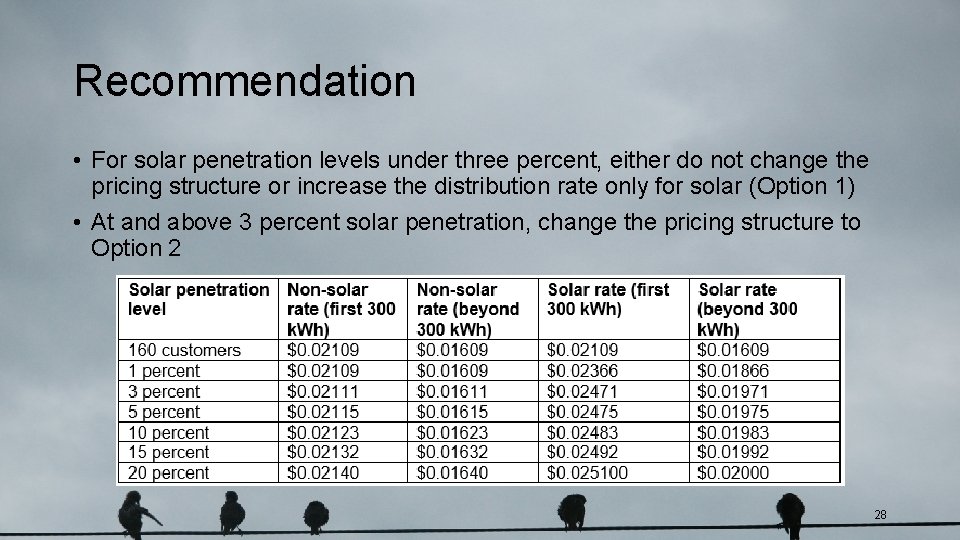
Recommendation • For solar penetration levels under three percent, either do not change the pricing structure or increase the distribution rate only for solar (Option 1) • At and above 3 percent solar penetration, change the pricing structure to Option 2 28
Limitations • Sample data wasn’t a good representation of total population • Received about three years worth of data for 450 non-solar customers and 38 solar customers • Sample population led to a distribution that used 13 percent more kilowatt hours annually than residential totals (the difference ranged from 15 percent less and 41 percent more depending on the month) • Non-solar data consisted of almost 4 million entries, which made the data difficult to work with in Excel • Had to move the data to R in order to sort, filter and clean up the data • Not all teammates had the technical expertise to use R 29
Future Work • Separate solar population into different groups based on solar use to explore charging each group a different rate • Explore residential customers buying larger solar panels that produce more energy • Study customers being able to store excess solar energy • Determine the impact if NOVEC isn’t required by law to buy back excess solar energy • Complete analysis using data for all residential customers • Convert Excel files into a database 30
Acknowledgements • Robert Bisson, NOVEC’s Vice President Electric System Development • Angie Thomas, NOVEC Manager, Forecasting and NERC Compliance & Business Systems • Kevin Whyte, NOVEC Manager, Distribution Engineering • Dr. Kathryn Laskey, George Mason University Professor and Capstone Project Instructor • Spring 2017 SEOR Capstone Class 31

Questions? 32
33
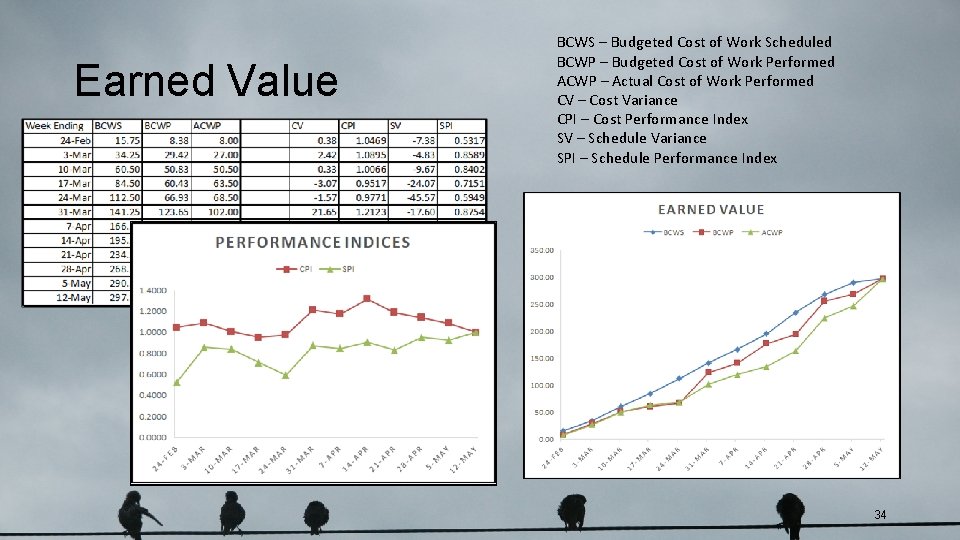
Earned Value BCWS – Budgeted Cost of Work Scheduled BCWP – Budgeted Cost of Work Performed ACWP – Actual Cost of Work Performed CV – Cost Variance CPI – Cost Performance Index SV – Schedule Variance SPI – Schedule Performance Index 34
Roles and Responsibilities • John • Project Manager • Lead researcher • Website designer • Josh • R guru • Sensitivity analyst • Lead data visualizer • Laura • Methodology developer • Data analyst • Lead communicator and presenter 35
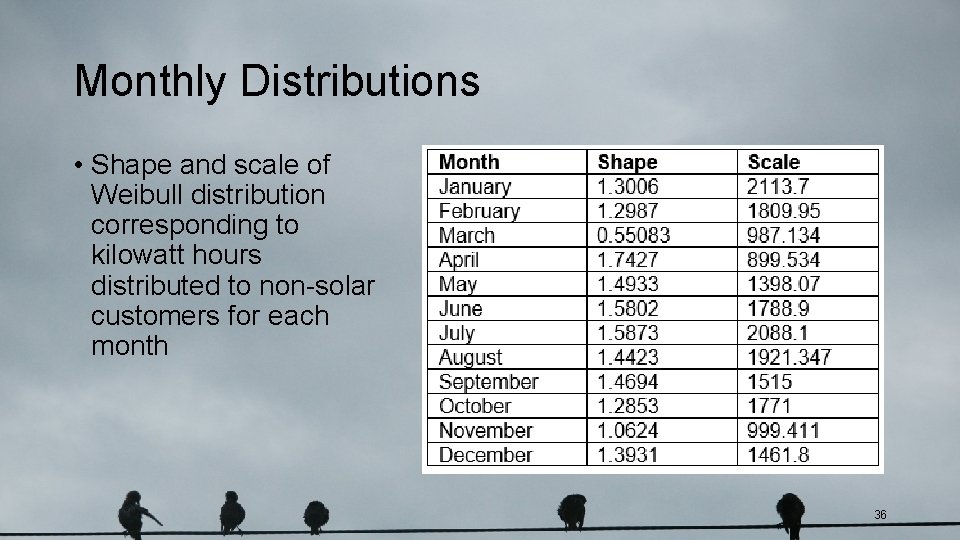
Monthly Distributions • Shape and scale of Weibull distribution corresponding to kilowatt hours distributed to non-solar customers for each month 36
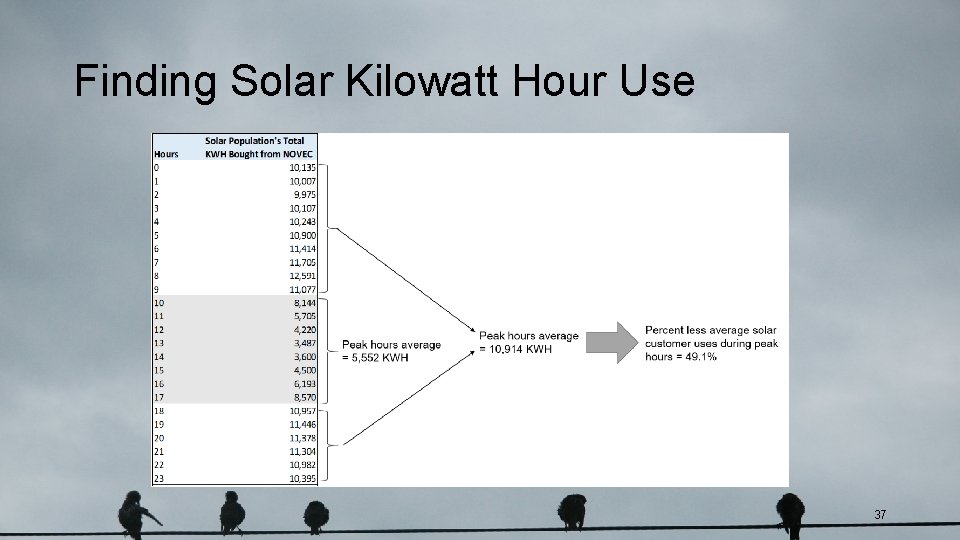
Finding Solar Kilowatt Hour Use 37
Finding Solar Kilowatt Hour Use 38
- Slides: 38