DistanceTime Graphs Variable Worksheet A The worksheet is

Distance-Time Graphs – Variable – Worksheet A The worksheet is in 3 sizes.

Printing To print handouts from slides Select the slide from the left. Then click: File > Print > ‘Print Current Slide’ To print multiple slides Click on a section title to highlight all those slides, or press ‘Ctrl’ at the same time as selecting slides to highlight more than one. Then click: File > Print > ‘Print Selection’ To print double-sided handouts Highlight both slides before using ‘Print Selection’. Choose ‘Print on Both Sides’ and ‘Flip on Short Edge’.
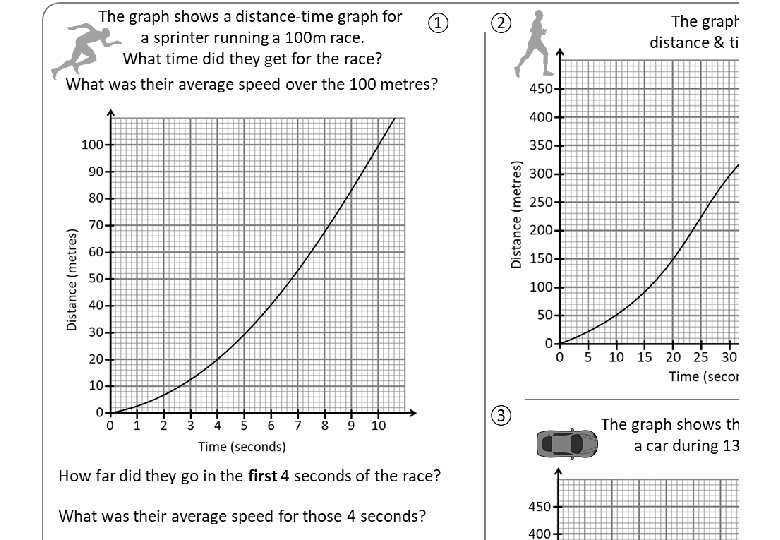

The graph shows a distance-time graph for ① a sprinter running a 100 m race. What time did they get for the race? What was their average speed over the 100 metres? ② The graph shows a runner’s distance & time over a 400 m race. Distance-Time Graphs Average speed over the race = ______ Av. speed for first 20 seconds = ______ Av. speed for last 10 seconds = ______ When do they stop running? ______ Estimate when the runner was going the fastest. ______ ③ How far did they go in the first 4 seconds of the race? The graph shows the distance travelled by a car during 13 seconds of a race. Why is the car changing speed? ______ What was their average speed for those 4 seconds? What is the car’s av. speed? ______ How far did they go in the last 4 seconds of the race? What is the car’s top speed? ______ What was their average speed for those 4 seconds? Why is the sprinter slower at the beginning of the race? How can you see this in a distance-time graph? Estimate when the car is travelling the slowest ______ Draw a straight line to estimate the car’s speed at 15 seconds. ______

The graph shows a distance-time graph for ① ② a sprinter running a 100 m race. What time did they get for the race? 10 seconds What was their average speed over the 100 metres? The graph shows a runner’s distance & time over a 400 m race. 100 m ÷ 10 s = 10 m/s Distance-Time Graphs Average speed over the race = ______ Av. speed for first 20 seconds = ______ Av. speed for last 10 seconds = ______ When do they stop running? ______ Estimate when the runner was going the fastest. ______ ③ How far did they go in the first 4 seconds of 20 themrace? What was their average speed for those 4 seconds? 5 m/s How far did they go in the last 4 seconds of 60 themrace? What was their average speed for those 4 seconds? 15 m/s Why is the sprinter slower at the beginning of the race? How can you see this in a distance-time graph? They need to accelerate (increase speed). The gradient is lower. The graph shows the distance travelled by a car during 13 seconds of a race. Why is the car changing speed? ______ What is the car’s av. speed? ______ What is the car’s top speed? ______ Estimate when the car is travelling the slowest ______ Draw a straight line to estimate the car’s speed at 15 seconds. ______

The graph shows a distance-time graph for ① ② a sprinter running a 100 m race. What time did they get for the race? 10 seconds What was their average speed over the 100 metres? The graph shows a runner’s distance & time over a 400 m race. Distance-Time Graphs Average speed over the race = ______ 400 m ÷ 45 s = 8. 9 m/s 100 m ÷ 10 s = 10 m/s Av. speed for first 20 seconds = ______ 150 m ÷ 20 s = 7. 5 m/s Av. speed for last 10 seconds = ______ 50 m ÷ 10 s = 5 m/s When do they stop running? ______ 60 seconds Estimate when the runner was going the fastest. ______ 25 -30 seconds ③ The graph shows the distance travelled by a car during 13 seconds of a race. How far did they go in the first 4 seconds of 20 themrace? 500 m ÷ 13 s = 38. 5 m/s What is the car’s top speed? ______ How far did they go in the last 4 seconds of 60 themrace? 150 m ÷ 2 s = 75 m/s What was their average speed for those 4 seconds? 100 m 15 m/s They need to accelerate (increase speed). The gradient is lower. Slowing for a corner. What is the car’s av. speed? ______ What was their average speed for those 4 seconds? Why is the sprinter slower at the beginning of the race? How can you see this in a distance-time graph? Why is the car changing speed? ______ 6 seconds Estimate when the car is travelling the slowest ______ ≈ 14 -15 seconds Draw a straight line to estimate the car’s speed at 15 seconds. ______ ≈ 100 m ÷ 6 s = 16. 7 m/s

The graph shows a distance-time graph for ① a sprinter running a 100 m race. What time did they get for the race? What was their average speed over the 100 metres? ② The graph shows a runner’s distance & time over a 400 m race. Distance-Time Graphs Average speed over the race = ______ Av. speed for first 20 seconds = ______ Av. speed for last 10 seconds = ______ When do they stop running? ______ Estimate when the runner was going the fastest. ______ ③ How far did they go in the first 4 seconds of the race? The graph shows the distance travelled by a car during 13 seconds of a race. Why is the car changing speed? ______ What was their average speed for those 4 seconds? What is the car’s av. speed? ______ How far did they go in the last 4 seconds of the race? What is the car’s top speed? ______ What was their average speed for those 4 seconds? Why is the sprinter slower at the beginning of the race? How can you see this in a distance-time graph? Estimate when the car is travelling the slowest ______ Draw a straight line to estimate the car’s speed at 15 seconds. ______

Questions? Comments? Suggestions? …or have you found a mistake!? Any feedback would be appreciated . Please feel free to email: tom@goteachmaths. co. uk
- Slides: 10