DISSOCIATION CURVES Structure of haemoglobin As oxygen binds

DISSOCIATION CURVES

Structure of haemoglobin As oxygen binds to the haemoglobin it comes out of solution lowering the concentration and maintaining a good concentration gradient. This keeps it diffusing into the blood. There about 280 million haemoglobin molecules in a red blood cell. Each haem group associates with an oxygen molecule Hb + 4 O 2 ⇌ Hb. O 8 Animation re Hb structure and oxygen binding 1º to 4 º structure of haemoglobin

Oxygen dissociation curves Partial pressure in the muscle Partial pressure in the lungs

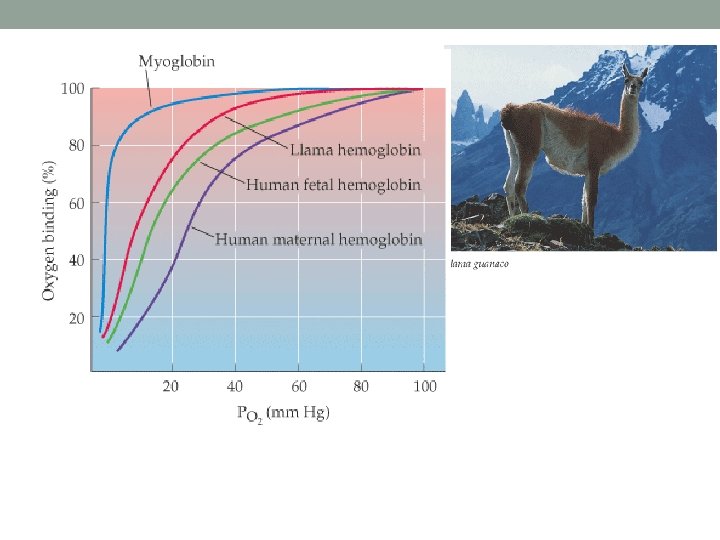
Myoglobin is a respiratory pigment similar to haemoglobin. It is located in muscles and acts as a reserve for oxygen.

Bohr shift

Why does the Bohr Shift occur? Carbon dioxide reacts with water forming carbonic acid CO₂ + H₂O H₂CO₃ The enzyme carbonic anhydrase catalyses this reaction H₂CO₃ dissociates into HCO₃ and H⁺ The H⁺ are picked up by the Haemoglobin molecules which then release their O₂ The HCO₃ diffuse out of the RBC and enter the plasma. Cl diffuses in to balance the charges. (Chloride shift)

EXPLANATION OF THE BOHR EFFECT

What about myoglobin?

Fetal haemoglobin

Different respiratory pigments in animals Decide whether the dissociation curve for each organism would be like A or B: Llama: lives at high altitude, reduced air pressure makes it hard to load O 2 onto Hb. Llama Hb must have a high affinity for oxygen. Mouse: loses heat rapidly (SA: V large) therefore has a high metabolic rate to generate heat; high O 2 demand from tissues, needs to unload O 2 quickly at tissues. Arenicola (annelid worm) lives in water logged burrows where p. O 2 is very low. Hb must have a high affinity for O 2. Pigeon: flight demands much energy therefore has a high metabolic rate. Hb must release O 2 readily at tissues Curves Quiz

Summary test Haemoglobin in humans is an example of a _1_. One molecules possesses a total of _2_ haem groups. Each haemoglobin molecule can carry a total of _3_ molecules of oxygen. The amount of oxygen present in a mixture of gases is known as the oxygen _4_ and the graph of the relationship between this and the amount of oxygen taken up by haemoglobin is called the _5_
- Slides: 12