Displaying Spatial Data Using Excel and Google Earth


 • Microsoft Office Excel • Earth")


- Slides: 8
Displaying Spatial Data Using Excel and Google Earth Bio. Quest 2010 Dan Ward & Sam Donovan
Goal • Develop a working classroom model of how to utilize Excel and Google Earth to display spatial data. • Have students work with real world data sets. • Allow students to engage in citizen science. • Propose and answer questions about abundance and distribution of organisms.
Spatial data can easily be displayed in Google Earth using Excel and readily available Internet tools.
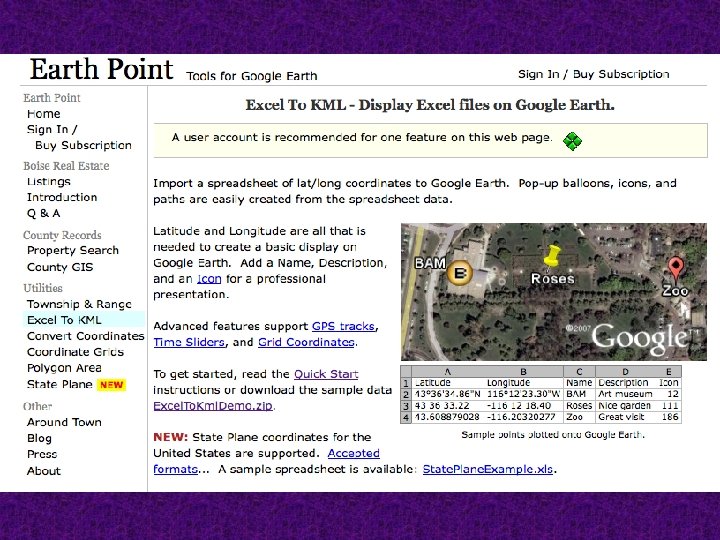
Resources • Google Earth (http: //earth. google. com/) • Microsoft Office Excel • Earth Point: Tools for Google Earth (http: //www. earthpoint. us/Excel. To. Kml. aspx) • Chicago Wilderness Habitat Project: Calling Frog Survey (http: //www. habitatproject. org/frogsurvey/inde x. html) • Chicago Wilderness Habitat Project: Illnois Butterfly Monitoring Network (http: //www. habitatproject. org/projects/ibmn. h tml)
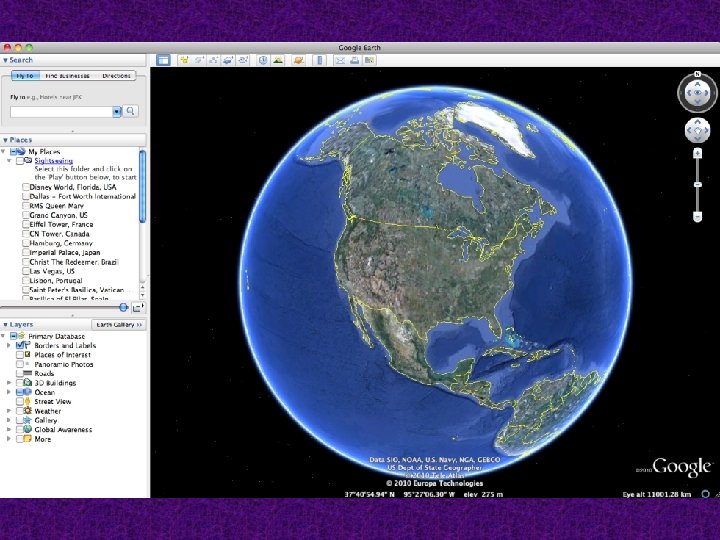
Google Earth • Free software that allows viewing of satellite imagery, maps, and terrain anywhere on Earth. • Rich in geographical and historical content.
Earth Point: Tools for Google Earth • Imports a spreadsheet of lat/long coordinates to Google Earth for viewing. • Also allows creation of pop-up balloons, icons, paths, and a variety of other features from the spreadsheet data. • Allows for saving of Google Earth Maps in KML format.