
Displaying Analyzing Data Stemandleaf Plot Dot Plot BoxandWhisker

Displaying & Analyzing Data Stem-and-leaf Plot Dot Plot Box-and-Whisker Plot
Statistics: The branch of mathematics that deals with collecting, organizing, analyzing or interpreting data. Data: Numerical facts or information. Stem-and-Leaf Plots: A convenient method to display every piece of data by showing the digits of each number.
Stem and Leaf Plot Stem and leaf plots are used as a quick way of seeing how many pieces of data fall in various ranges. The reader can quickly tell: - the range - the mode Stem and leaf plots have a title, a stem, and leaves A key is used to explain how to read the stem and leaves.
In a stem-and-leaf plot, the greatest common place value of the data is used to form stems. The numbers in the next greatest place value position are then used to form the leaves.
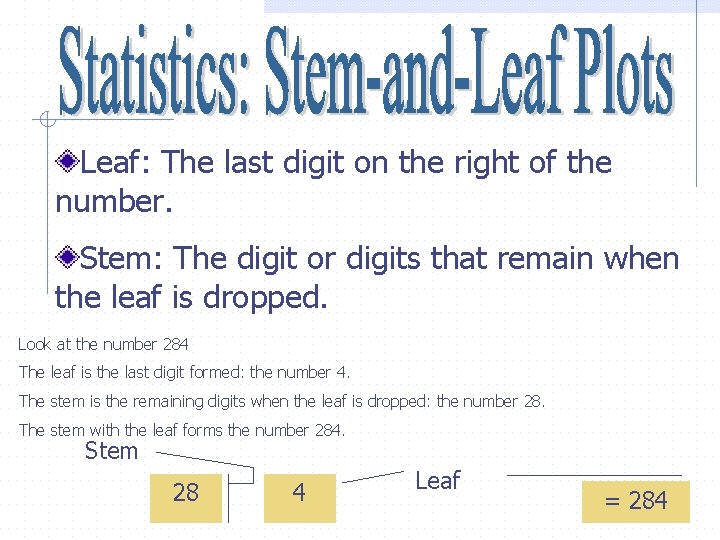
Leaf: The last digit on the right of the number. Stem: The digit or digits that remain when the leaf is dropped. Look at the number 284 The leaf is the last digit formed: the number 4. The stem is the remaining digits when the leaf is dropped: the number 28. The stem with the leaf forms the number 284. Stem 28 4 Leaf = 284
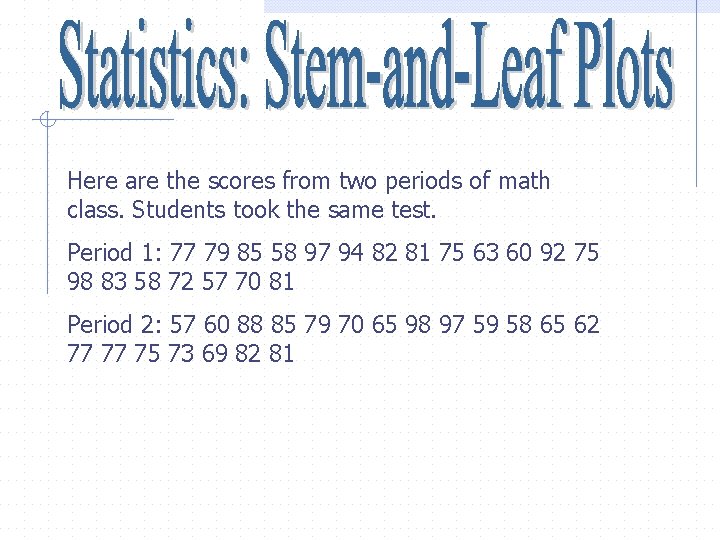
Here are the scores from two periods of math class. Students took the same test. Period 1: 77 79 85 58 97 94 82 81 75 63 60 92 75 98 83 58 72 57 70 81 Period 2: 57 60 88 85 79 70 65 98 97 59 58 65 62 77 77 75 73 69 82 81
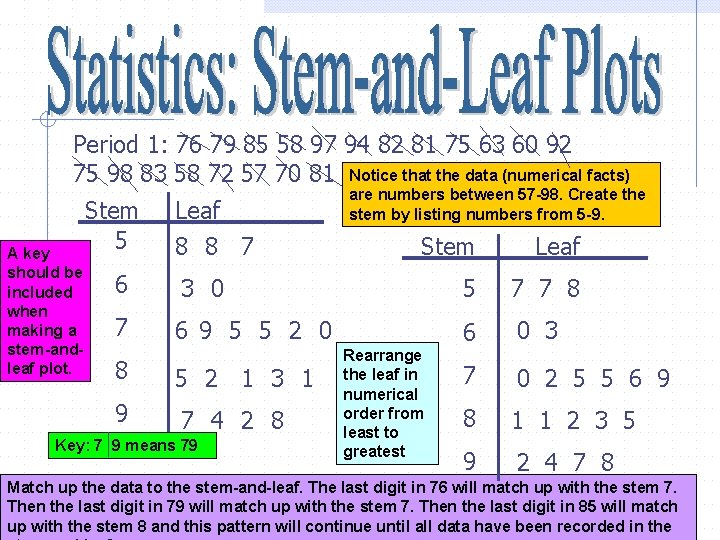
Period 1: 76 79 85 58 97 94 82 81 75 63 60 92 75 98 83 58 72 57 70 81 Notice that the data (numerical facts) A key should be included when making a stem-andleaf plot. Stem 5 Leaf 8 8 7 are numbers between 57 -98. Create the stem by listing numbers from 5 -9. Stem Leaf 6 3 0 5 7 7 8 7 6 9 5 5 2 0 6 0 3 7 0 2 5 5 6 9 8 1 1 2 3 5 9 2 4 7 8 8 5 2 1 3 1 9 7 4 2 8 Key: 7 9 means 79 Rearrange the leaf in numerical order from least to greatest Match up the data to the stem-and-leaf. The last digit in 76 will match up with the stem 7. Then the last digit in 79 will match up with the stem 7. Then the last digit in 85 will match up with the stem 8 and this pattern will continue until all data have been recorded in the
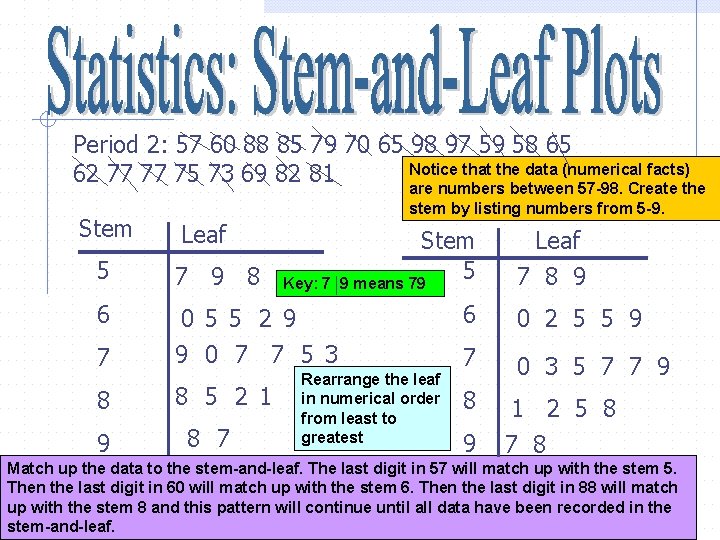
Period 2: 57 60 88 85 79 70 65 98 97 59 58 65 Notice that the data (numerical facts) 62 77 77 75 73 69 82 81 Stem are numbers between 57 -98. Create the stem by listing numbers from 5 -9. Leaf 5 7 9 8 6 7 0 5 5 2 9 9 0 7 7 5 3 8 8 5 2 1 9 8 7 Key: 7 Stem 5 9 means 79 Rearrange the leaf in numerical order from least to greatest Leaf 7 8 9 6 0 2 5 5 9 7 0 3 5 7 7 9 8 9 1 2 5 8 7 8 Match up the data to the stem-and-leaf. The last digit in 57 will match up with the stem 5. Then the last digit in 60 will match up with the stem 6. Then the last digit in 88 will match up with the stem 8 and this pattern will continue until all data have been recorded in the stem-and-leaf.
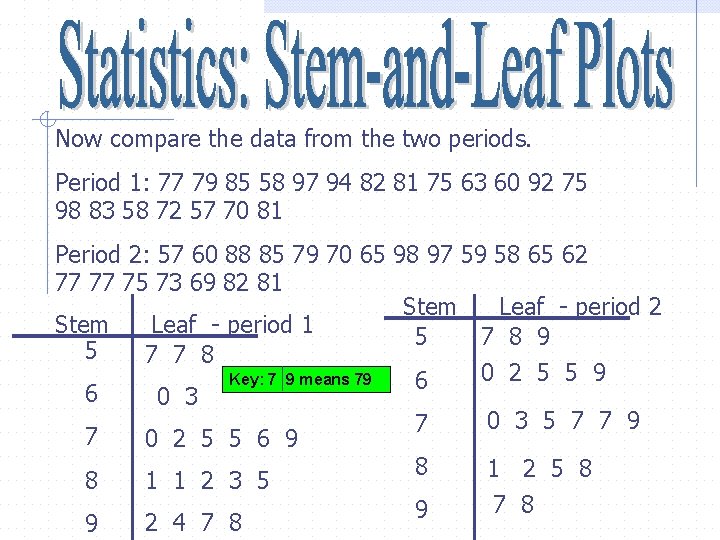
Now compare the data from the two periods. Period 1: 77 79 85 58 97 94 82 81 75 63 60 92 75 98 83 58 72 57 70 81 Period 2: 57 60 88 85 79 70 65 98 97 59 58 65 62 77 77 75 73 69 82 81 Stem Leaf - period 2 Stem Leaf - period 1 5 7 8 9 5 7 7 8 0 2 5 5 9 Key: 7 9 means 79 6 6 0 3 5 7 7 9 7 7 0 2 5 5 6 9 8 1 2 5 8 8 1 1 2 3 5 9 2 4 7 8 9 7 8
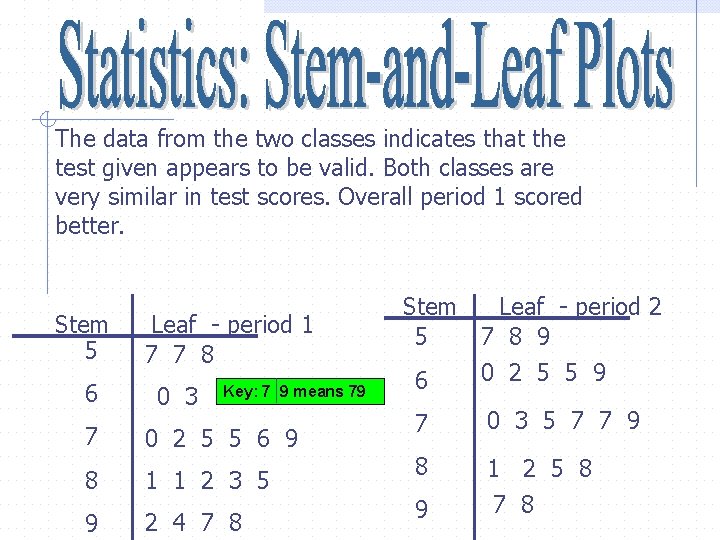
The data from the two classes indicates that the test given appears to be valid. Both classes are very similar in test scores. Overall period 1 scored better. Stem 5 6 7 8 9 Leaf - period 1 7 7 8 0 3 Key: 7 9 means 79 0 2 5 5 6 9 1 1 2 3 5 2 4 7 8 Stem Leaf - period 2 5 7 8 9 0 2 5 5 9 6 7 0 3 5 7 7 9 8 1 2 5 8 9 7 8
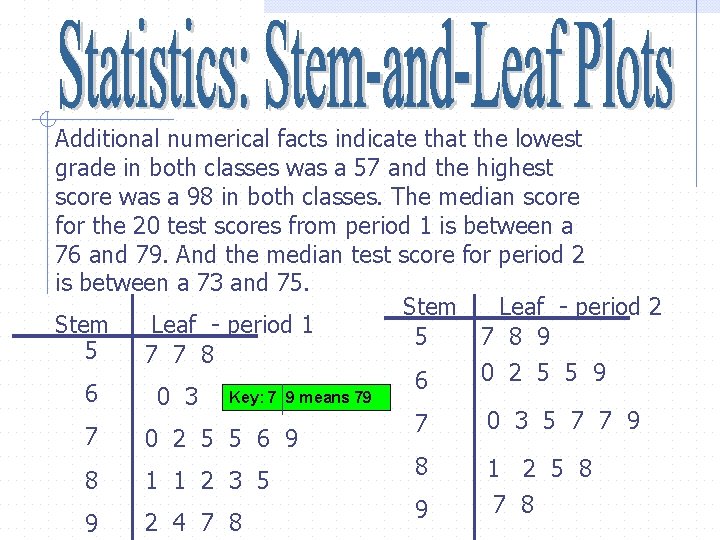
Additional numerical facts indicate that the lowest grade in both classes was a 57 and the highest score was a 98 in both classes. The median score for the 20 test scores from period 1 is between a 76 and 79. And the median test score for period 2 is between a 73 and 75. Stem Leaf - period 2 Stem Leaf - period 1 5 7 8 9 5 7 7 8 0 2 5 5 9 6 6 0 3 Key: 7 9 means 79 0 3 5 7 7 9 7 7 0 2 5 5 6 9 8 1 2 5 8 8 1 1 2 3 5 9 2 4 7 8 9 7 8
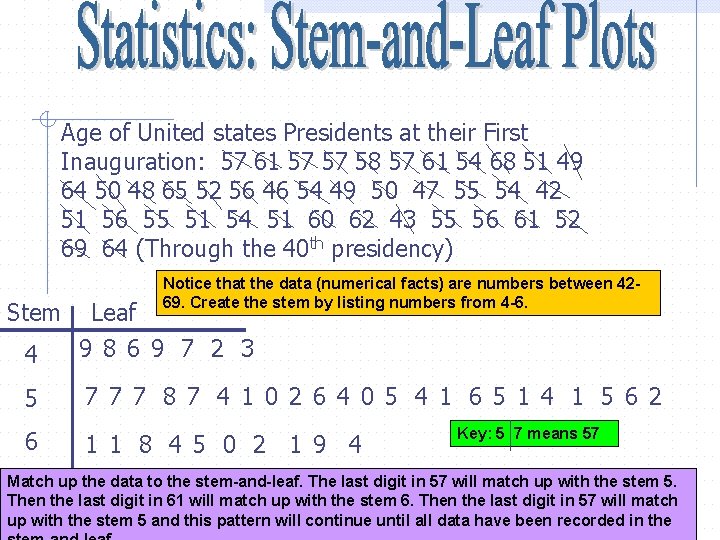
Age of United states Presidents at their First Inauguration: 57 61 57 57 58 57 61 54 68 51 49 64 50 48 65 52 56 46 54 49 50 47 55 54 42 51 56 55 51 54 51 60 62 43 55 56 61 52 69 64 (Through the 40 th presidency) Stem Notice that the data (numerical facts) are numbers between 4269. Create the stem by listing numbers from 4 -6. 4 Leaf 9 8 6 9 7 2 3 5 7 7 7 8 7 4 1 0 2 6 4 0 5 4 1 6 5 1 4 1 5 6 2 6 1 1 8 4 5 0 2 1 9 4 Key: 5 7 means 57 Match up the data to the stem-and-leaf. The last digit in 57 will match up with the stem 5. Then the last digit in 61 will match up with the stem 6. Then the last digit in 57 will match up with the stem 5 and this pattern will continue until all data have been recorded in the
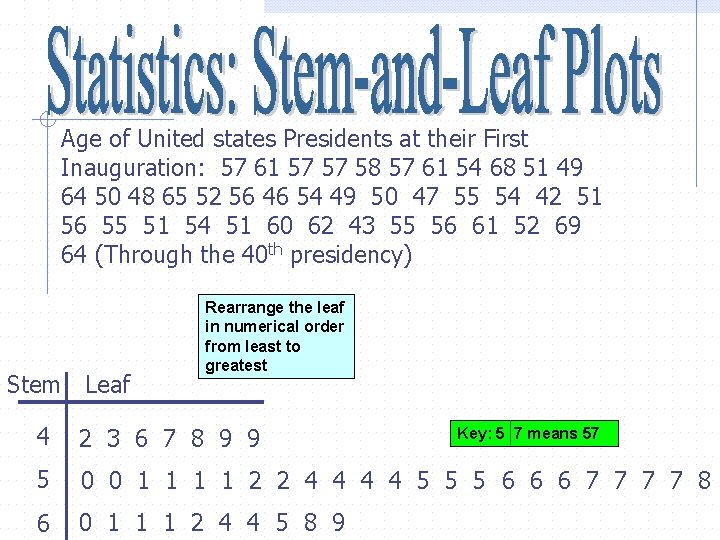
Age of United states Presidents at their First Inauguration: 57 61 57 57 58 57 61 54 68 51 49 64 50 48 65 52 56 46 54 49 50 47 55 54 42 51 56 55 51 54 51 60 62 43 55 56 61 52 69 64 (Through the 40 th presidency) Stem Leaf Rearrange the leaf in numerical order from least to greatest 4 2 3 6 7 8 9 9 5 0 0 1 1 2 2 4 4 5 5 5 6 6 6 7 7 8 6 0 1 1 1 2 4 4 5 8 9 Key: 5 7 means 57
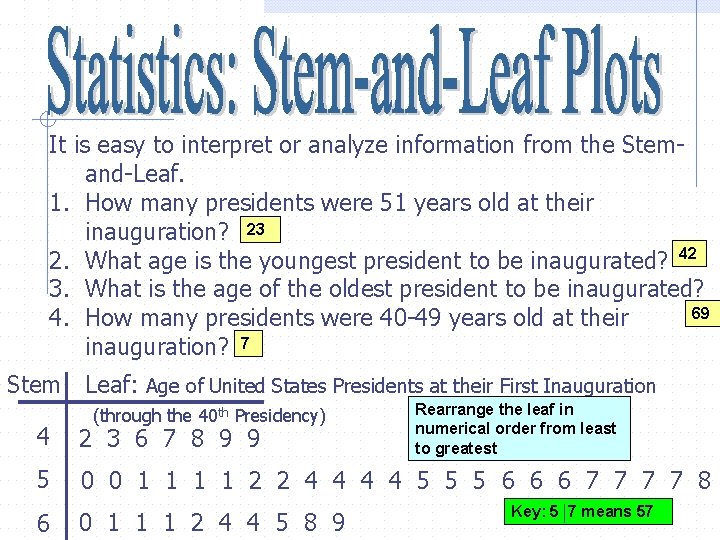
It is easy to interpret or analyze information from the Stemand-Leaf. 1. How many presidents were 51 years old at their inauguration? 23 2. What age is the youngest president to be inaugurated? 42 3. What is the age of the oldest president to be inaugurated? 69 4. How many presidents were 40 -49 years old at their inauguration? 7 Stem Leaf: Age of United States Presidents at their First Inauguration (through the 40 th Presidency) Rearrange the leaf in numerical order from least to greatest 4 2 3 6 7 8 9 9 5 0 0 1 1 2 2 4 4 5 5 5 6 6 6 7 7 8 6 0 1 1 1 2 4 4 5 8 9 Key: 5 7 means 57
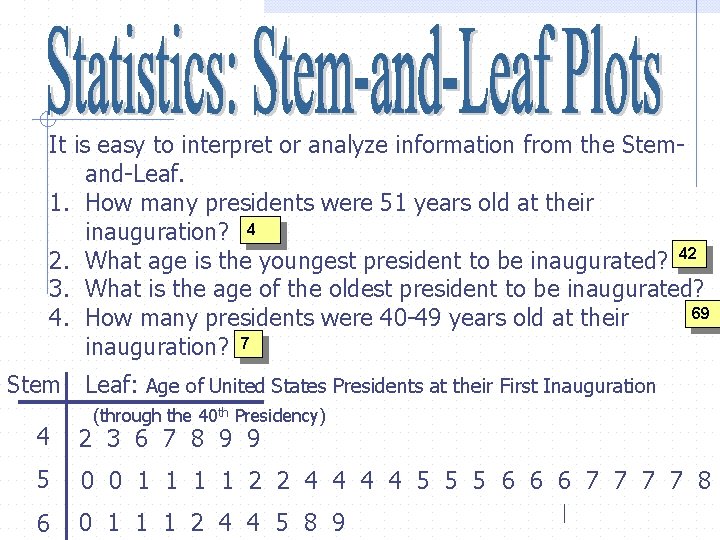
It is easy to interpret or analyze information from the Stemand-Leaf. 1. How many presidents were 51 years old at their inauguration? 4 2. What age is the youngest president to be inaugurated? 42 3. What is the age of the oldest president to be inaugurated? 69 4. How many presidents were 40 -49 years old at their inauguration? 7 Stem Leaf: Age of United States Presidents at their First Inauguration (through the 40 th Presidency) 4 2 3 6 7 8 9 9 5 0 0 1 1 2 2 4 4 5 5 5 6 6 6 7 7 8 6 0 1 1 1 2 4 4 5 8 9
Data Displays A �DOT PLOT shows the distribution of a quantitative variable above a number line with dots, circles, x’s… Advantage of a dot plot: moderate amounts of quantitative data can be quickly visualized.
Example: I want to get to know you better. So, I am going to take a survey and make a dot plot of the results regarding the number of pets period 2 and 4 own. The question is, “How many pets are in your family? ”
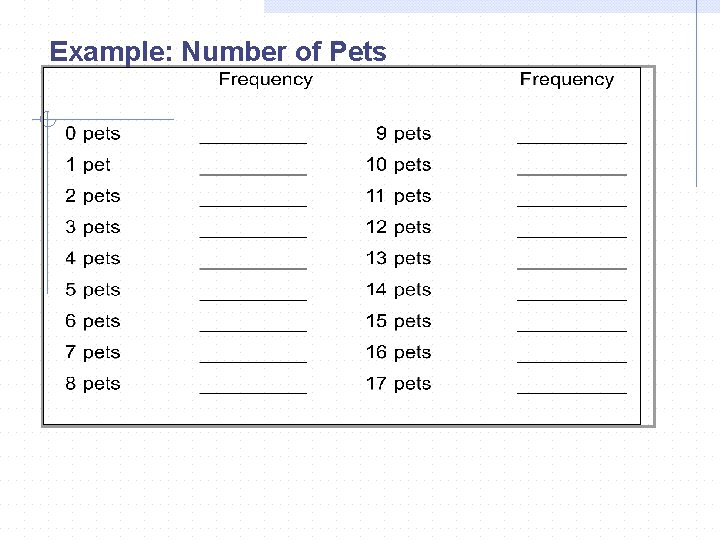
Example: Number of Pets
Dot Plot Example Number of Pets of Mrs. Pullo’s Statistic Students
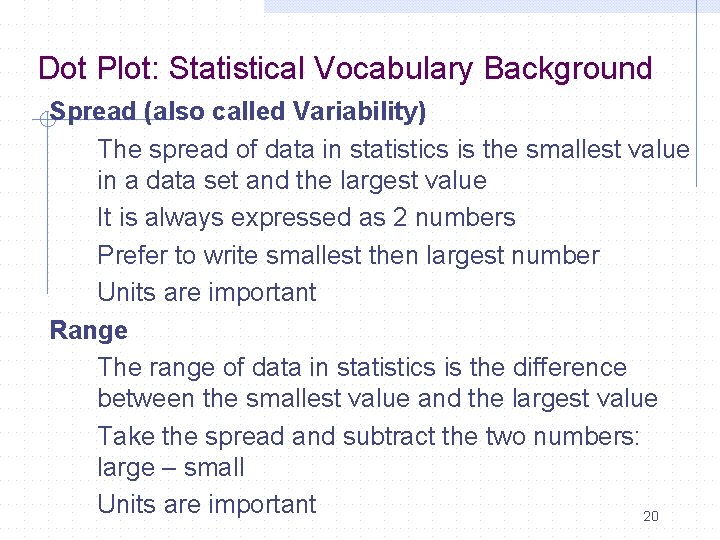
Dot Plot: Statistical Vocabulary Background Spread (also called Variability) The spread of data in statistics is the smallest value in a data set and the largest value It is always expressed as 2 numbers Prefer to write smallest then largest number Units are important Range The range of data in statistics is the difference between the smallest value and the largest value Take the spread and subtract the two numbers: large – small Units are important 20
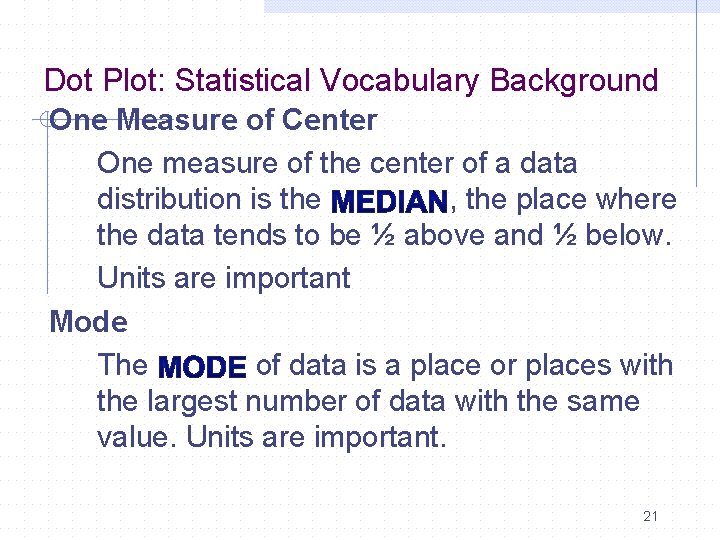
Dot Plot: Statistical Vocabulary Background One Measure of Center One measure of the center of a data distribution is the , the place where the data tends to be ½ above and ½ below. Units are important Mode The of data is a place or places with the largest number of data with the same value. Units are important. 21
Dot Plot: How to Describe It Shape The shape of a data distribution possibilities: 1) Symmetry Symmetric Skewed Left (negatively skewed) Skewed Right (positively skewed) 2) Peaks Single Peaked (unimodal) Double Peaked (bimodal) Multi Peaked (multimodal) NOTE: Data have modes, dot plots have peaks 22
Dot Plot: How to Describe It More on Shape Symmetric When the left & right sides of a distribution are mirror images of one another Skewed Left (negatively skewed) If a distribution extends much farther out to the left. The direction of skewness is on the side of the longer tail, in this case LEFT. Skewed Right (positively skewed) If a distribution extends much farther out to the right. The direction of skewness is on the side of the longer tail, in this case RIGHT. 23
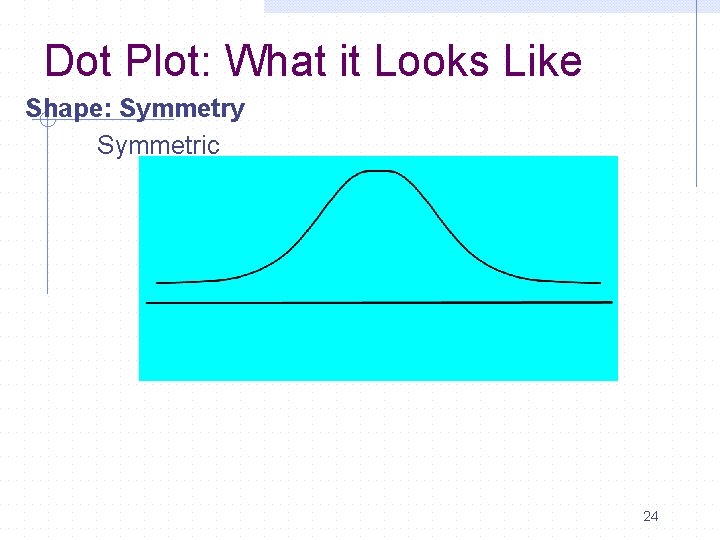
Dot Plot: What it Looks Like Shape: Symmetry Symmetric 24
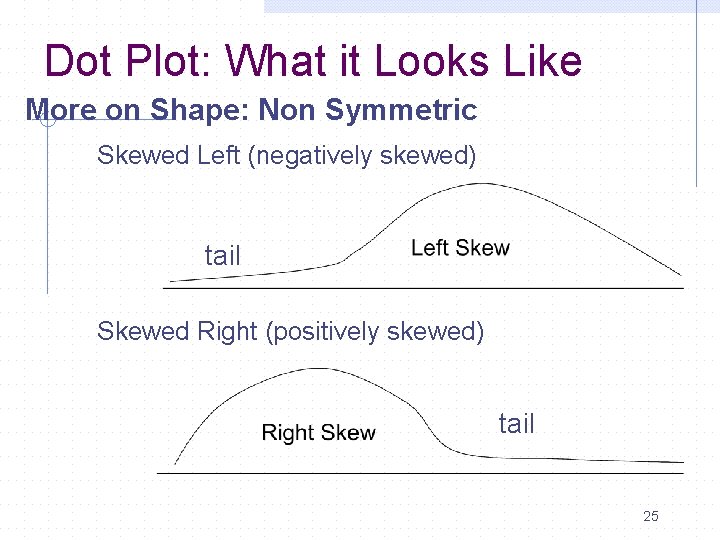
Dot Plot: What it Looks Like More on Shape: Non Symmetric Skewed Left (negatively skewed) tail Skewed Right (positively skewed) tail 25
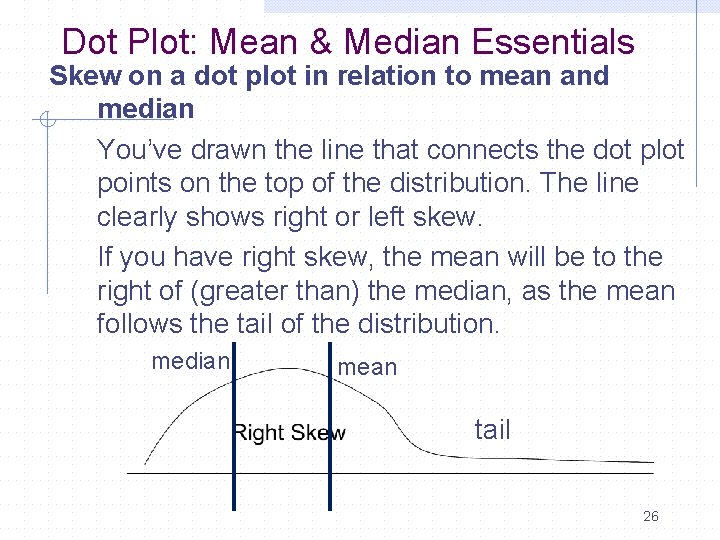
Dot Plot: Mean & Median Essentials Skew on a dot plot in relation to mean and median You’ve drawn the line that connects the dot plot points on the top of the distribution. The line clearly shows right or left skew. If you have right skew, the mean will be to the right of (greater than) the median, as the mean follows the tail of the distribution. median mean tail 26
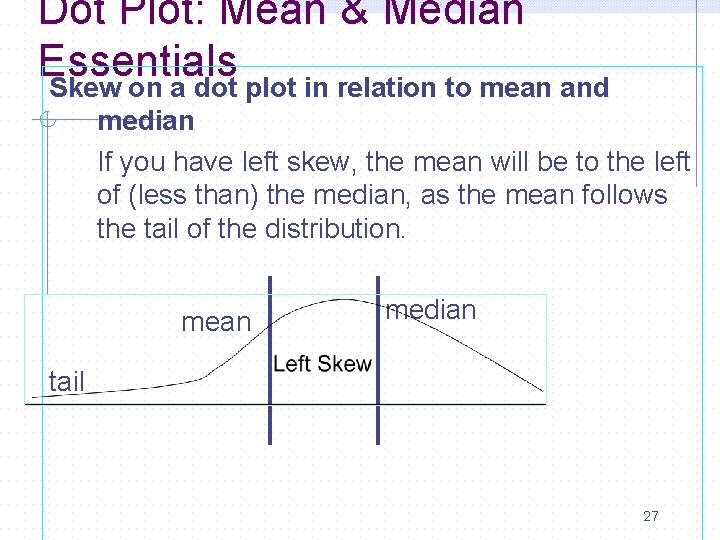
Dot Plot: Mean & Median Essentials Skew on a dot plot in relation to mean and median If you have left skew, the mean will be to the left of (less than) the median, as the mean follows the tail of the distribution. mean median tail 27
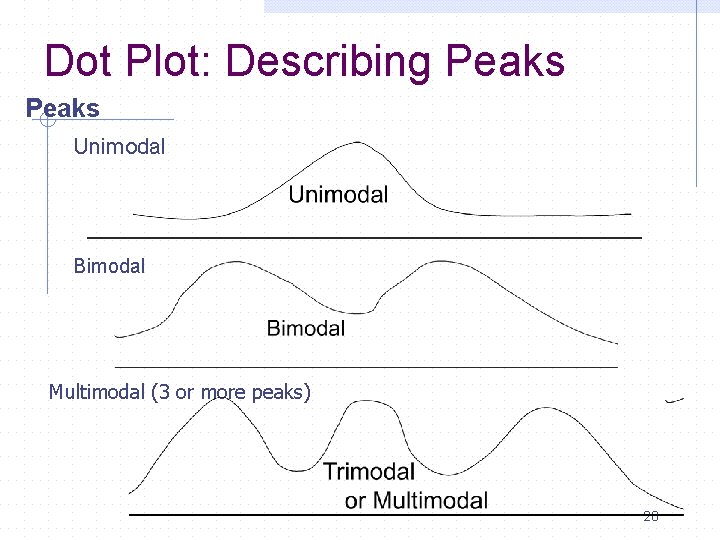
Dot Plot: Describing Peaks Unimodal Bimodal Multimodal (3 or more peaks) 28
A box-and-whisker plot shows how data is distributed by using the median, upper and lower quartiles, and the greatest and least values in the data set.
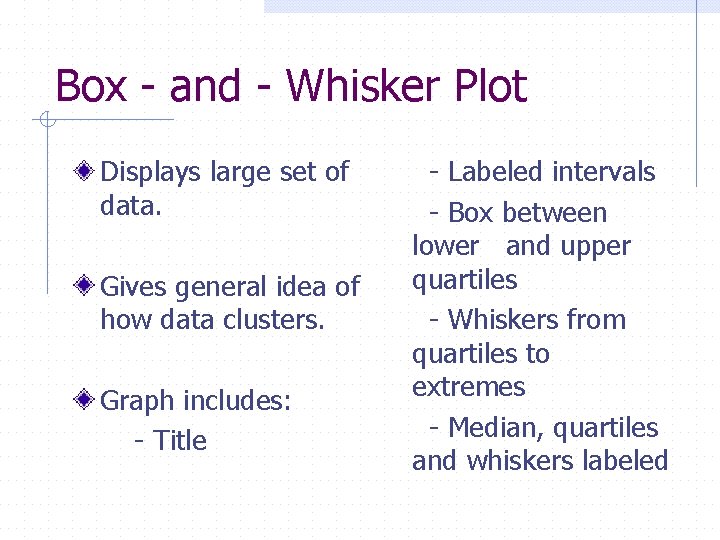
Box - and - Whisker Plot Displays large set of data. Gives general idea of how data clusters. Graph includes: - Title - Labeled intervals - Box between lower and upper quartiles - Whiskers from quartiles to extremes - Median, quartiles and whiskers labeled
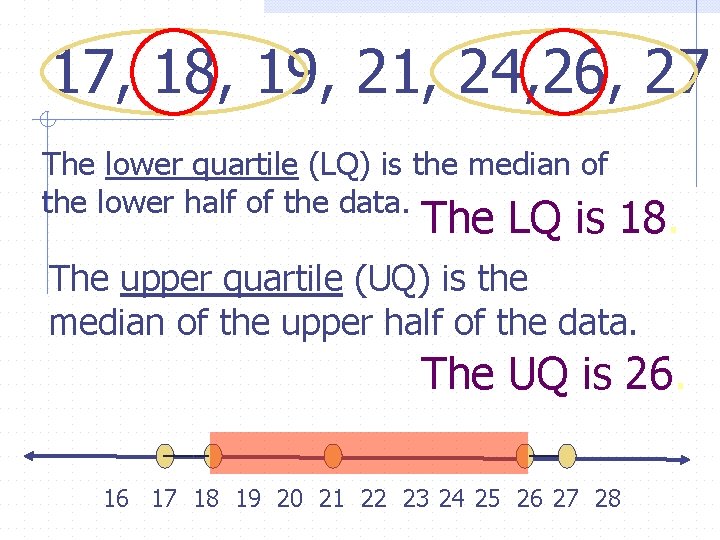
17, 18, 19, 21, 24, 26, 27 The lower quartile (LQ) is the median of the lower half of the data. The LQ is 18. The upper quartile (UQ) is the median of the upper half of the data. The UQ is 26. ___ __ 16 17 18 19 20 21 22 23 24 25 26 27 28
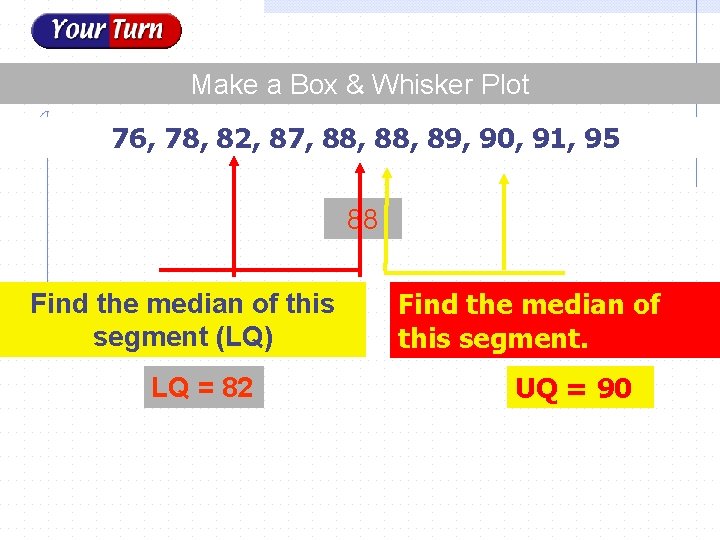
Make a Box & Whisker Plot 76, 78, 82, 87, 88, 89, 90, 91, 95 88 Find the median of this segment (LQ) LQ = 82 Find the median of this segment. UQ = 90
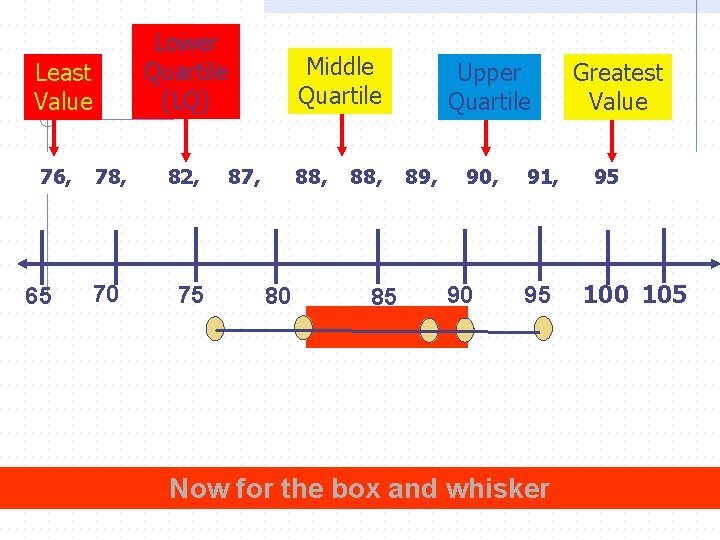
Lower Quartile (LQ) Least Value 76, 65 78, 70 82, 75 Middle Quartile 87, 88, 80 88, 85 Upper Quartile 89, 90 91, 95 Now for the box and whisker Greatest Value 95 100 105
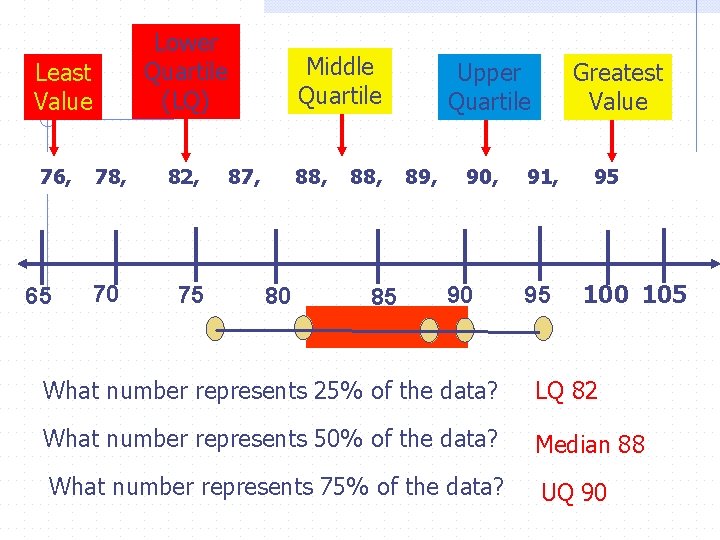
Lower Quartile (LQ) Least Value 76, 65 78, 70 82, 75 Middle Quartile 87, 88, 80 88, 85 Upper Quartile 89, 90 Greatest Value 91, 95 95 100 105 What number represents 25% of the data? LQ 82 What number represents 50% of the data? Median 88 What number represents 75% of the data? UQ 90
- Slides: 34