Displacement vs Time Graphs Displacement is how far


 = 3÷ 6")


- Slides: 28
Displacement vs. Time Graphs Displacement is how far from your origin you end up at. Distance is how many steps, or meters, or measureable lengths you took.
Displacement – Time Graphs May also be labeled “Position-Time” or “Distance-Time”
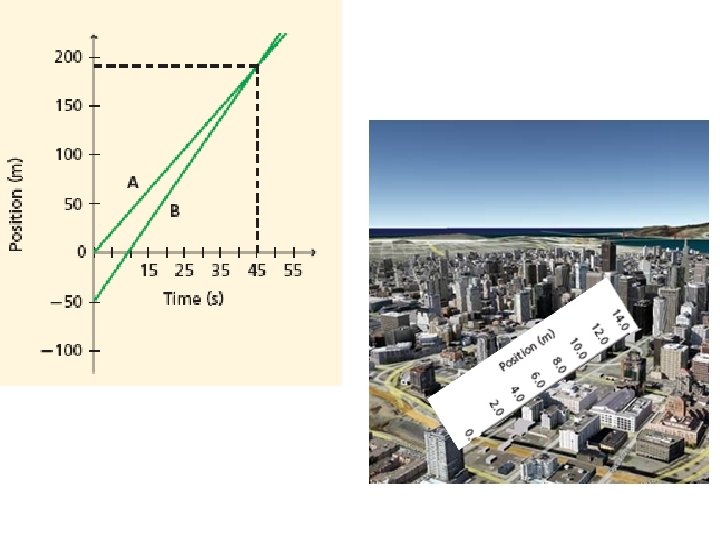
Displacement – Time Graphs • May also be labeled “Position-Time” or “Distance. Time” • Slope of the line can be positive or negative • Can contain data from more than one moving object
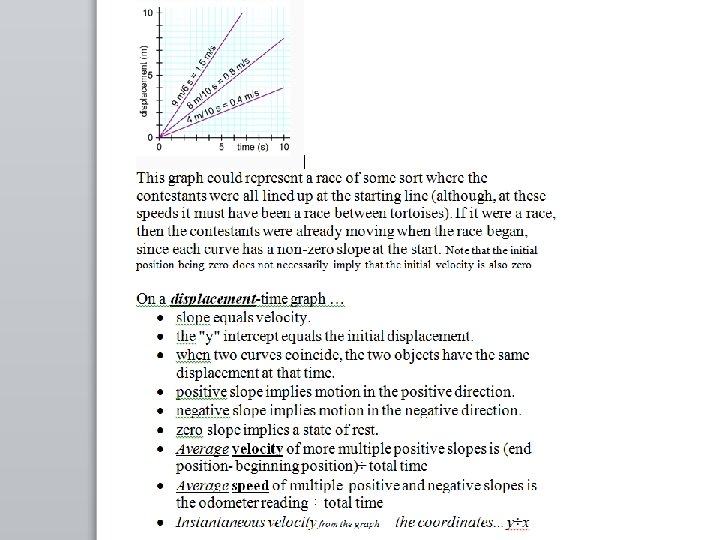
Blue started slightly faster than red, but red won the race. . . just barely.
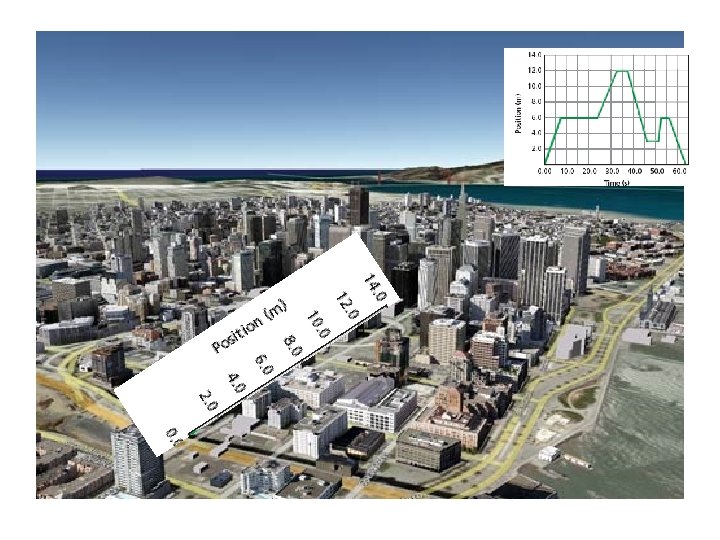
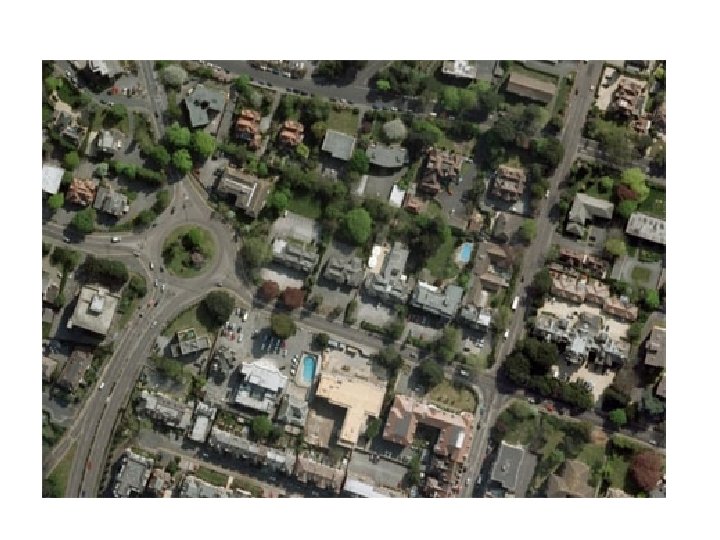
Top Views are a good way to think of “position vs. time” graphs.
Example
Example
• Which way is this object moving, and what is its velocity?
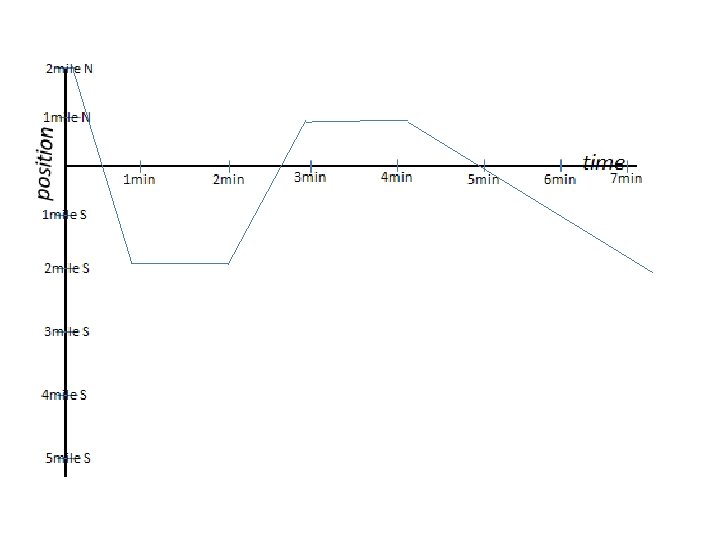
Try making a position/time graph for the following scenario: 1. Mr. Althaus starts out 2 miles north of home. At time zero he begins to drive a truck south 4 miles/minute at a constant speed. 2. He accidentally runs over a deer 2 miles south of home at time, 1. 01 minute. 3. He pauses for 1 minute until he determines the deer is squashed flat and deader than a doornail. 4. Fleeing the scene of the crime, Mr. Althaus takes off going North, traveling 3 miles a minute. 5. He is stationary for 1 minute, then he abruptly, turns around, and returns to the crash site at 1 mile/1 minute. How many minutes did it take to get to the dead deer?
2 mile N position 1 mile N 1 mile S 2 mile S 3 mile S 4 mile S 5 mile S 1 min 2 min 3 min 4 min 5 min 6 min time 7 min
On a displacement-time graph … • slope equals velocity. • the "y" intercept equals the initial displacement.
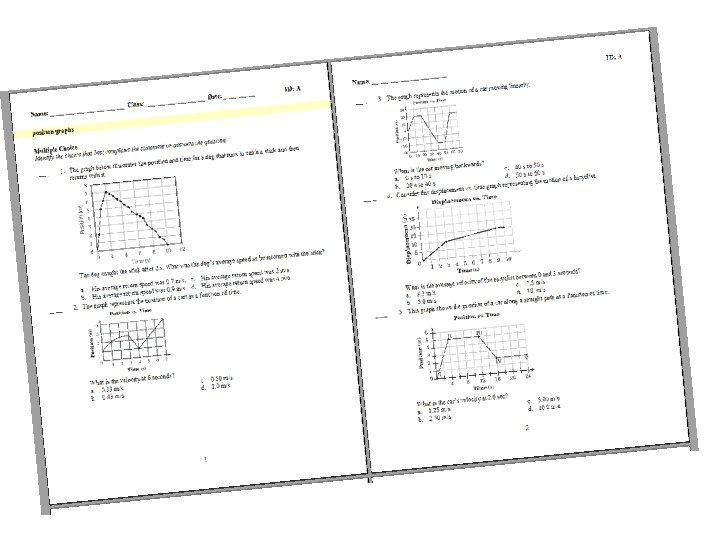
1 His average return speed was 0. 7 m/s.
2 Instantaneous velocity at the 6 second time. . . (y÷x) = 3÷ 6 = 0. 5 m/s
3 moving backwards
4 average velocity of the bicyclist between 0 and 3 seconds a. 3. 3 m/s
5 the car’s velocity at 2. 0 sec? a. 1. 25 m/s
6 Same as #3. . . . between 20 & 40 seconds.
7 2. 5 km north and then walks 1. 0 km south b. 1. 5 km north
8 An elevator in an office building completed the following trips: • 1 st floor to 8 th floor • 8 th floor to 4 th floor • 4 th floor to 13 th floor The distance between each floor of the office building is 3. 0 m. Which table shows the total distance traveled and displacement of the elevator? 8 -1=7 8 -4=4 13 -4=9 7 4 +9 20 20 x 3 m = 60 m 13 -1=12 12 x 3 m=36 m
9 -10 In a drill during basketball practice, a player runs the length of the 30. -meter court and back. The player does this three times in 60. seconds. 0. 0 m 3 m/s #9. . Displacement #10. . Total Distance traveled 180 m/60 seconds