Disorders of Carbohydrate Metabolism Learning Outcomes Explain the

Disorders of Carbohydrate Metabolism

Learning Outcomes • Explain the physiological basis of glucose homeostasis • Know the Definition and Classification and causes of Diabetes Mellitus [DM] • Know the diagnosis and laboratory investigation of DM • Know the role of the laboratory and the associated laboratory tests in monitoring DM • Know the Acute and Long Term complication of DM

Physiological Control of Plasma Glucose CNS triggers desire to eat Plasma glucose levels fall Production of glucagon triggered Food consumed & glucose absorbed Glycogen synthesised Triggers breakdown of glycogen Plasma glucose increases Glucose uptake by fat & muscle Plasma glucose levels increase Insulin release stimulated GLUT externalisation Euglycaemia restored

Movement of Substances across Cell Membranes

Liver has a key role in maintaining blood glucose Glycerol Pyruvate Glucose Blood Glucose Glycogen phosphorylase Glycogen Glucogenic Amino acids GLUT 2 GLUT 1 GLUT 4 Brain Adipose Muscle insulin-regulated glucose transporter Liver and kidney express glycogen phosphorylase, can supply glucose to bloodstream from glycogen Liver can convert many small molecules into glucose via gluconeogenesis

Glucose Transporters GLUT 1 -5 • GLUT 1 - Concentrated in brain, RBC, endothelial cells • GLUT 2 - Kidneys, liver, small bowel, pancreas • GLUT 3 - Neurons, placenta • GLUT 4 - insulin responsive glucose transporter - Skeletal muscle, cardiac muscle, adipose tissue • GLUT 5 – - Fructose transporter, low affinity for glucose

Hormonal components of glycaemic control • Oscillation between catabolic and anabolic states – Catabolic= breaking down – Anabolic = building up Anabolic controls • Driven by nutrient supply Cortisol – Post-prandial increase in anabolic processes • Pituitary also involved – Senses low glucose – Triggers hormone production Catabolic controls Epinephrine (adrenaline) Growth hormone (IGF 1) Insulin Glucagon
")
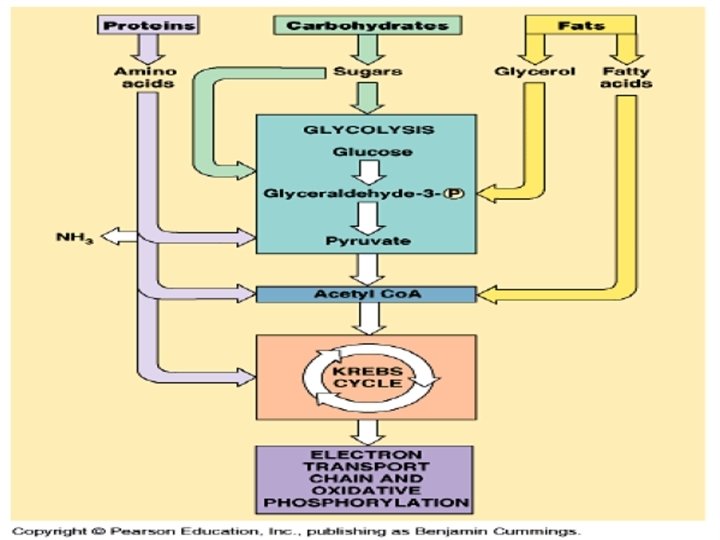
For most cells: • Glucose is the main source of energy during absorptive (fed) state • Fatty acids are the main source of energy during long fasting • Brain: Exception (uses glucose)

40% of all calories in a typical western diet is obtained from starch, sucrose and lactose

Insulin secretion - Insulin secretion in beta cells is triggered by rising blood glucose levels.

Insulin structure Polypeptide hormone • 51 amino acids • Synthesised as precursor Considered unstable if taken orally • Typically injections required • Novo Nordisk have promising developed oral formulation (2017) Acts via insulin receptor • Phosphorylation triggers intracellular signalling pathway
 Localisation Functions GLUT")
Protein facilitators key for insulin response Protein Substrate Km (m. M) Localisation Functions GLUT 1 Glucose 5 BBB, kidney, colon, RBC Resting glucose uptake GLUT 2 Glucose 10 -15 Liver, pancreas, ileum, kidney Liver, b-cells, kidney, enterocytes GLUT 3 Glucose 1 -2 Neurons, kidney, placenta High capacity influx at normal [glucose] GLUT 4 Glucose 3 -5 Muscle, adipose Insulin sensitive uptake GLUT 5 Fructose 6 Jejunum Fructose (& glucose) uptake • Glucose facilitators equalise concentration(s) across membranes – Transport down concentration gradient • GLUTs stored in intracellular granules – Insulin signalling promotes externalisation of preformed GLUT – Allows glucose uptake machinery to initiate quickly

Insulin binding to the insulin receptor induces a signal transduction cascade which allows the glucose transporter (GLUT 4) to transport glucose into the cell.
 excludes fatty")
The special case of the brain & glucose The blood-brain barrier (BBB) excludes fatty acids from brain • High levels of FFA can act as detergents Brain depends on glucose • Needs constant supply 110 g/day/brain • Older brain uses more glucose for same task(s) GLUT 1 expressed on BBB • Facilitates blood-brain movement of glucose GLUT 3 on neurons • Low Km transporter (1 -2 m. M) • Working at close to maximum rate if glucose above this

Maintaining Blood Glucose Homeostasis

If Blood Glucose is Too High Some Will Spill Into the Urine Kidney filters glucose into tubules and then reabsorbs it (100% in normal person) If glucose concentration is too high reabsorption cannot keep up with filtration and some glucose stays in tubule and becomes part of urine Glucose in the urine will suck more water into the urine (osmosis) and cause excess urine production (diabetes); body will be dehydrated -> thirst Urine glucose test useful in indicating diabetes

Role of the kidney Kidney a minor glycogen store Filtered glucose reabsorbed by kidney • SGLT = sodium glucose co transporter For normal concentrations ~ 100% effective • Too much glucose will exceed capacity (approx. 12 m. M) • Spill over leads to glucose rich urine, aka glucosuria

DISTANT PAST! First tests known Diabetes Patient urinates on the floor. If the urine contains sugar, ants will crawl to lick the urine. This test was used up to 20 years ago in some parts of Africa

From glucose homeostasis to diabetes Diabetes mellitus - ‘lots of urine, that smells/tastes like honey’ • Taste/smell an early test • Attraction of insects (NB ants) Glucose only appears in urine when greater than threshold • Exceeds the reabsorption capacity of a healthy kidney Logical consequence is that glucose must be elevated in blood • Otherwise how would it get out of the kidney? Problem with insulin • Not enough produced pancreatic burn out • Body not responsive enough insulin resistance

Blood Glucose is Controlled Mainly by the Liver Immediately after meals blood glucose comes from carbohydrate component of meal Between meals blood glucose comes from the liver & kidneys Only the liver and kidneys can release glucose into the blood (requires a special enzyme that converts glucose metabolites to glucose, which can be transported across the cell membrane) Liver provides 80% of blood glucose supply between meals, the kidney 20%
 2. Converts")
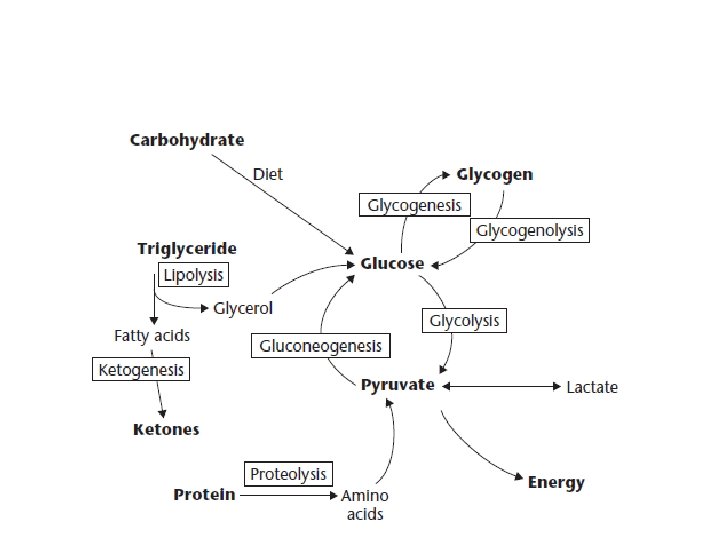
Liver makes glucose in 2 ways: 1. Breaks down liver glycogen (glycogenolysis) 2. Converts other types of small molecules into glucose (gluconeogenesis) Gluconeogenesis requires 4 special enzymes which can reverse some of the reactions of glycolysis

Many small molecules can be converted to glucose: Lactate & pyruvate: pyruvate mainly come from muscles Glycerol: supplied by adipose tissue when triglycerides are broken down. Fatty acids cannot be converted into glucose, but: Fatty acid metabolism indirectly supports gluconeogenesis by producing Acetyl. Co. A activates and inhibits key enzymes, promoting glucose formation Amino acids: acids 20 of the 22 amino acids can be converted to glucose

4. 4 mmol/min 2. 8 mmol/min 7. 2 mmol/min 5. 0 mmol/min 4. 4 mmol/min 2. 8 mmol/min

Major Insulin counter regulatory hormones

The Only Hormone that Can Lower Blood Glucose is Insulin Muscle, fat and liver tissues require insulin to transport glucose into the cells Many other tissues, including brain, do not require insulin to transport glucose Insulin also increases activity of enzymes that cause storage of glucose as glycogen or lipid After a meal blood glucose rises and this stimulates the release of insulin from the pancreas; Extra insulin then causes the glucose to enter the cells and become stored

Diabetes Timeline

Both Insulin and Glucagon are Made in the Endocrine Part of the Pancreas The pancreas has both an exocrine and endocrine part Endocrine part: small clumps of cells called islets of Langerhans [ cells Glucagon : cells Insulin] Exocrine part: makes digestive enzymes, delivers them to duodenum through ducts If blood glucose is high secretes large amounts of insulin and small amounts of glucagon. Secretion reversed when blood glucose is low Glucagon raises blood glucose, insulin lowers it

Several Hormones Can Raise Blood Glucose Four major hormones raise blood glucose: Glucagon Cortisol Epinephrine (Adrenaline) Growth hormone In vigorous exercise all 4 of these hormones increase Diabetes Mellitus Results When Insulin is Deficient or Ineffective Diabetes = excess production of urine Mellitus = sweet (refers to sugar in urine)

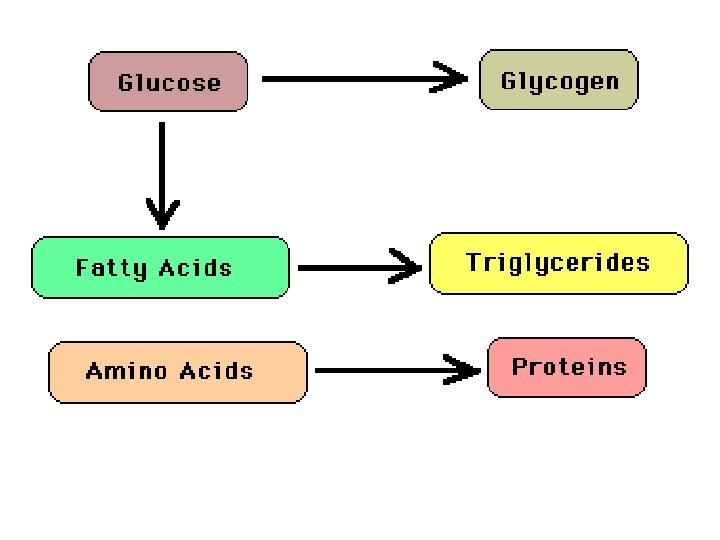
Glucose intake/dietary glucose The high blood glucose level resulting from dietary intake sets in motion a number of homeostatic mechanisms which finally result in the excess glucose being stored as glycogen and fat, ie, Increased blood Glucose → Increased insulin and decreased glucagon secretion which → 1. Increased glycogen production from glucose (Glycogenesis) 2. Increased fatty acid synthesis and triglyceride production from glucose
 4. Decreased glucose production from protein")
3. Decreased production of glucose from glycogen (Glycogenolysis) 4. Decreased glucose production from protein (Gluconeogenesis) Steps 1 + 2 + 3 + 4 → Lowering of blood Glucose

3 D Glucose Molecule

1 6 6 5 4 1 3 2 4

Intake / Dietary glucose Insulin & Glucagon Glycogen Formation Triglyceride Formation Protein conservation Inhibition of Gluconeogensis

Intake / Dietary glucose

Starvation Insulin & Glucagon Glycogen Depletion Triglyceride Catabolism and Ketone Formation Protein breakdown and Gluconeogensis

Starvation
 The term diabetes mellitus describes a metabolic disorder of")
Diabetes Mellitus definition. WHO (1999) The term diabetes mellitus describes a metabolic disorder of multiple aetiology characterized by chronic hyperglycaemia with disturbances of: ü ü ü carbohydrate, fat and protein metabolism resulting from defects in insulin secretion, insulin action, or both
 > 6. 1 mmol/l 2")
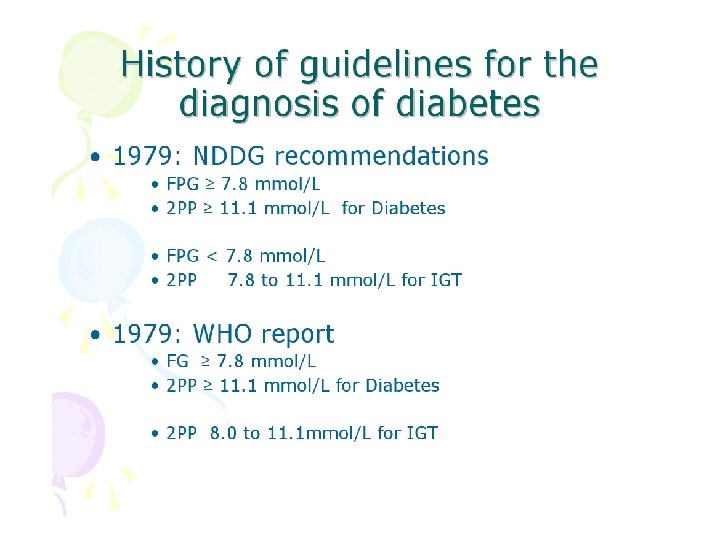
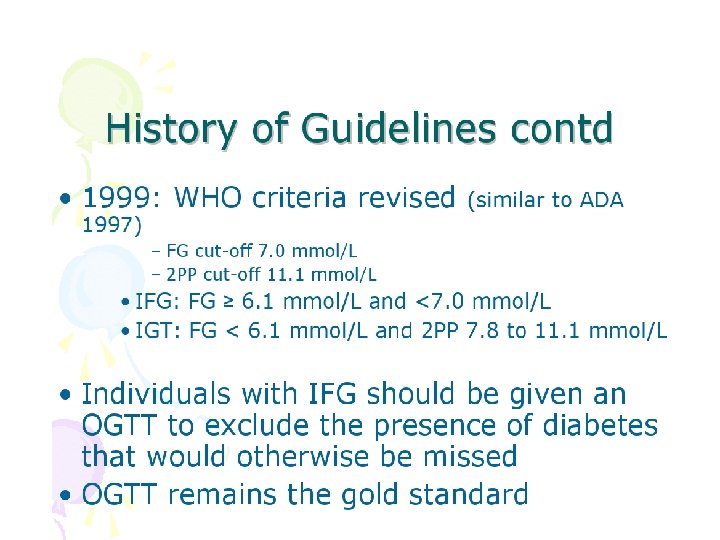
WHO diagnostic criteria 1999 whole blood Diabetes mellitus (fasting) > 6. 1 mmol/l 2 hour post glucose load > 10. 0 mmol/l plasma > 7. 0 mmol/l >11. 1 mmol/l IGT (fasting) < 7. 0 mmol/l & >7. 8 mmol/l 2 hr post glucose load IFG (fasting) 2 hr post glucose load < 6. 1 mmol/l & > 6. 7 mmol/l >5. 6 mmol/l & <6. 1 mmol/l >6. 1 mmol/l &<7. 0 mmol/l <6. 7 mmol/l <7. 8 mmol/l

Disorders of glycemia: etiologic types and stages. *Even after presenting in ketoacidosis, these patients can briefly return to normoglycemia without requiring continuous therapy (i. e. , “honeymoon” remission); American Diabetes Association Dia Care 2010; 33: S 62 -S 69

Hb. A 1 c – Formed by non-enzymatic attachment of glucose to haemoglobin A [adult haemoglobin] – Formed slowly and continuously. – Normally less than 42 mmol/mol [6 %] but in diabetics can increase 2 - 3 times


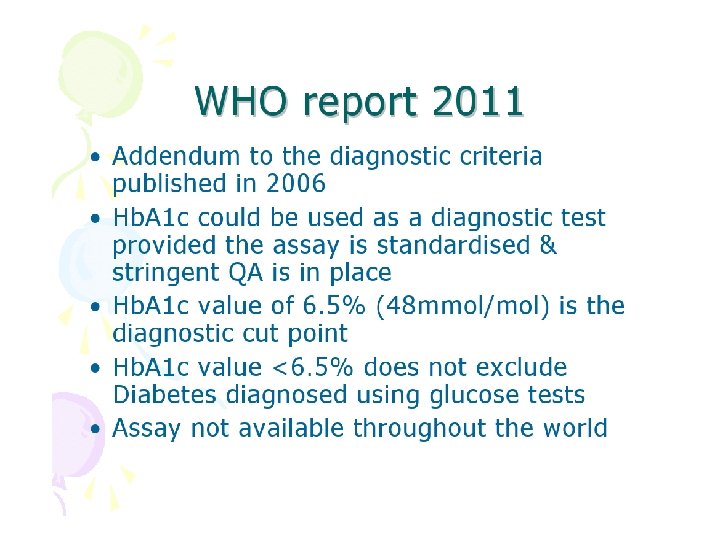
New Hb. A 1 c reporting units • Up until now Hb. A 1 c was reported as a % of the total Hb. A which is glycated • Different methods gave different results for Hb. A 1 c • All assays must now be calibrated against the international reference method [IFCC*] • Results will be reported as a ratio: mmol of glycated Hb. A: mol of non-glycated Hb. A [mmol/mol] *International Federation of Clinical Chemistry

IFCC = International Federation of Clinical Chemistry

Diabetes Mellitus 7. 0 < 7. 0 Pre Diabetes 6. 1 < 6. 1 11. 1 Impaired Fasting glycaemia < 11. 1 Pre Diabetes 7. 8 < 7. 8 Normal Fasting OGTT (2 hrs) Impaired Glucose Tolerance Test

Diabetes Mellitus 6. 5 < 6. 5 Pre Diabetes 5. 7 48 Intermediate Hyperglycaemia < 48 Pre Diabetes 39 < 5. 7 < 39 Normal Hb. A 1 c [%] [mmol/mol]

Classification of Diabetes Mellitus Four types of Diabetes Mellitus: Primary Diabetes Mellitus • Type 1 [previously IDDM] • Type 2 [previously NIDDM] Others • Gestational diabetes. • "other specific types" [eg endocrinopathies]

Two main types of primary diabetes mellitus: Type I: I autoimmune destruction of pancreatic cells, usually occurs early in life. Characterized by low insulin output, high blood glucose, glucose in urine, excess urine flow, switch to fat metabolism. Treated with insulin injections, careful balance of diet & exercise. (~10%) Type II: II associated with obesity, usually starts later in life. Insulin may be normal, but is ineffective (insulin resistance). Many of symptoms the same, but less severe. May be reversed if weight is lost. Cause unknown, but may be receptor disease (~90%)

Other types of DM • Other specific types – – – Genetic defects of beta–cell function Genetic defects in insulin action Diseases of the exocrine pancreas Endocrinopathies Drug– or chemical–induced Infections Uncommon forms of immune–mediated diabetes Other genetic syndromes sometimes associated with diabetes • Gestational diabetes (~4% of all pregnancies)
")
Primary Diabetes Mellitus TYPE 1 TYPE 2 Previously known as Insulin dependent Diabetes (IDDM) Non insulin dependent diabetes (NIDDM) Epidemiology: usually younger, lean, mostly European Mostly older overweight, all racial groups Genetic not generally inherited Genetically linked Susceptibility Pathogenesis autoimmunity No evidence insulin deficiency, always Needs insulin Partial insulin deficiency , insulin resistance Clinical

Type 1 diabetes • Presentation of type 1 is acute with symptoms of poyuria, polydipsia, lethargy weight loss, nausea, vomiting, abdominal cramps, blurred vision and superficial infection • This presentation is the end point of recent and continuing beta cell function resulting in near total loss of Insulin production • Hyperglycaemia itself begets further beta cell destruction as treatment with insulin often results in a “honeymoon” period where the patient can often manage without insulin

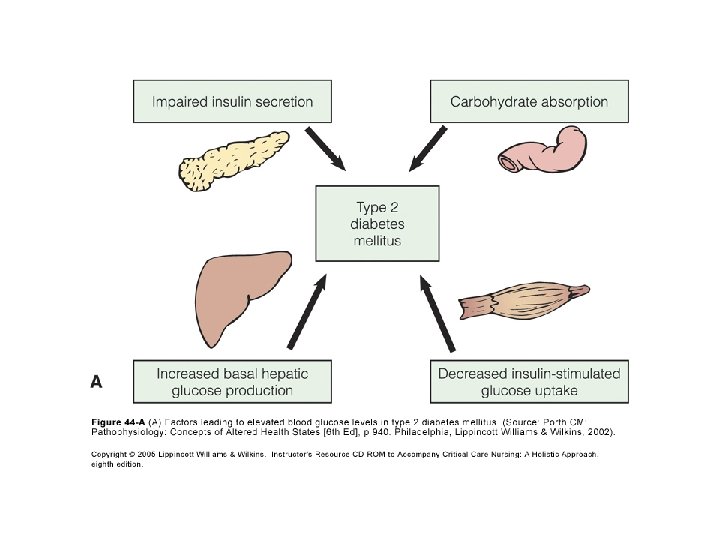
Pathogenesis of type 2 Diabetes Mellitus • Diabetes Mellitus is a group of metabolic disease characterized by hyperglycemia resulting from defects in insulin secretion, insulin action, or both. • The chronic hyperglycemia of diabetes is associated with log-term damage, dysfunction, and failure of various organs, especially the eyes, Kidneys, nerves, heart, and blood vessels. Insulin deficiency Blood glucose Insulin resistance

Natural History of Type 2 Diabetes Mellitus 0 -5+ 15 -40+ Genetic background for: Insulin secretion Insulin sensitivity complications Environmental factors: Nutrition Obesity Physical inactivity IGT Insulin resistance Hyperinsulinemia HDL cholesterol Triglyceride 15 -60+ 25 -70+ Microvascular Complication Disability Postprandial Hyperglycemia Normo-insulinemia Retinopathy Nephropathy Neuropathy Hypertension Atherosclerosis Fasting Hyperglycemia Hypoinsulinemia Blindness Renal Failure Amputation IHD Stroke Disability Macrovascular Complication Death Age

Natural History of Type 2 Diabetes Mellitus Genetic Acquired Glucotoxicity Lipotoxicity ia m a i e c m y e l n g i r l e u p s y n i H po y H Impaired beta cell function Insulin deficiency Decrease Glucose-induced insulin secretion Decrease Tissue response to insulin Increase Hepatic glucose production Hyperglycemia Basal Hyperinsulinemia Increase Cellular glucose uptake Decrease Glucose transport Insulin resistance Genetic Acquired Obesity Vo 2 max Age Smoking Decrease Insulin binding Post- receptor defect
 2 50 3 25 IGT PPHyper T")
100 1 75 Beta Cell function (%) 2 50 3 25 IGT PPHyper T 2 Phase II 0 -12 -10 -6 -2 0 2 6 Phase III 10 Years from diagnosis UKPDS data 14

• Prevalence of type 2 diabetes increase with age. • Females are significantly higher than males. • The prevalence is almost double after the age of 55 years. Prevalence Age : Age groups


Type 2 DM • Insidious presentation with symptoms of polyuria, polydipsia, lethargy weight loss, nausea, vomiting, abdominal cramps, blurred vision and superficial infection. Often discovered at routine medical • This presentation is the end point of the gradual loss of beta cell function in the setting of Insulin resistance • Strong (90 -100%) concordance in Twins

Cardinal Signs of Diabetes Polyuria Polydipsia Polyphagia
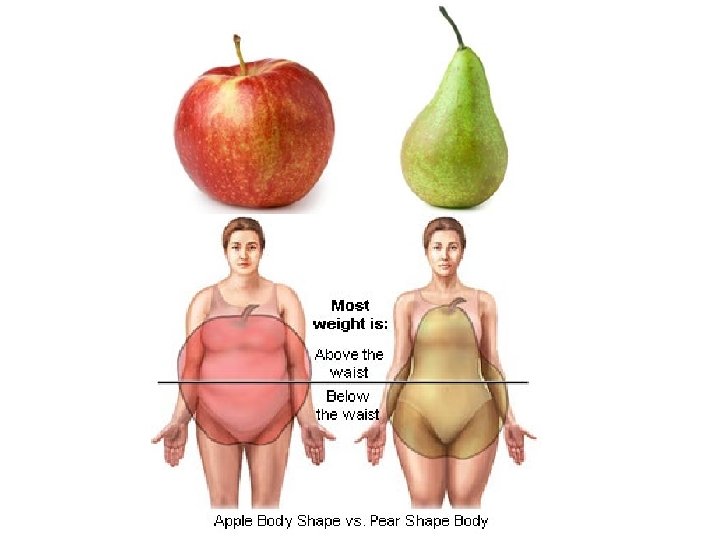
![Diabesity [Type 2] Diabetes + Obesity](http://slidetodoc.com/presentation_image_h/afed180dc8a6f9e791e0426c06f0a254/image-71.jpg "Diabesity [Type 2] Diabetes + Obesity")
Diabesity [Type 2] Diabetes + Obesity
 • cerebrovascular")
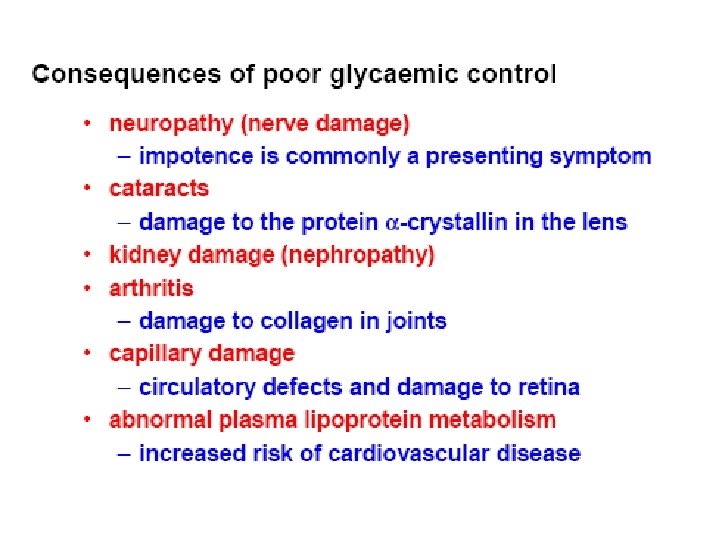
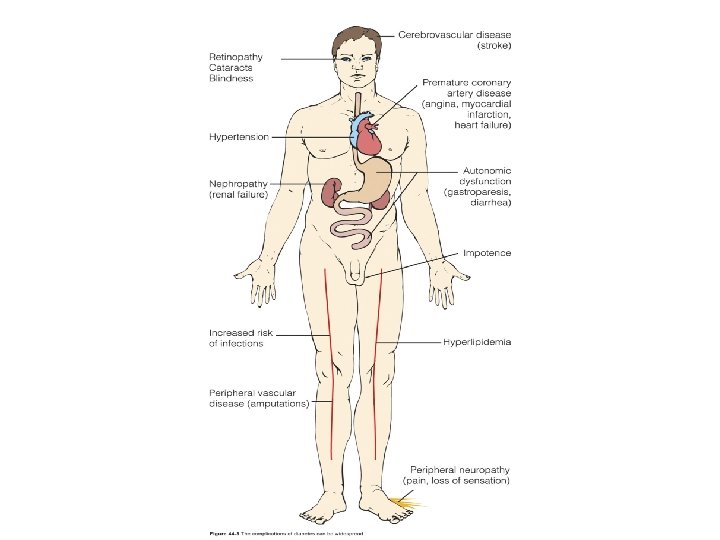
Long Term Complications of Diabetes Ø Macrovascular • coronary artery disease (MI) • cerebrovascular disease (Stroke) • peripheral vascular disease Ø Microvascular • retinopathy • nephropathy • neuropathy

Symptoms of diabetes due to hyperglycaemia plasma glucose > renal threshold about 12 mmol/L weight loss glucose in urine genital thrush osmotic diuresis urine volume thirst tiredness

Type 1 diabetes Type 2 diabetes typical onset < 30 years can start at any age sudden onset severe symptoms recent weight loss usually thin typical onset > 20 years can start at any age gradual onset may be no symptoms often no weight loss usually obese spontaneous ketosis not ketotic absent C-peptide detectable C-peptide markers of autoimmunity no autoimmune markers

Laboratory Tests – Blood Glucose – Fasting Glucose – Postprandial Glucose – Glycosylated Haemoglobin [Hb. A 1 c] – Glycosylated Albumin [aka fructosamine]

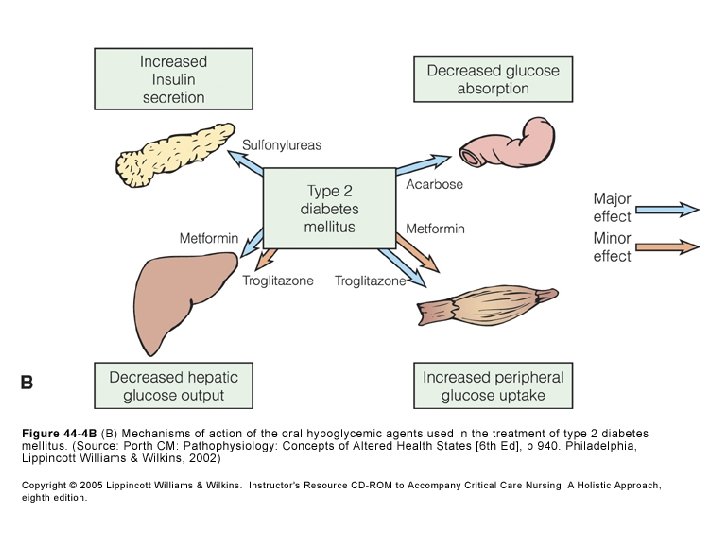
Medical Management – Diet – Exercise – Oral Anti-diabetes Medications – Insulin Therapy

Oral Anti-diabetes Medications • Stimulates beta cells to release more insulin • Sensitizes the body to the insulin already present • Helps insulin work better in muscle and fat; lowers insulin resistance • Slows or blocks the breakdown of starches and certain sugars; action slows the rise in blood sugar levels following a meal

Stepwise management of type 2 diabetes Insulin ± oral agents Oral combination Oral monotherapy Diet & exercise

Burden of Diabetes • Diabetes affects 3% of the population • By 2025 it is estimated that five million people will have diabetes [UK]. Most of these cases will be Type 2 diabetes, because of our ageing population and rapidly rising numbers of overweight and obese people. • The cost of diabetes to the NHS is over £ 1. 5 m an hour or 10% of the NHS budget for England Wales. This equates to over £ 25, 000 being spent on diabetes every minute. • People with diabetes account for 5. 4% of all completed hospital episodes; 6. 4% outpatients episode: 9. 4% of inpatient stay

Costs of diabetes treatment in the UK Area of expenditure Type 1 diabetes Type 2 diabetes Total cost Percentage of costs Diabetes drugs £ 0. 344 billion £ 0. 712 billion £ 1. 056 billion 7. 8% Non-diabetes drugs Inpatient £ 0. 281 billion £ 1. 810 billion £ 2. 091 billion 15. 2% £ 1. 007 billion £ 8. 038 billion £ 9. 045 billion 65. 8% Outpatient £ 0. 170 billion (excluding drugs) £ 1. 158 billion £ 1, 328 billion 9. 7% Other (including social service) - - £ 0. 230 billion 1. 7% Total £ 1. 802 billion £ 11. 718 billion £ 13. 750 billion 100% Source: Kanavos, van den Aardweg and Schurer: Diabetes expenditure, burden of disease and management in 5 EU countries, LSE (Jan 2012)

Diabetes is Sometimes Called "Starvation in the Midst of Plenty“ A diabetic has plenty of glucose in his blood but many of his tissues cannot use it because it can't get into the cells. Glucose is water soluble and cannot cross cell membranes by simple diffusion A series of facilitated transport molecules move glucose across membranes
")
Insulin stimulates sugar transport into muscle, and fat cells (but not into brain cells) Causes insertion of GLUT 4 transport molecules into membranes of muscle and adipose tissue Brain has its own transporter, GLUT 3; not insulin dependent In diabetes cells must look for alternate sources of energy

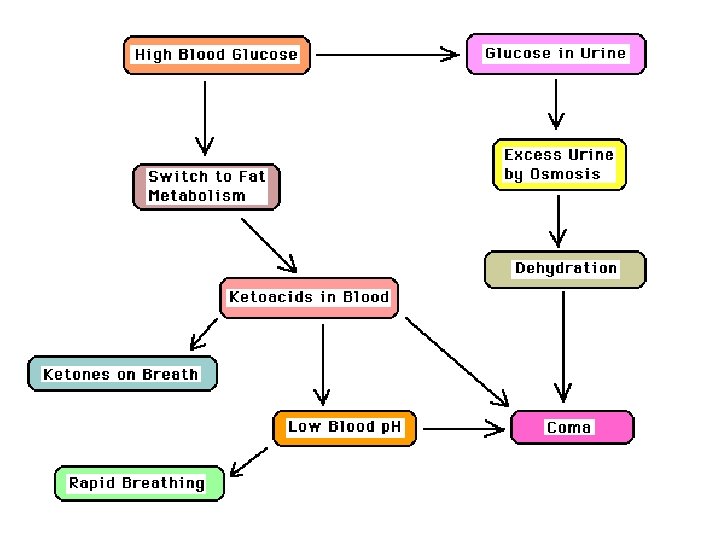
When the Body Can't Burn Glucose it Switches to Fat Metabolism If muscle cells can't get enough glucose body will increase fat breakdown to provide free fatty acids (FFAs) as an energy source. Remember: brain cannot use FFAs A side reaction of excess lipid metabolism is the buildup of ketoacids in the blood. Ketoacids can be smelled on breath: odor similar to acetone Ketoacids disturb mental functions and lower blood p. H
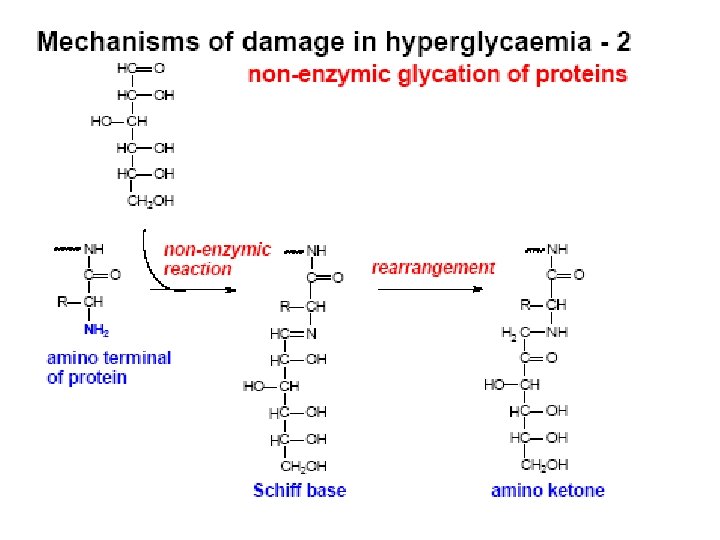

Glycation of Collagen
: harder")
Diabetics May Have Poor Circulation Excess glucose makes the blood syrupy (more viscous): harder for heart to pump. Excessive urine flow dehydrates body, reduces blood volume. Both effects reduce the circulation. Diabetic Ketoacidosis is a Medical Emergency If a diabetic lets his blood glucose get too high he may develop ketoacidosis, a life-threatening emergency Most of the problems in ketoacidosis are due to: ØDehydration (due to excessive urine production) ØLow p. H (due to excessive lipid metabolism) ØLarge amounts of ketoacids in the blood (also due to excessive lipid metabolism)

“Pre-diabetes” • `WHO and ADA are using this new term to describe: IFG (impaired fasting glucose) and IGT (impaired glucose tolerance). – 16 million people have pre-diabetes. – Most will develop diabetes within 10 years. • Prevention strategies – screen at risk populations ( > 45 yrs, obese) – lose 5 -10% of weight – modest exercise 30 min/day

The Role Of The Laboratory In The Diagnosis And Monitoring Of Diabetes

Blood versus Plasma • Glucose is dissolved in water. • The plasma phase of blood has a higher concentration of water (~93%) compared to that of red blood cells (~71%). • Therefore plasma has a higher glucose concentration that of whole blood. • The difference in glucose concentration will vary with the haematocrit; the lower the haematocrit the smaller the difference, and the higher the haematocrit the larger the difference between the two sample types.
![International Federation of Clinical Chemistry [IFCC report 2006] • The document recommends reporting the](http://slidetodoc.com/presentation_image_h/afed180dc8a6f9e791e0426c06f0a254/image-96.jpg "International Federation of Clinical Chemistry [IFCC report 2006] • The document recommends reporting the")
International Federation of Clinical Chemistry [IFCC report 2006] • The document recommends reporting the concentration of glucose in plasma (with the unit mmol/L), irrespective of sample type or measurement technique. • A constant factor of 1. 11 is used to convert concentration in whole blood to the equivalent concentration in the pertinent plasma. This factor is based on the relationship between plasma and whole blood glucose at normal haematocrit (0. 43). • The conversion will provide harmonized results, facilitating the classification and care of patients and leading to fewer therapeutic misjudgments.

The Diagnosis Of DM • Most patients diagnosed on basis of symptoms, examination and random or fasting plasma glucose. • Oral Glucose Tolerance Test (OGTT). – 75 g oral glucose. Blood samples taken at 0 and 2 hours for blood sugar. – Reference Method – This test is only done if the random or fasting glucose result was equivocal or there was still a high index of suspicion

OGTT

Interpreting the OGTT WHO Criteria • Diabetes Mellitus – Fasting Plasma Glucose and/or – 2 Hour Post Dose ≥ 7. 0 mmol/L > 11. 0 mmol/L • Impaired Glucose Tolerance – Fasting Plasma Glucose < 7. 0 mmol/L – 2 Hour Post Dose ≥ 7. 8 & < 11. 1 mmol/L

Blood Glucose Testing • Laboratory Measurements – Performed mainly on venous plasma – Enzymatic (Hexokinase, Glucokinase) – Performed mainly on automated analysers
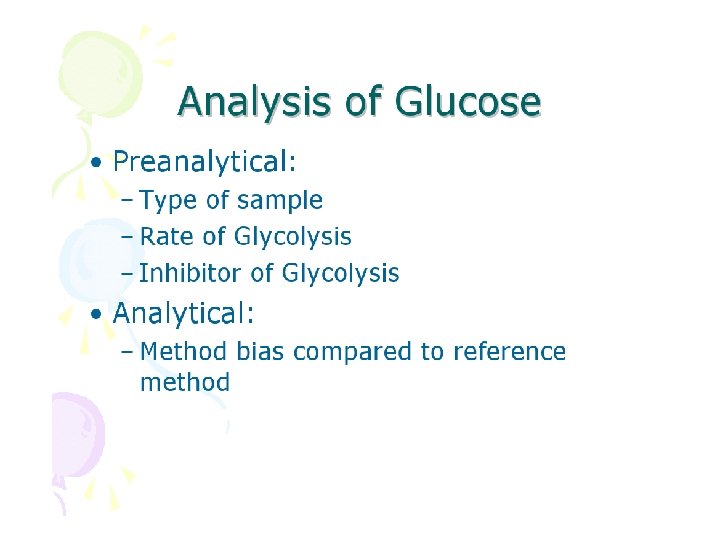

Blood Glucose Testing • Bedside Or Self Monitoring Tests. – e. g. BM Sticks, glucose meters, urine glucose. – Performed on whole blood. – Can be enzymatic, chemical or photoelectric. – Manual Techniques.

Glucose Meters

Monitoring Of Glycaemic Control • Daily. – Self monitoring of blood glucose concentrations. • Fortnightly – Fructosamine [glycated albumin] • Bi-Monthly - Quarterly – Total Glycosylated haemoglobins – Hb. A 1 c

Hb. A 1 c Measurements – Formed by non-enzymatic attachment of glucose to haemoglobin A – Formed slowly and continuously. – Normally less than 42 mmol/mol [<6 %] but in diabetics can increase 2 - 3 times – Provides an index to the “average” plasma glucose over the preceding 2 - 3 months.

Prediction Of Complications Using Microalbumin • Diabetic Nephropathy is a major complication in 35 - 45 % of IDDM – May progress to end stage renal failure • Microalbuminuria is the excretion of 50 - 200 mg albumin in 24 hours (< 25 mg/24 hours) • Detected by sensitive immunoassays [using antibodies directed against human albumin]

Prediction Of Complications Using Microalbumin • Early detection can allow reversal of nephropathy using: – Good glycaemic control – Hypotensives – Low protein diet • Once frank proteinuria has developed then improving glycaemic control may transiently slow down progression but will not reverse it.
 Ø Hyperosmolar non-ketotic coma")
Acute metabolic complications of diabetes mellitus Ø Diabetic ketoacidosis (DKA) Ø Hyperosmolar non-ketotic coma (HNC) Ø Lactic acidosis (LA) Ø Hypoglycaemia. All above usually require hospitalization

DKA results: in altered lipid metabolism increased concentrations of total lipids, cholesterol, triglycerides, and free fatty acids Free fatty acids are shunted into ketone body formation due to lack of insulin. The rate of formation of these ketone bodies exceeds the capacity for their peripheral utilization and renal excretion leading to accumulation of ketoacids, and therefore metabolic acidosis

• With progressive dehydration, acidosis, hyperosmolality, and diminished cerebral oxygen utilization, consciousness becomes impaired, and the patient ultimately becomes comatose. • Laboratory findings include: hyperglycemia, glucosuria, ketonaemia, ketonuria, and metabolic acidosis.

DKA Most serious complication in Type 1 Diabetes Precipitating factors • Not enough insulin • Skipping insulin • Stress, trauma • Insulin resistance

• Keotacidosis is responsible for the initial presentation of up to 25% of children – early manifestations are mild and include vomiting, polyuria, and dehydration – More severe cases include Kussmaul respirations, odor of acetone on the breath – abdominal pain or rigidity may be present and mimic acute appendicitis or pancreatitis – cerebral dehydration and coma ultimately ensue
![Hyperosmolar non-ketotic coma [HNC] Clinically defined by the presence of relative insulin deficiency and](http://slidetodoc.com/presentation_image_h/afed180dc8a6f9e791e0426c06f0a254/image-113.jpg "Hyperosmolar non-ketotic coma [HNC] Clinically defined by the presence of relative insulin deficiency and")
Hyperosmolar non-ketotic coma [HNC] Clinically defined by the presence of relative insulin deficiency and hyperglycemia, usually >55 mmol/L with associated elevated serum osmolality (>300 mosm/kg), dehydration, and stupor, progressing to coma if uncorrected, without the presence of ketosis or acidosis. These patients have sufficient circulating insulin to prevent lipolysis and ketosis. Precipitating factors dehydration, medications such as steroids and thiazides, acute illness, cerebral vascular disease, and advanced age.
![Lactic Acidosis [LA] Consists of elevated lactic acid (lactic acidaemia ≥ 2. 0 mmol/L)](http://slidetodoc.com/presentation_image_h/afed180dc8a6f9e791e0426c06f0a254/image-114.jpg "Lactic Acidosis [LA] Consists of elevated lactic acid (lactic acidaemia ≥ 2. 0 mmol/L)")
Lactic Acidosis [LA] Consists of elevated lactic acid (lactic acidaemia ≥ 2. 0 mmol/L) with acidosis (p. H ≤ 7. 30) and without ketoacidosis. There may be low levels of ketones present. Approximately half of the reported cases of LA have occurred in patients with diabetes. Currently, LA is rarely seen in diabetic patients, particularly since the withdrawal of the drug phenformin from the market. Precipitating factors • hypoxia and • some medications, such as phenformin

Hypoglycaemia Is common in insulin-treated diabetic patients and also occurs occasionally in patients treated with the oral hypoglycemic sulfonylurea agents. Hypoglycaemia may range from very mild lowering of glycaemia (3. 3 – 3. 9 mmol/l) with minimal or no symptoms, to severe hypoglycaemia with very low levels of glucose (<2. 2 mmol/l) and neurologic impairment. Hypoglycemia associated with insulin therapy may be related to errors in dosage, delayed or skipped meals, exercise and/or intensity of glycaemic control.
- Slides: 115