DISINFECTION Overview What is disinfection Types of disinfectants


 light rays as water")


 • Can lose up to 4% of its available chlorine content")


 • 99. 5% pure chlorine • yellow-green color 2. 5")


 Strongest of the common disinfecting agents")


 to be killed within")

 • May produce undesirable brominated byproducts in source waters containing bromide")

 Disadvantages • Forms the DBP chlorite • Costs associated with training,")


 requires 3 -log")


 which is")
 Flow rate 2) Flow path")


: • Different methods: 1. If water is pumped from the clearwell")
: • Must redo if peak hour demand flow increases more than")


 • Or,")


 – Report the following events immediately and conduct a filter profile")
 • Combined filter effluent (CFE) turbidity")
 to the")
 • Applicability – CF (2.")
 (cont. ) • Location –")

 – Must be calibrated per manufacturer")


 • Chemical feed pumps (cont. ) – Pump curve is")


 • Even automated systems require a knowledgeable person to correctly")


- Slides: 84
DISINFECTION
Overview • • What is disinfection? Types of disinfectants Forms of chlorine NSF/ANSI Standard 60 Disinfection requirements for surface water CTs Tracer Studies and Contact Time Impact of disinfectants on organics
What is disinfection? • Process of killing microorganisms in water that might cause disease (pathogens) • Should not be confused with sterilization which is the destruction of all microorganisms • Two types: – Radiation (UV) – Chemical (chlorine, chloramines, chlorine dioxide, ozone)
Ultraviolet light • Works by subjecting water to ultraviolet (UV) light rays as water passes through a tube • Drawbacks: – Interfering agents such as turbidity can screen pathogens from the UV light – Effective against Giardia and Cryptosporidium but not viruses at normal doses – No residual is present in the water to continue disinfecting throughout the distribution system – For this reason, chlorination for residual maintenance is required when UV is used
• The state maintains a list of approved UV units on its website • NSF 55 units not allowed for SW treatment (only allowed for GW TC+ with small distribution)
UV reactors at a large water system
Quartz UV bulb sleeve
Chemical Disinfection • • Chlorine Chloramines Chlorine dioxide Ozone
Chlorine • The most widely used form of disinfection • Also used as an oxidizing agent for iron, manganese and hydrogen sulfide and for controlling taste and odors • Effectiveness as a disinfecting agent depends on factors such as p. H, temperature, free chlorine residual, contact time and other interfering agents
Forms of Chlorine • • Sodium Hypochorite Onsite generated sodium hypochorite Calcium Hypochlorite Chlorine Gas
Sodium hypochlorite • The liquid form of chlorine • Clear and has a slight yellow color • Ordinary household bleach (~5% chlorine by solution) is the most common form • Industrial strength: 12% and 15% solutions
Sodium hypochlorite (continued) • Can lose up to 4% of its available chlorine content per month; should not be stored for more than 60 to 90 days • Very corrosive; should be stored and mixed away from equipment that can be damaged by corrosion
Diaphragm Pump/Tank for Chlorine
On-site generated sodium hypochlorite • 0. 8% sodium hypochlorite is produced on demand by combining salt, water & electricity • Electrolysis of brine solution produces sodium hydroxide and chlorine gas, which then mix to form sodium hypochlorite • Hydrogen gas byproduct; vented to atmosphere • Alleviates safety concerns associated w/ hauling and storing bulk chlorine • Higher initial cost, high power cost • Mixed oxidants (proprietary)
Electrodes for onsite chlorine generation
Calcium hypochlorite • • The solid form of chlorine Usually tablet or powder form Contains ~65% chlorine by weight White or yellowish-white granular material and is fairly soluble in water • Important to keep in a dry, cool place • More stable than liquid • Used by small systems w/ low flows or no power
Calcium hypochlorite erosion feeder
Calcium hypochlorite hopper interior
Chlorine gas (Cl 2) • 99. 5% pure chlorine • yellow-green color 2. 5 x heavier than air • Liquified at room temperature at ~107 psi – hence the pressurized cylinders actually contain liquified chlorine gas. • Liquified Cl 2 is released from tanks as chlorine gas, which is then injected into the water stream. • usually used only by large water systems • Smaller systems may find initial cost of operation prohibitive
1 -ton chlorine gas cylinders
1 -ton chlorine gas cylinders Note: scales used to weigh cylinders (to tell when they are empty)
150 -lbs chlorine gas cylinders Spare tank on hand Chain to secure tank in place Tanks clearly marked
Chloramines • Chlorine + ammonia = chloramination • Two advantages to regular chlorination: – produce a longer lasting chlorine residual (helpful to systems with extensive distribution systems) – may produce fewer by-products depending on the application • Disadvantage: – Need a lot of contact time to achieve CTs compared to free chlorine (300 times more) which is why not used for primary disinfection – Requires specific ratio of chlorine to ammonia or else potential water quality problems
Ammonia for making chloramines
Ozone • • • Colorless gas (O 3) Strongest of the common disinfecting agents Also used for control of taste and odor Extremely Unstable; Must be generated on-site Manufactured by passing air or oxygen through two electrodes with high, alternating potential difference
Large water system ozone
Large water system ozone
Ozone contactors
Ozone is to reactive to store, so liquid oxygen is used for making ozone
Ozone advantages • Short reaction time enables microbes (including viruses) to be killed within a few seconds • Removes color, taste, and odor causing compounds • Oxidizes iron and manganese • Destroys some algal toxins • Does not produce halogenated DBPs
Ozone disadvantages • • Overfeed or leak can be dangerous Cost is high compared with chlorination Installation can be complicated Ozone-destroying device is needed at the exhaust of the ozone-reactor to prevent smogproducing gas from entering the atmosphere and fire hazards
Ozone disadvantages (continued) • May produce undesirable brominated byproducts in source waters containing bromide • No residual effect is present in the distribution system, thus postchlorination is required • Much less soluble in water than chlorine; thus special mixing devices are necessary
Chlorine dioxide Advantages • More effective than chlorine and chloramines for inactivation of viruses, Cryptosporidium, and Giardia • Oxidizes iron, manganese, and sulfides • May enhance the clarification process • Controls T&O resulting from algae and decaying vegetation, as well as phenolic compounds • Under proper generation conditions halogen-substituted DBPs are not formed • Easy to generate • Provides residual
Chlorine dioxide (continued) Disadvantages • Forms the DBP chlorite • Costs associated with training, sampling, and laboratory testing for chlorite and chlorate are high • Equipment is typically rented, and the cost of the sodium chlorite is high • Explosive, so it must be generated on-site • Decomposes in sunlight • Can lead to production noxious odors in some systems.
NSF/ANSI Standard 60 • Addresses the health effects implications of treatment chemicals and related impurities. • The two principal questions addressed are: – Is the chemical safe at the maximum dose, and – Are impurities below the maximum acceptable levels?
NSF approved sodium hypochlorite
Disinfection Requirements for Surface Water • Surface Water Treatment Rule (SWTR) requires 3 -log reduction of Giardia using a combination of disinfection and filtration • 2. 0 to 2. 5 -log removal is achieved through filtration • 0. 5 to 1. 0 -log inactivation is achieved through disinfection • Determines which column of EPA tables used to calculate CTs (0. 5 or 1. 0 -log)
What are CT’s? • It’s a way to determine if disinfection is adequate • CT = Chlorine Concentration x Contact Time • Do not confuse “CT” and “Contact Time”
How do we calculate CT’s? • We use the EPA tables to determine the CTs needed to inactivate Giardia (CTrequired) – We need to know p. H, temperature, and free chlorine residual at the first user in order to use the EPA tables. • Then we compare that with the CTs achieved in our water system (CTactual) • CTactual must be equal to or greater than CTrequired
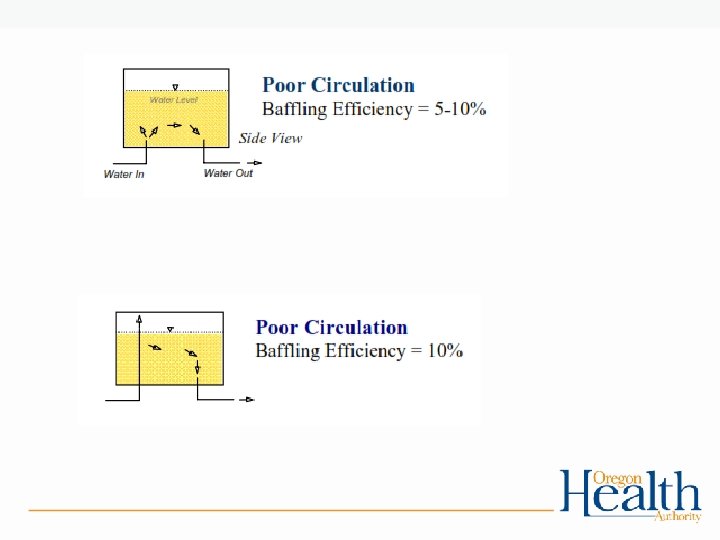
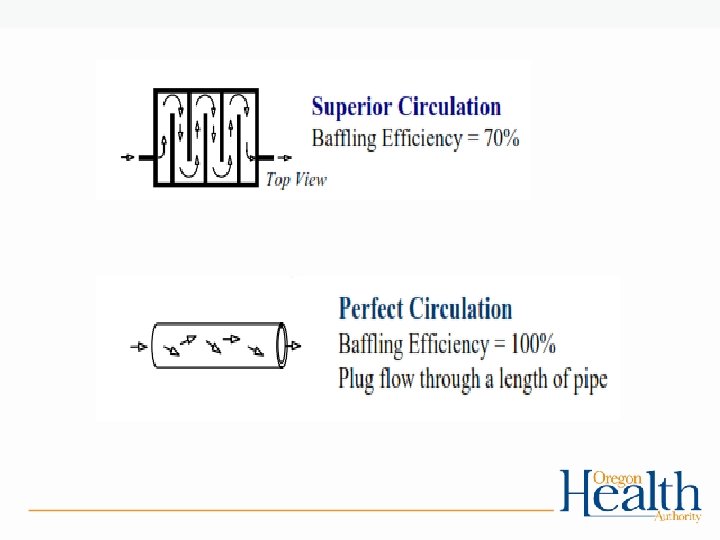
Tracer Studies and Contact Time: • Used to determine contact time (T) which is used in calculating CT’s • Determines the time that chlorine is in contact with the water from the point of injection to the point where it is measured (sometimes referred to as the “CT segment”) • May be at or before the 1 st user • May be more than one CT segment • Estimates of contact time are not allowed for calculating CT’s for surface water! – The degree of short-circuiting is only approximately known until a tracer study is conducted.
What effects short-circuiting? 1) Flow rate 2) Flow path
The CT segment is from where chlorine is added here:
Thru the clearwell, to where chlorine residual is measured here:
So if we were conducting a tracer study, this is the segment we would be looking at and determining the contact time T for.
Tracer studies (continued): • Different methods: 1. If water is pumped from the clearwell at different rates depending on time of year, do tracer study at each of those flow rates 2. Do at typical winter/summer peak hour demand flows 3. Otherwise use “worst-case scenario” parameters: • Highest flow rate out of clearwell (conduct during peak hour or conditions that simulate e. g. open a hydrant) • Keep flow rate constant • Keep clearwell water level close to normal minimum operating level
Tracer studies (continued): • Must redo if peak hour demand flow increases more than 10% of the maximum flow used during the tracer study • Community water systems with populations <10, 000 and non-profit non-community systems can use the circuit rider to perform a tracer study • Must submit a proposal to DWS for approval prior to conducting the tracer study (even if using the circuit rider).
Exercise #1 • Tracer studies
Exercise #1: Tracer studies Directions: Look at the diagram and answer the questions. Figure 1: Water Treatment Plant Smith Creek NTU, flow Slow sand filter #1 Slow sand filter #2 NTU Chlorine injection Two houses Flow control valve: 270 gpm max Reservoir 75, 000 gal. 16. 1’ max volume Clearwell 220, 000 gal 10. 5’ min volume Flow To distribution Questions: • If this was your treatment plant, highlight the part of the plant where you might conduct a tracer study. • In a “worst-case scenario” tracer study, what would the flow rate be? • In a “worst-case scenario” tracer study, what would the clearwell level be?
Exercise #1: Tracer studies Directions: Look at the diagram and answer the questions. Figure 1: Water Treatment Plant Smith Creek NTU, flow Slow sand filter #1 Slow sand filter #2 NTU Chlorine injection Two houses Flow control valve: 270 gpm max Reservoir 75, 000 gal. 16. 1’ max volume Clearwell 220, 000 gal 10. 5’ min volume Flow To distribution Questions: • If this was your treatment plant, highlight the part of the plant where you might conduct a tracer study. • In a “worst-case scenario” tracer study, what would the flow rate be? • In a “worst-case scenario” tracer study, what would the clearwell level be? 270 gpm 10. 5 feet
How info from tracer study is used to calculate CTs • Use the time T from the tracer study on the monthly reporting form in the “Contact time (min)” column – Use the smallest T (highest flow) if the tracer study was done at multiple flow rates • This may not be your exact time, but it represents your worst case (as long as the peak flow is less and clearwell volume is more than they were at the time of the tracer study)
How info from tracer study is used to calculate CTs (cont. ) • Or, once you know the time T from the tracer study, you can back-calculate to determine the baffling factor of the clearwell • Baffling factor (%) = Time (min) x Flow During Tracer Study (gpm) Clearwell Volume During Tracer Study (gal) • T can be adjusted based on flow (at <110%) with the following equation: • T = Current clearwell Volume (gal) x Baffling Factor (%) Peak Hourly Demand Flow (gpm) • If tracer study includes pipeline segments or multiple tanks, contact the state for guidance on using baffling factors
Impact of chlorine and ozone on organics • Disinfectants can react with organics to form disinfection byproducts – Chlorine: TTHMs & HAA 5 s – Ozone: Bromate • Pre-chlorination • TOC
OPERATIONS
Overview • Proper instrument sampling locations • Proper treatment plant sampling locations – Turbidity – Chlorine residual – TOC • Instrument calibration – Turbidimeters – Chlorine analyzers – Chemical feed pumps • Operations & Maintenance Manuals
Proper instrument sampling location • Data provided by instruments provides the basis for assessing water quality – important to get it right! • Common problems – Sampling location – Measurement techniques – Calibration frequency and approach • Possible solutions – – May require investigations (special studies) Modifications to sample lines Establish guidelines on sample line cleaning Establish calibration procedure
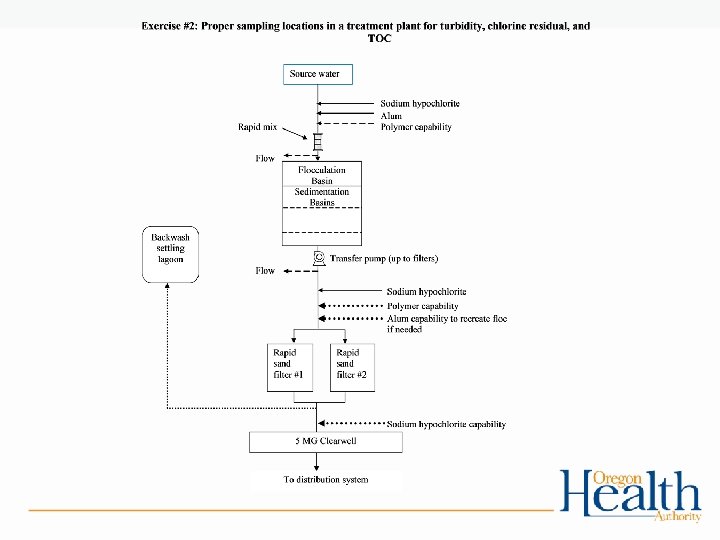
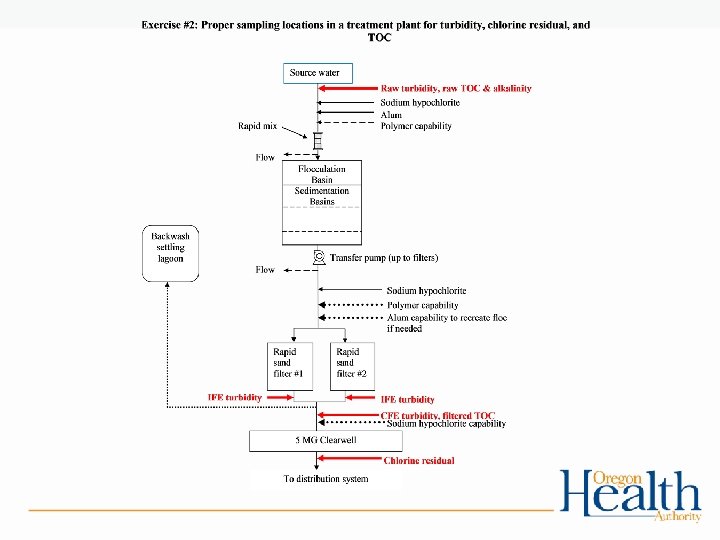
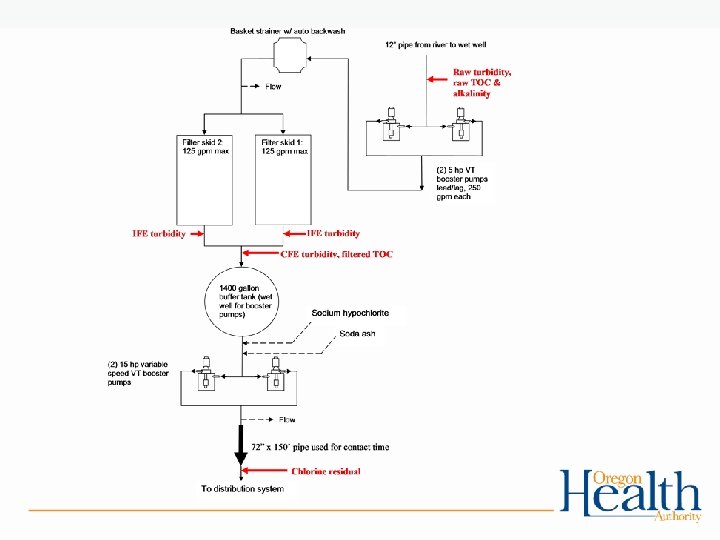
Proper treatment plant sampling locations: Turbidity • Raw turbidity – Applies to all SW systems – Location: pre-treatment – Frequency: no regulatory requirement but need to know for proper treatment plant operation • Individual filter effluent (IFE) turbidity – – CF, DF & membranes only Location: after each individual filter Frequency: continuous (every 15 minutes) Know what the triggers are!
IFE Triggers (Conventional/Direct) – Report the following events immediately and conduct a filter profile within 7 days (if no obvious reason exists) if the IFE turbidity is: • > 1. 0 NTU in 2 consecutive 15 -min readings • > 0. 5 NTU in 2 consecutive 15 -min readings within 4 hours of being backwashed or taken off-line – Report the following events and conduct a filter self assessment within 14 days if the IFE turbidity is: • > 1. 0 NTU in 2 consecutive 15 -min readings at any time in each of 2 consecutive months. – A CPE must be done within 30 days if the IFE turbidity is: • > 2. 0 NTU in 2 consecutive 15 -min readings at any time in each of 2 consecutive months.
Proper treatment plant sampling locations: Turbidity (cont. ) • Combined filter effluent (CFE) turbidity – Applies to all SW systems – Location: post all filtration prior to chemical addition and any storage – Frequency: • CF/DF > 3, 300 pop. – continuous • CF/DF ≤ 3, 300 pop. – every 4 hrs • Alternative - daily
Proper treatment plant sampling locations: Chlorine residual • Location: entry point (EP) to the system – EP = post clearwell, at or before 1 st user • Frequency – Continuous > 3, 300 population – 1 -4 x/day for ≤ 3, 300 population • Must maintain minimum 0. 2 ppm at all times
Proper treatment plant sampling locations: Total organic carbon (TOC) • Applicability – CF (2. 5 -log plants): required raw TOC & alkalinity and filtered TOC – All others: raw TOC required to qualify for DBP monitoring reduction (>500 population) • Frequency – Monthly; may be reduced to Quarterly if filtered TOC is <2. 0 ppm for 2 years, or <1. 0 ppm for 1 year – Quarterly if DBP reduction is granted
Proper treatment plant sampling locations: Total organic carbon (TOC) (cont. ) • Location – Raw TOC & alkalinity: pre-treatment – Filtered TOC: CFE prior to chemical addition/disinfection • <2. 0 ppm for 2 years, or Coagulant • <1. 0 ppm for 1 year Chlorine
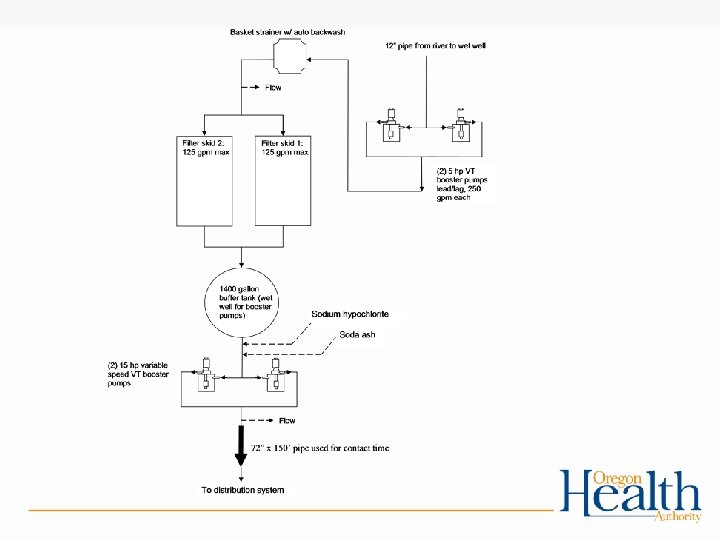
Exercise #2 • Proper sampling locations for turbidity, chlorine residual, and TOC – Work in groups to determine proper sampling locations on WTP diagrams
Instrument calibration • Turbidimeters (online, portable or benchtop) – Must be calibrated per manufacturer or at least quarterly with a primary standard • Formazin solution • Stablcal (stabilized formazin) – Secondary standards used for day-to-day check – Check is used to determine if calibration with a primary standard is necessary • Gelex • Manufacturer provided (e. g. Hach ICE-PIC)
Portable turbidimeter
Instrument calibration • Chlorine analyzers – Handheld • Follow manufacturer’s instructions – Inline • Check calibration against a handheld that has been calibrated • At least weekly • Follow manufacturer’s instructions if out of calibration
Portable colorimeter
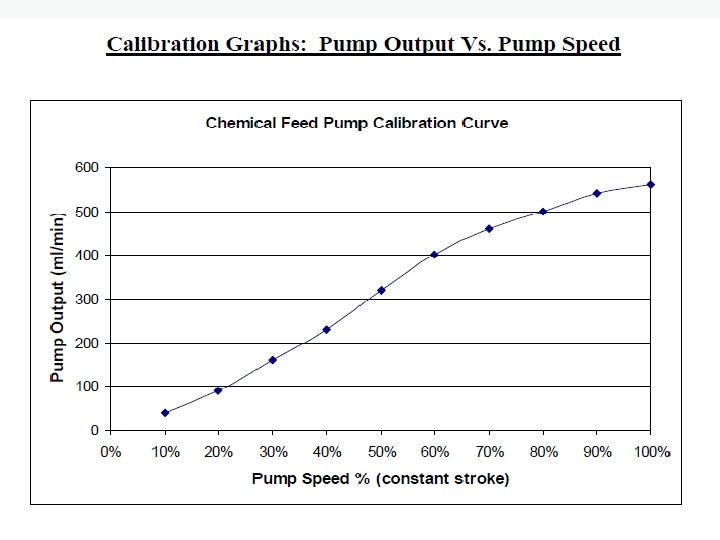
Instrument calibration • Chemical feed pumps – Calibration measures both the speed and the stroke (amount of chemical pumped) so accurate dosages can be calculated – Create a “pump curve”; • Set the stroke at half way point • On a graph, plot speeds of 10% to 100% on X axis • Plot chemical output amount on Y axis (ml/min) • Record drawdown in graduated cylinders for 1 minute
Instrument calibration (cont. ) • Chemical feed pumps (cont. ) – Pump curve is an important tool to identify when a pump may be in need of maintenance or replacement – A smooth pump curve is good (should fit close to a straight line) – Must compare information at varying speeds to be a full pump calibration process – Suggested frequency: no less than annual
Chemical feed pumps
Exercise #3 • Create a pump curve using made-up data points • Directions: Use the data provided in the examples below to create a pump curve. Pump curves should be smooth and fairly linear. A bouncing or jagged pump curve indicates the pump needs maintenance. Maintenance needed may include cleaning, diaphragm replacement and/or seal replacement.
Exercise #3: Creating a chemical feed pump curve Directions: Use the data provided in the examples below to create a pump curve. Pump curves should be smooth and fairly linear. A bouncing or jagged pump curve indicates the pump needs maintenance. Maintenance needed may include cleaning, diaphragm replacement and/or seal replacement. Feed pump #1 pump curve data: Plot the data points on the graph. Does the pump need maintenance? Yes (jagged line) Setting % Speed 10% 20% 30% 40% 50% 60% 70% 80% 90% 100% Time Minutes 3 3 3 1 1 1 Volume ml 60 360 420 810 900 450 400 525 530 575 Flow Rate ml/min 20 140 270 300 450 400 525 530 575
Feed pump #2 pump curve data: Plot the data points on the graph. Does the pump need maintenance? No (straight-ish, smooth line) Setting % Speed 10% 20% 30% 40% 50% 60% 70% 80% 90% 100% Time Minutes 3 3 3 1 1 1 Volume ml 120 270 480 690 960 400 460 500 540 560 Flow Rate ml/min 40 90 160 230 320 400 460 500 540 560
Bonus question: Referring to feed pump #2 data above, if you normally have your speed set at 50% in order to maintain 1 ppm of chemical, what speed do you need to change it to if you do a new pump curve and get the following results: Feed pump #2 NEW pump curve data Answer: 60% Setting % Speed 10% 20% 30% 40% 50% 60% 70% 80% 90% 100% Time Minutes 3 3 3 1 1 1 Volume ml 60 120 270 480 690 320 400 460 500 540 Flow Rate ml/min 20 40 90 160 230 320 400 460 500 540
Lessons learned from data assessments done in the past • Common findings: – Most systems have some problems with the way they monitor, record, assemble, and/or report data – Operators do not know which data to report and which to exclude – Operators do not know how to correctly use their tracer studies/calculate CTs – Most system managers and operators are surprised by what they find out from a data assessment
Data assessments (cont. ) • Even automated systems require a knowledgeable person to correctly assemble data • Data assessments often used to justify invalidation of turbidity data which would have triggered a CPE • Effective optimization can only be achieved when using valid performance data
How can operators become better data managers? • Make data reliability a plant goal • Only collect data used for process control or compliance reporting • Establish protocols for collection and recording of data • Establish a data verification process that can be routinely used to confirm data integrity • Turn data into information!
Operations & Maintenance Manual Keep written procedures on: • Instrument calibration methods and frequency • Data handling/reporting • Chemical dosage determinations • Filter operation and cleaning • CT determinations • Responding to abnormal conditions (emergency response plan)