Discriminative Network Models of Schizophrenia G A Cecchi


 correlation between BOLD(i) and")


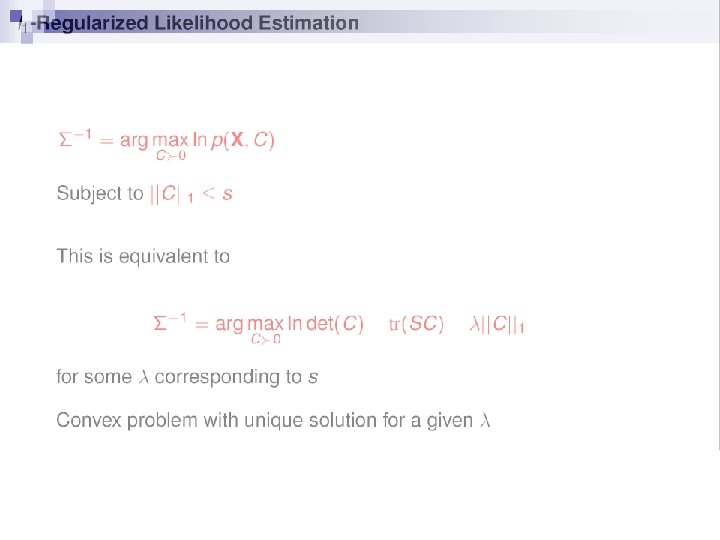
 Markov Random Field Classifier • L 1 -regularized inverse-covariance selection problem •")


")
: 86% accuracy Mental state prediction")
")


- Slides: 22
Discriminative Network Models of Schizophrenia G. A. Cecchi I. Rish Computational Biology IBM Watson Research, NY J. -L. Martinot J. -B. Poline M. -L. Paillere-Martinot B. Thyreau M. Plaze B. Thirion Frédéric Joliot Hospital, CEA Orsay, France Neurospin, CEA Saclay, France C. Martelli Centre Hospitalier P. Brousse Villejuif, France
What schizophrenia is n Affects 0. 5 -1% of world population n Positive symptoms (psychosis): ¨ Hallucinations n ¨ n Disorganized thoughts Negative symptoms: ¨ n Delusions Cognitive – organizational: ¨ n Mostly auditory (theory of “inner speech”) Poor socialization Not a simple psychiatric disease, not easy to diagnose ¨ As with many things, Europeans and Yanks don’t agree (Bentall, 2003)
Schizophrenia as a network disorder n Not a localized dysfunction, spatially or even mechanistically (i. e. dopamine theory) n Schizophrenia is hypothesized to be a disconnection syndrome (Wernicke 1906; Bleuler, 1911; Friston & Frith, 1995)
Our Questions n What specific effects does schizophrenia have on functional networks as defined by f. MRI? n Are network disruptions explainable by area-specific, task-dependent linear disruptions? n Is it possible to use functional networks to provide for consistent predictive modeling?
Experimental paradigm: simple auditory task* 8, 95 secs 4 s Sentence 3, 5 s Response 1 3, 5 s Tone: 200 ms Silence 750 ms Response 2 Cue 500 ms 96 trials, with 32 sentences in French (native), 32 sentences in foreign languages, and 32 silence interval controls. Two runs n Patient Group (11 subjects) ¨ Prone to auditory hallucinations ¨ Native French speakers, right-handed, 3+ yrs. illness n Normal Group (11 subjects) *M. Plaze, et al. , Schizophrenia Research (2006)
Our analysis approach n n Hypothesis-testing: significant group differences? ¨ Model-driven linear activations (GLM analysis) (no) ¨ Model-driven Region-of-Interest (ROI) analysis (no) ¨ Data-driven functional network topology analysis (yes) Predictive Modeling: is accurate classification possible? (yes) ¨ Feature Extraction: topological, data-driven vs. linear, modeldriven
Linear activations: mass-univariate approach n For each voxel, compute a score (e. g. , correlation) reflecting how well its activity matches the stimulus sequence n Threshold the scores to select only statistically significant ones No statistically significant differences across groups Voxel interactions are ignored? f. MRI activation image and time-course - Courtesy of Steve Smith, FMRIB
Model-driven networks: ROI analysis 600 ROI’s found through contrast similarity and spatial proximity* Correlation matrix A priori identified 10 relevant ROI’s No statistically significant differences across groups ‘Wrong’ networks? *B. Thirion, et al. , Human Brain Mapping (2006)
* Functional networks: voxel-based correlations n Network link (i, j) correlation between BOLD(i) and BOLD(j) is above a threshold (0. 7) for all voxels n Degree maps: degree(voxel i) = number of its neighbors in the network Variety of degree maps: Full degree maps ¨ Long-distance degree maps – nonlocal connections (> 5 voxels apart) ¨ inter-hemispheric degree maps – only links between the hemispheres ¨ Group differences significant *V. Eguíluz, et al. , Physical Review Letters (2005)
Degree maps reveal a distinctive pattern - Degree maps show a clear pattern even after FDR correction - Schizophrenic patients lack “hubs” in auditory/language areas - Linear activation contrasts not significant, in particular in the hub areas FDR-corrected (full) Degree Maps 2 -sample t-test performed for each voxel in degree and activation maps, followed by FDR correction Red/yellow: Normal subjects have higher values than Schizophrenics False-Discovery Rate (FDR): - degree maps: 1033 voxels - activation maps: 0 -7 voxels
Moreover: disrupted inter-hemispheric connectivity schizophrenic normal For each subject, we compute the fraction of inter-hemispheric connections over the total number of connections (relative link density), and plot anormalized histogram over all subjects in a group. • Schizophrenics have significantly less inter-hemispheric links • However, there is no difference in the total number of links • It seems the “disconnection” is a “re-wiring”
Classification: degree is a better feature • Degree features consistently outperform activation features • SVM achieves 84% accuracy with full degree maps • Sparse MRF classifier achieves 86% with only 100 -300 voxels! Support Vector Machines Sparse Markov Random Fields
Degree features are more stable than activations n When selecting top-K most significant voxels over data subsets in leavesubject-out cross-validation, degree maps yield higher overlap (~70% common voxels), unlike activation maps
Sparse (Gaussian) Markov Random Field Classifier • L 1 -regularized inverse-covariance selection problem • Learn an MRF for each class separately • Outperforms linear classifiers (e. g. , SVM, Gaussian NB)
Conclusions We present evidence that schizophrenia implies a significant disruption of functional networks, such that n It cannot be explained by a disruption to area-based, linear task-dependent responses, i. e. it affects emergent properties n It is non-local in nature n It can be leveraged to build accurate and stable predictive models, even for a simple task Thanks for your attention POSTER T 68
Beyond Correlations: Learning Probabilistic Graphical Models Our Focus: Markov Networks 1. Unlike functional (correlation) networks, Markov Networks are probabilistic models allowing for statistical inference: - predicting future brain states from the past - classifying current brain states - assessing the likelihood of the mental disease at early stages, etc. 2. Unlike some other ‘black-box’ predictors, Markov Networks are interpretable: - edges represent (conditional) dependencies among nodes (genes, voxels)
Markov Net Classifiers Make Quite Accurate Predictions Schizophrenia (Neurospin): 86% accuracy Mental state prediction (sentence vs picture): 90 -95% accuracy T. Mitchell et al. , Learning to Decode Cognitive States from Brain Images Machine Learning, 2004. Data @ www. cs. cmu. edu/afs/cs. cmu. edu/project/theo-81/www/ MRF classifiers can often exploit informative interactions among variables and outperform state-of-art linear classifiers (e. g. , SVM)
Markov Networks (Markov Random Fields)
References 1. Cecchi, G. , Rish, I. , R. Garg, Martinot, J-L. , Plaze, M. , Thyreau, B. , Thirion, B. , Poline, J-B. (2009). Predictive Network Models of Schizophrenia. Under review. 2. Scheinberg, K. and Rish, I. (2009) SINCO - a greedy coordinate ascent method for sparse inverse covariance selection problem. Under review. 3. K. Scheinberg, N. Bani Asadi, I. Rish (2009). Sparse MRF Learning with Priors on Regularization Parameters, IBM Technical Report RC 24812. 4. N. Bani Asadi, I. Rish, K. Scheinberg, D. Kanevsky, B. Ramabhadran (2009). A MAP Approach to Learning Sparse Gaussian Markov Networks, ICASSP-09. 5. Rish, I. , Carroll, M. , Cecchi, G. Garg, R. , Rao, R. , Bani Asadi, N. , Scheinberg, K. (2009). Sparse Modeling in f. MRI Analysis. Abstract presented at Human Brain Mapping (HBM 2009). 6. Carroll, M. K. , Cecchi, G. , Rish, I. , Garg, R. , Rao, A. R. (2009) Prediction and Interpretation of Distributed Neural Activity with Sparse Models, Neuroimage, Jan. 2009. 7. M. Plaze et al. (2006). Left superior temporal gyrus activation during sentence perception negatively correlates with auditory hallucination severity in schizophrenia patients. Schizophrenia Research, Volume 87, Issue 1, Pages 109 -115. 8. V. M. Eguiluz D. R. Chialvo, G. A. Cecchi, M. Baliki, A. V. Apkarian (2005). Scale-free functional brain networks. Phys. Rev. Letters 94, 018102. 9. Y. Liu et al. (2008). Disrupted small-world networks in schizophrenia. Brain, Feb. 2008.
Classification: degree vs. activation features