
Discretetime Random Signals n n n Until now



- Slides: 34
Discrete-time Random Signals n n n Until now, we have assumed that the signals are deterministic, i. e. , each value of a sequence is uniquely determined. In many situations, the processes that generate signals are so complex as to make precise description of a signal extremely difficult or undesirable. A random or stochastic signal is considered to be characterized by a set of probability density functions.
Stochastic Processes n Random (or stochastic) process (or signal) n n n A random process is an indexed family of random variables characterized by a set of probability distribution function. A sequence x[n], <n< . Each individual sample x[n] is assumed to be an outcome of some underlying random variable Xn. The difference between a single random variable and a random process is that for a random variable the outcome of a random-sampling experiment is mapped into a number, whereas for a random process the outcome is mapped into a sequence.
Stochastic Processes (continue) n Probability density function of x[n]: n Joint distribution of x[n] and x[m]: n Eg. , x 1[n] = Ancos(wn+ n), where An and n are random variables for all < n < , then x 1[n] is a random process.
Independence and Stationary n x[n] and x[m] are independent iff n x is a stationary process iff for all k. n That is, the joint distribution of x[n] and x[m] depends only on the time difference m n.
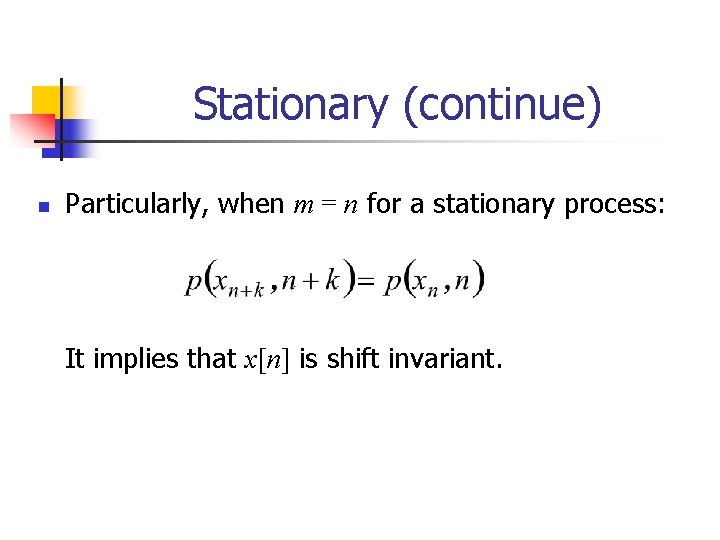
Stationary (continue) n Particularly, when m = n for a stationary process: It implies that x[n] is shift invariant.
Stochastic Processes vs. Deterministic Signal n n In many of the applications of discrete-time signal processing, random processes serve as models for signals in the sense that a particular signal can be considered a sample sequence of a random process. Although such a signals are unpredictable – making a deterministic approach to signal representation is inappropriate – certain average properties of the ensemble can be determined, given the probability law of the process.
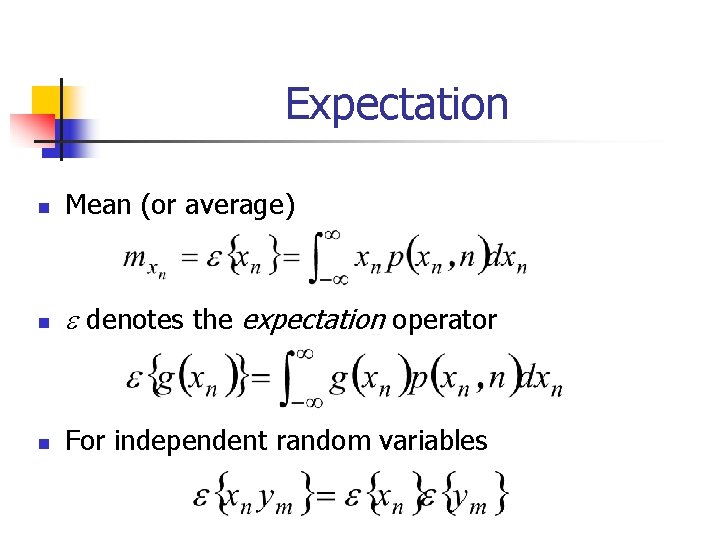
Expectation n Mean (or average) n denotes the expectation operator n For independent random variables
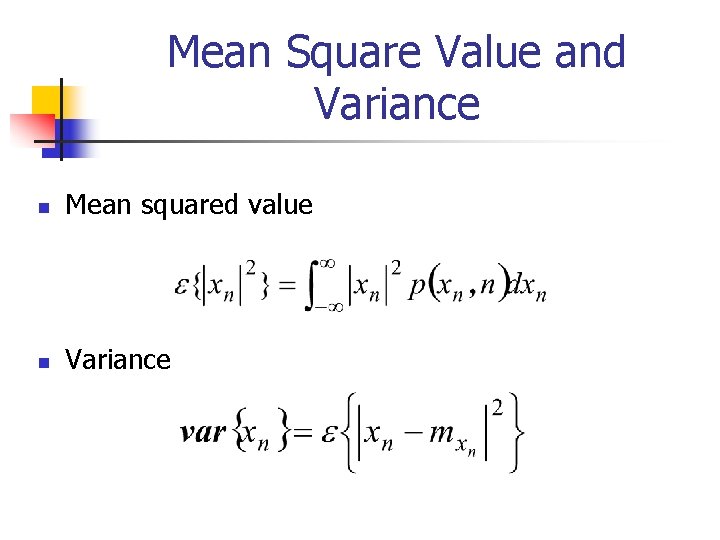
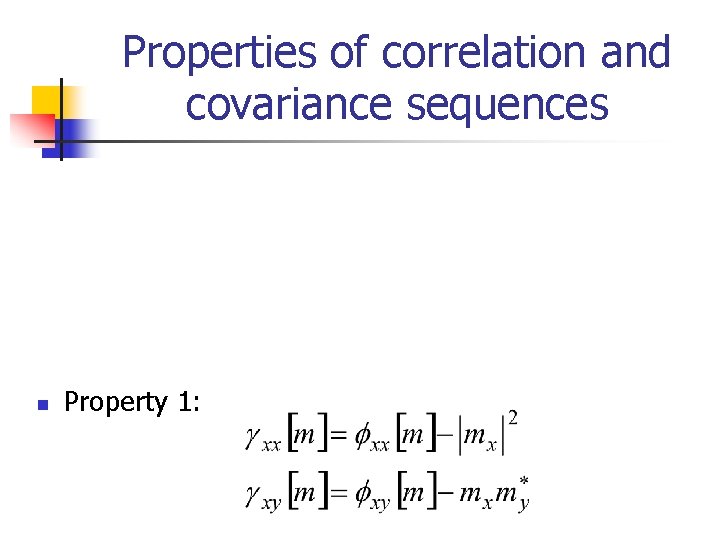
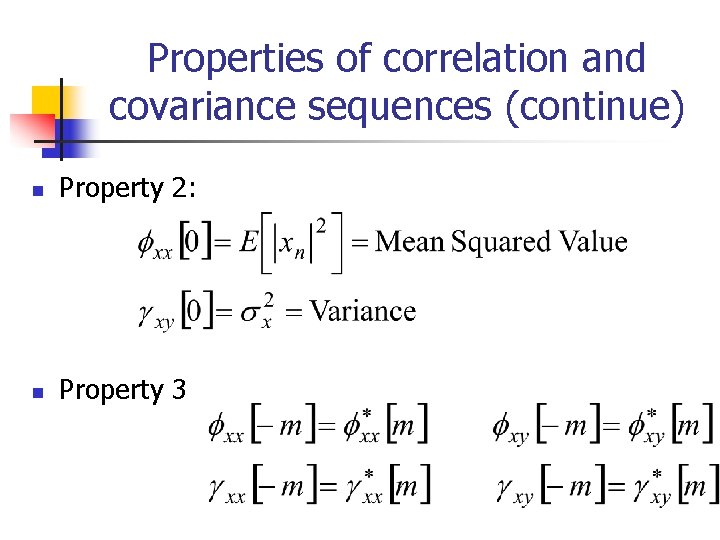
Mean Square Value and Variance n Mean squared value n Variance
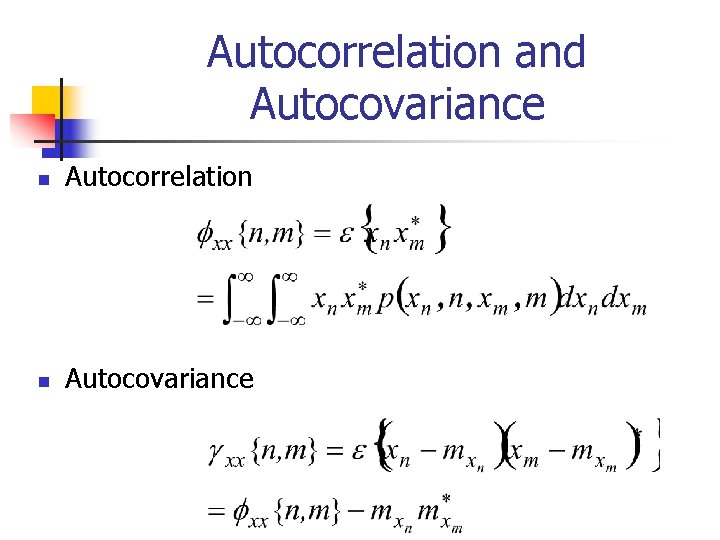
Autocorrelation and Autocovariance n Autocorrelation n Autocovariance
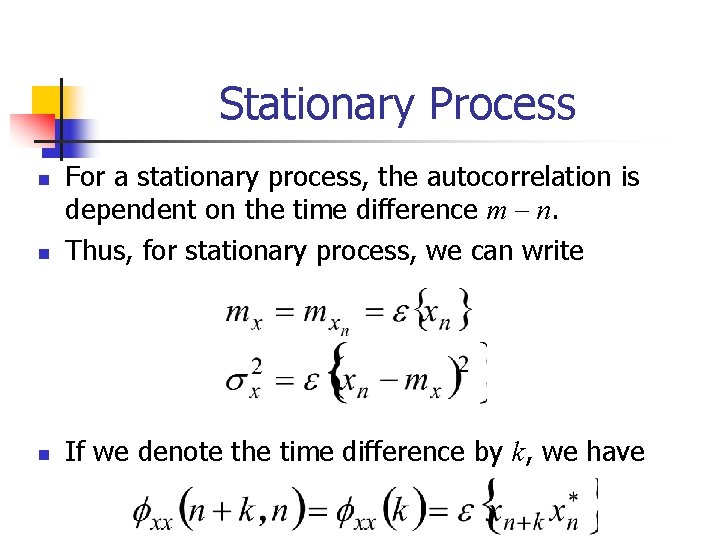
Stationary Process n For a stationary process, the autocorrelation is dependent on the time difference m n. Thus, for stationary process, we can write n If we denote the time difference by k, we have n
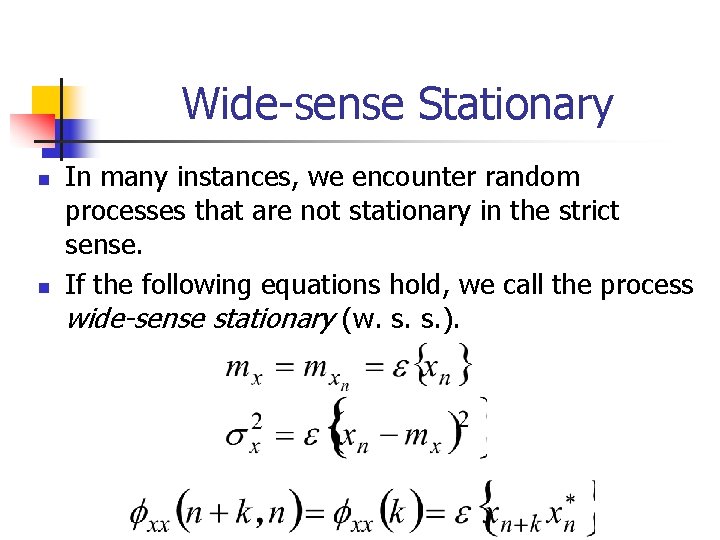
Wide-sense Stationary n n In many instances, we encounter random processes that are not stationary in the strict sense. If the following equations hold, we call the process wide-sense stationary (w. s. s. ).
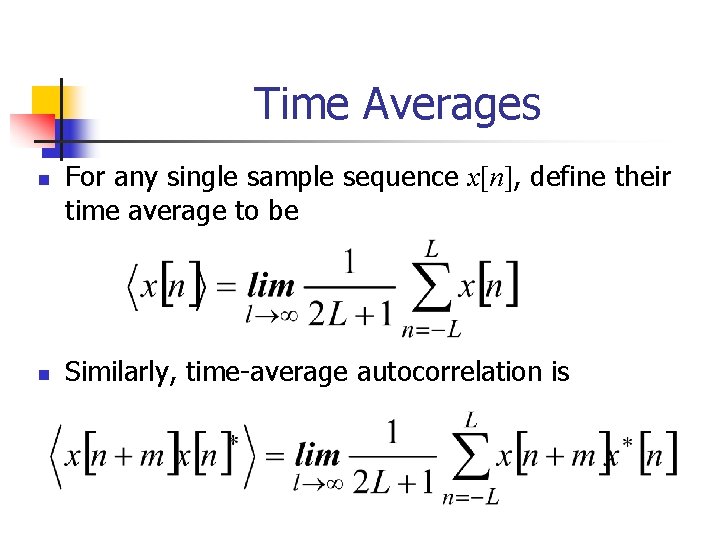
Time Averages n n For any single sample sequence x[n], define their time average to be Similarly, time-average autocorrelation is
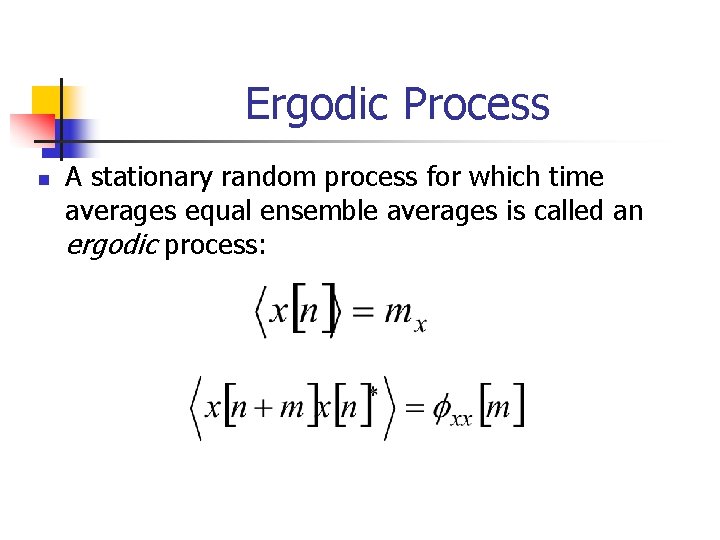
Ergodic Process n A stationary random process for which time averages equal ensemble averages is called an ergodic process:
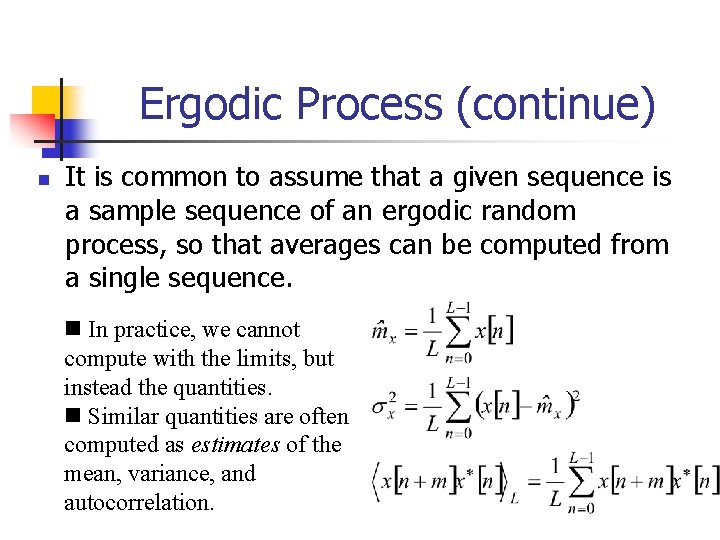
Ergodic Process (continue) n It is common to assume that a given sequence is a sample sequence of an ergodic random process, so that averages can be computed from a single sequence. n In practice, we cannot compute with the limits, but instead the quantities. n Similar quantities are often computed as estimates of the mean, variance, and autocorrelation.
Properties of correlation and covariance sequences n Property 1:
Properties of correlation and covariance sequences (continue) n Property 2: n Property 3
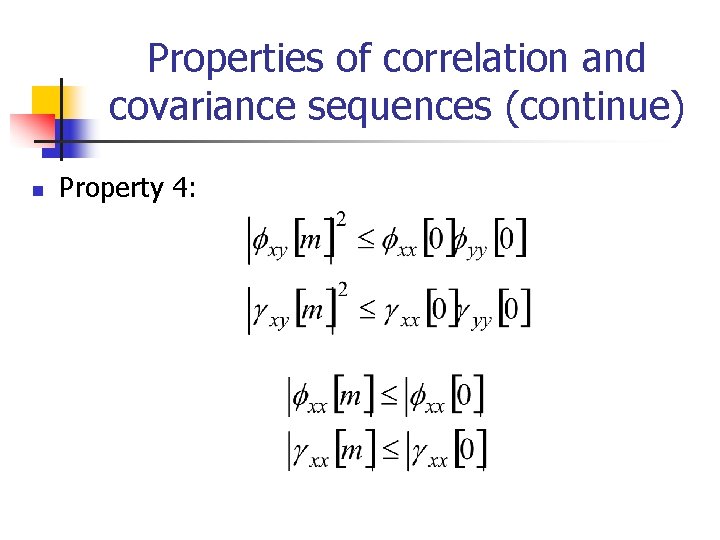
Properties of correlation and covariance sequences (continue) n Property 4:
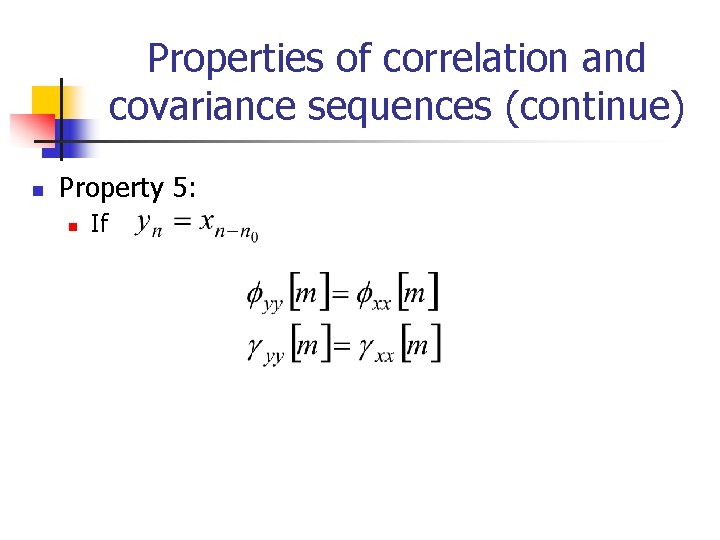
Properties of correlation and covariance sequences (continue) n Property 5: n If
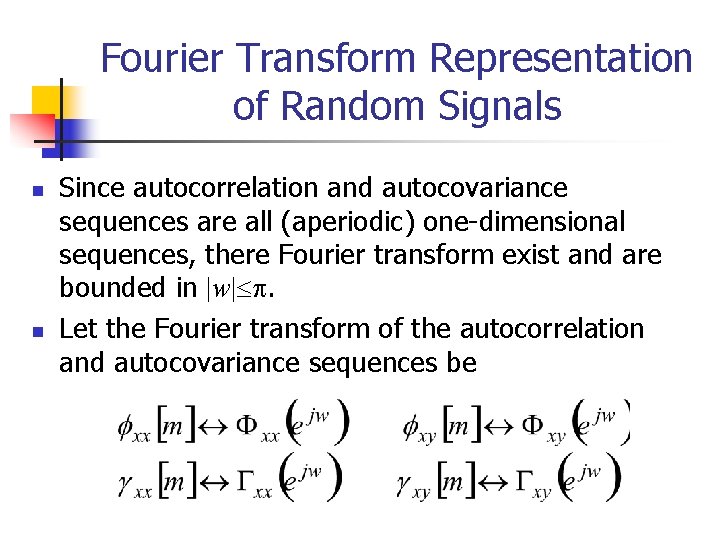
Fourier Transform Representation of Random Signals n n Since autocorrelation and autocovariance sequences are all (aperiodic) one-dimensional sequences, there Fourier transform exist and are bounded in |w| . Let the Fourier transform of the autocorrelation and autocovariance sequences be
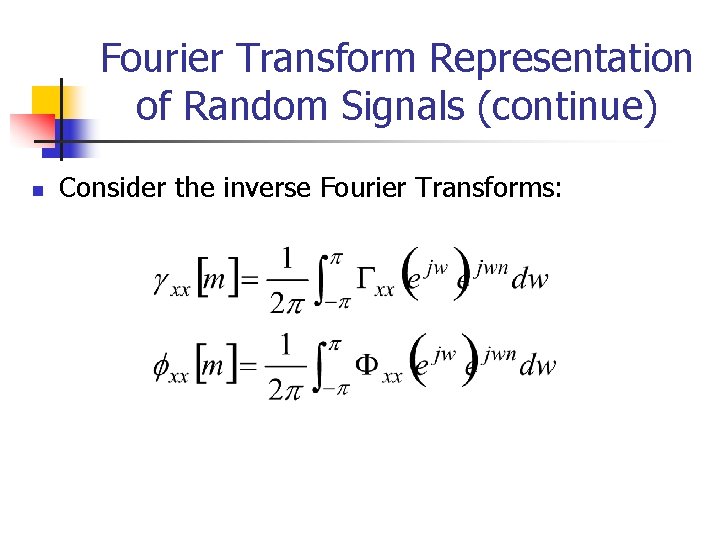
Fourier Transform Representation of Random Signals (continue) n Consider the inverse Fourier Transforms:
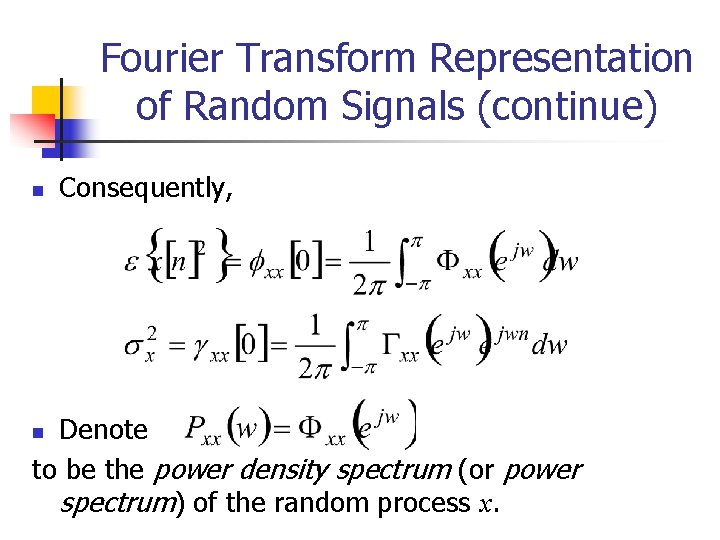
Fourier Transform Representation of Random Signals (continue) n Consequently, Denote to be the power density spectrum (or power spectrum) of the random process x. n
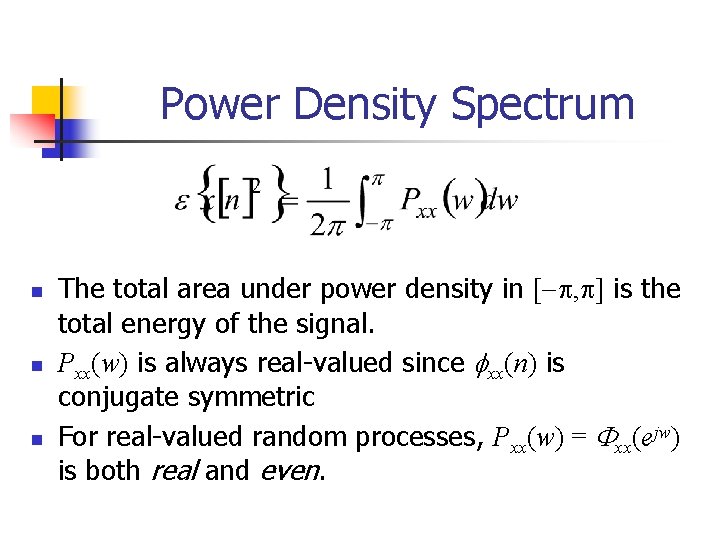
Power Density Spectrum n n n The total area under power density in [ , ] is the total energy of the signal. Pxx(w) is always real-valued since xx(n) is conjugate symmetric For real-valued random processes, Pxx(w) = xx(ejw) is both real and even.
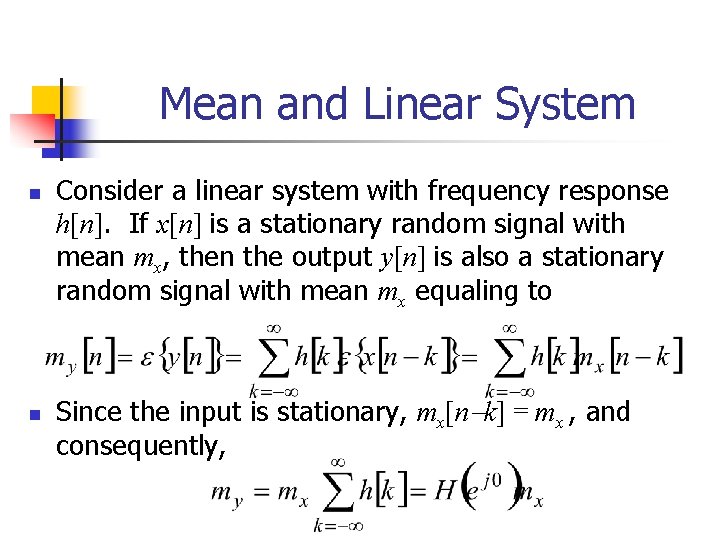
Mean and Linear System n n Consider a linear system with frequency response h[n]. If x[n] is a stationary random signal with mean mx, then the output y[n] is also a stationary random signal with mean mx equaling to Since the input is stationary, mx[n k] = mx , and consequently,
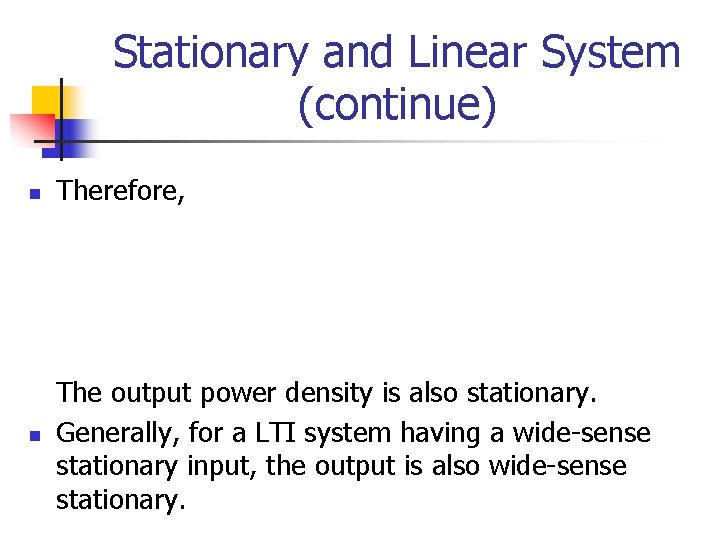
Stationary and Linear System n n If x[n] is a real and stationary random signal, the autocorrelation function of the output process is Since x[n] is stationary , {x[n k]x[n+m r] } depends only on the time difference m+k r.
Stationary and Linear System (continue) n Therefore, n The output power density is also stationary. Generally, for a LTI system having a wide-sense stationary input, the output is also wide-sense stationary.
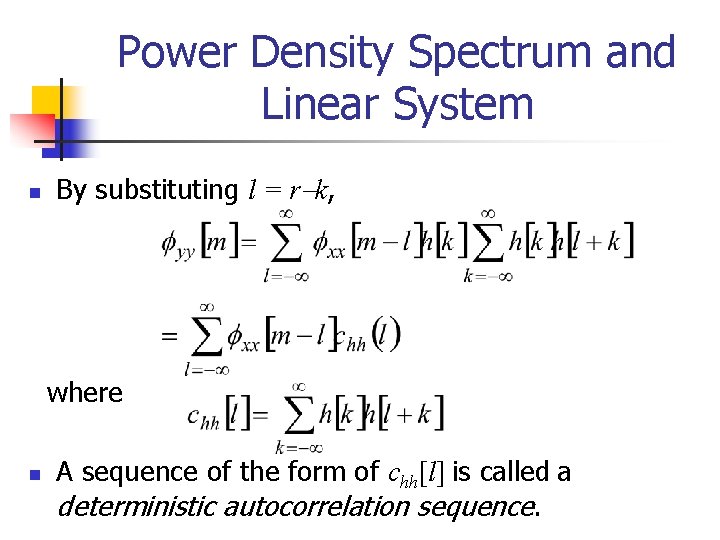
Power Density Spectrum and Linear System n By substituting l = r k, where n A sequence of the form of chh[l] is called a deterministic autocorrelation sequence.
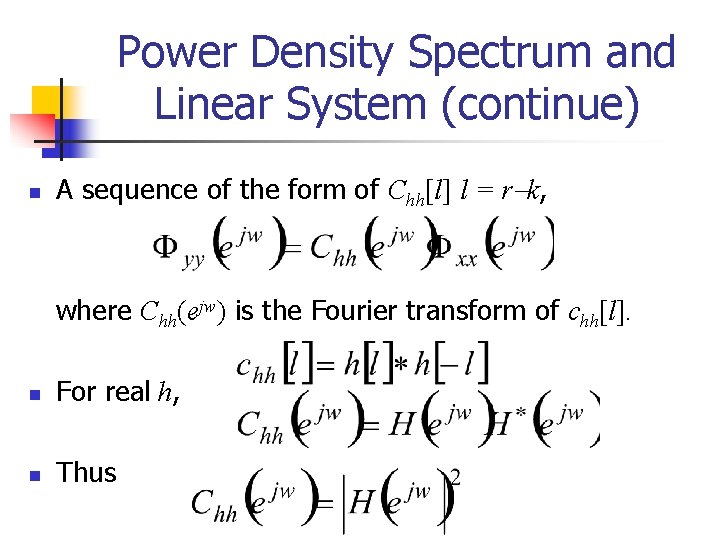
Power Density Spectrum and Linear System (continue) n A sequence of the form of Chh[l] l = r k, where Chh(ejw) is the Fourier transform of chh[l]. n For real h, n Thus
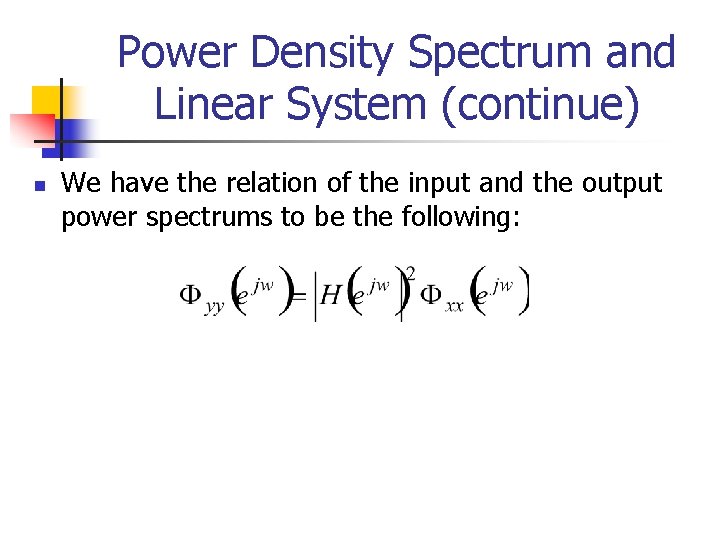
Power Density Spectrum and Linear System (continue) n We have the relation of the input and the output power spectrums to be the following:
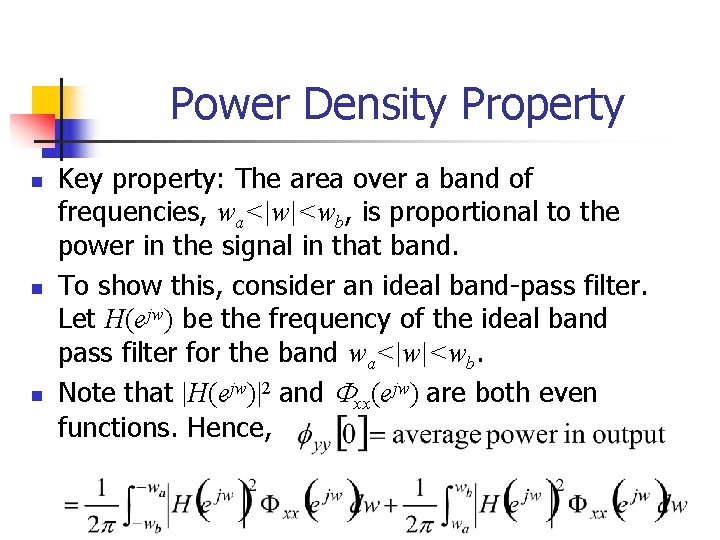
Power Density Property n n n Key property: The area over a band of frequencies, wa<|w|<wb, is proportional to the power in the signal in that band. To show this, consider an ideal band-pass filter. Let H(ejw) be the frequency of the ideal band pass filter for the band wa<|w|<wb. Note that |H(ejw)|2 and xx(ejw) are both even functions. Hence,
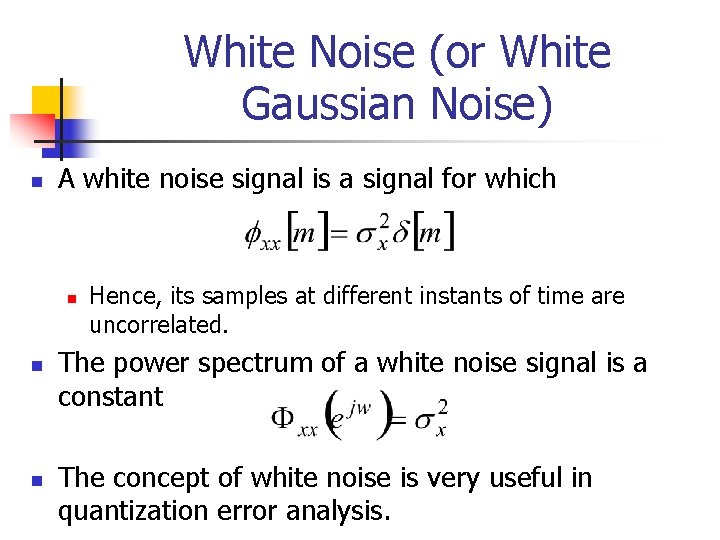
White Noise (or White Gaussian Noise) n A white noise signal is a signal for which n n n Hence, its samples at different instants of time are uncorrelated. The power spectrum of a white noise signal is a constant The concept of white noise is very useful in quantization error analysis.
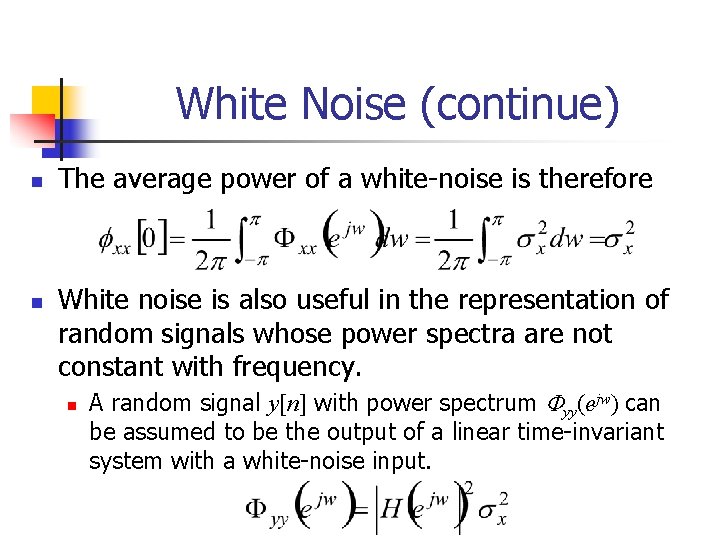
White Noise (continue) n n The average power of a white-noise is therefore White noise is also useful in the representation of random signals whose power spectra are not constant with frequency. n A random signal y[n] with power spectrum yy(ejw) can be assumed to be the output of a linear time-invariant system with a white-noise input.
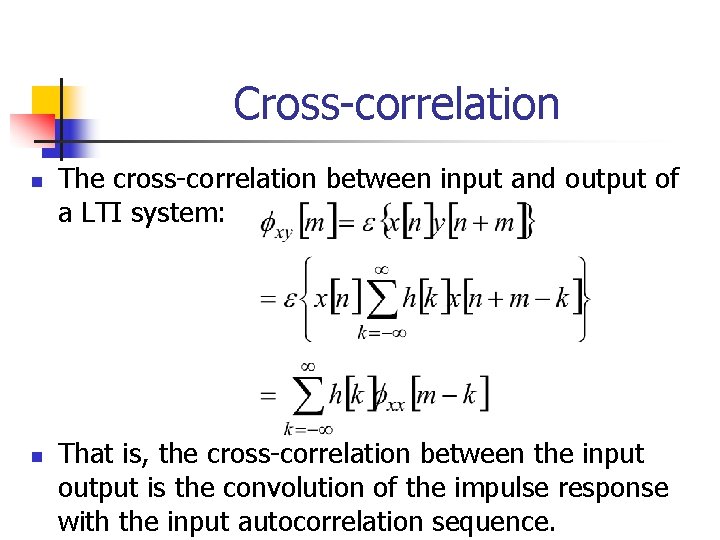
Cross-correlation n n The cross-correlation between input and output of a LTI system: That is, the cross-correlation between the input output is the convolution of the impulse response with the input autocorrelation sequence.
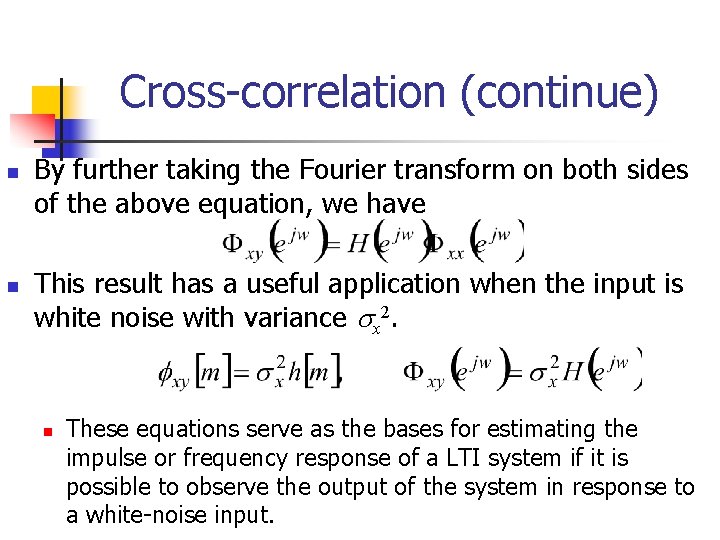
Cross-correlation (continue) n n By further taking the Fourier transform on both sides of the above equation, we have This result has a useful application when the input is white noise with variance x 2. n These equations serve as the bases for estimating the impulse or frequency response of a LTI system if it is possible to observe the output of the system in response to a white-noise input.
Remained Materials Not Included From Chap. 4, the materials will be taught in the class without using slides