
Directed Diffusion Chalermek Intanagonwiwat USCISI Ramesh Govindan USCISI
- Slides: 20
Directed Diffusion Chalermek Intanagonwiwat (USC/ISI) Ramesh Govindan (USC/ISI) Deborah Estrin (USC/ISI and UCLA) DARPA Sponsored SCADDS project http: //www. isi. edu/scadds 1
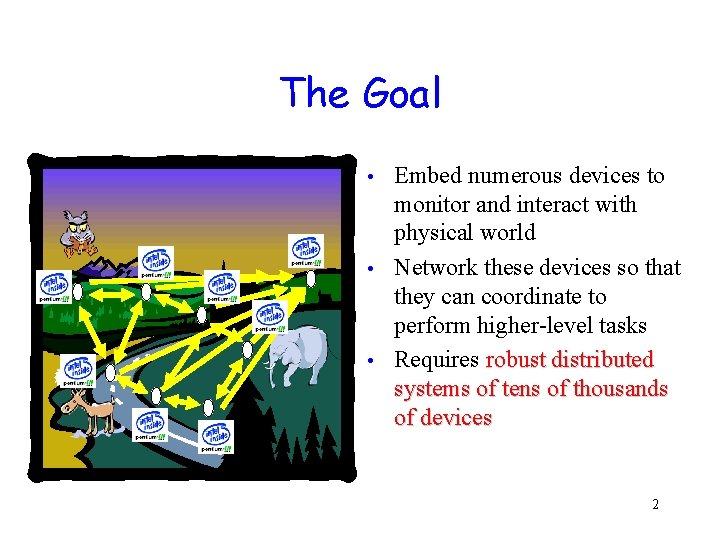
The Goal Embed numerous devices to monitor and interact with physical world • Network these devices so that they can coordinate to perform higher-level tasks • Requires robust distributed systems of tens of thousands of devices • 2
The Challenge: Dynamics! • The physical world is dynamic Dynamic operating conditions • Dynamic availability of resources • … particularly energy! • • Devices must adapt automatically to the environment Too many devices for manual configuration • Environmental conditions are unpredictable • • Unattended and un-tethered operation is key to many applications 3
Energy is the bottleneck resource • Communication VS Computation Cost [Pottie 2000] E α R 4 • 10 m: 5000 ops/transmitted bit • 100 m: 50, 000 ops/transmitted bit • Avoid communication over long distances • Cannot assume global knowledge, cannot preconfigure networks • Achieve desired global behavior through localized interactions • Empirically adapt to observed environment • • Can leverage data processing/aggregation inside the network 4
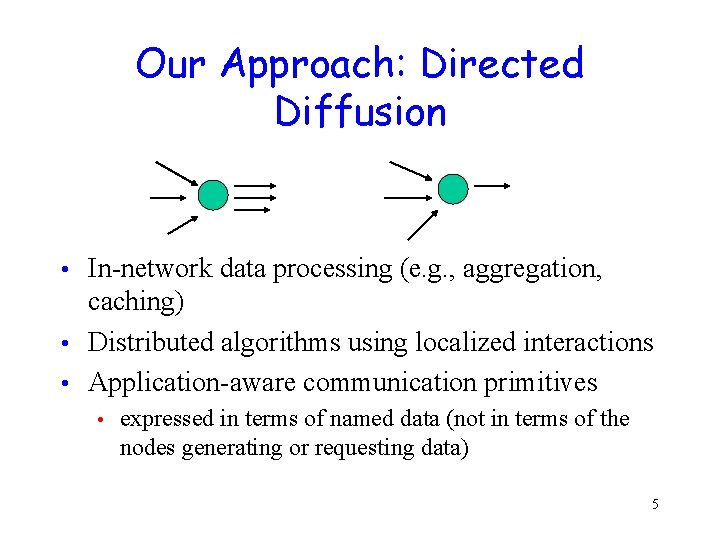
Our Approach: Directed Diffusion In-network data processing (e. g. , aggregation, caching) • Distributed algorithms using localized interactions • Application-aware communication primitives • • expressed in terms of named data (not in terms of the nodes generating or requesting data) 5
Application Example: Remote Surveillance • Interrogation: • e. g. , “Give me periodic reports about animal location in region A every t seconds” Interrogation is propagated to sensor nodes in region A • Sensor nodes in region A are tasked to collect data • Data are sent back to the users every t seconds • 6
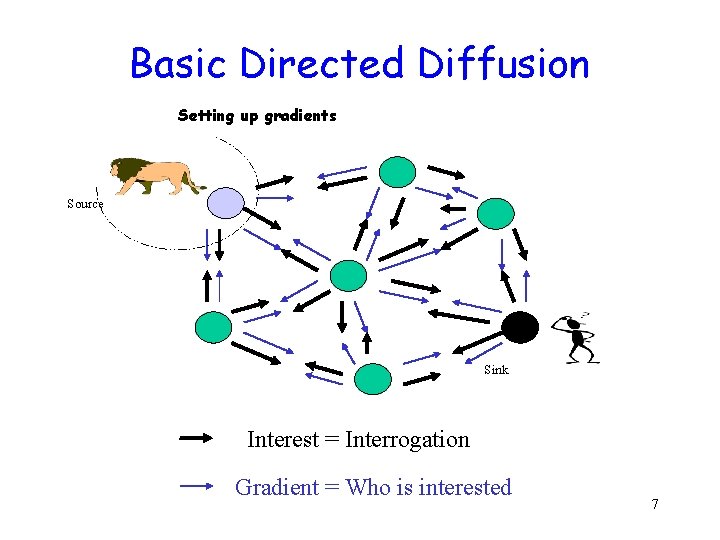
Basic Directed Diffusion Setting up gradients Source Sink Interest = Interrogation Gradient = Who is interested 7
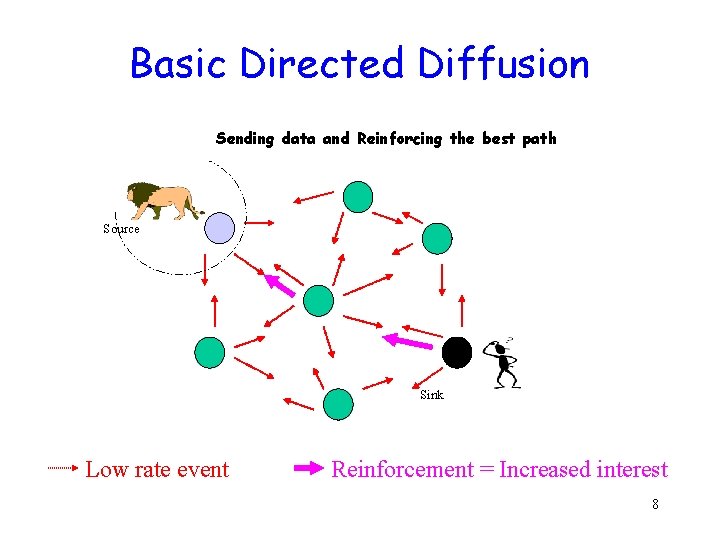
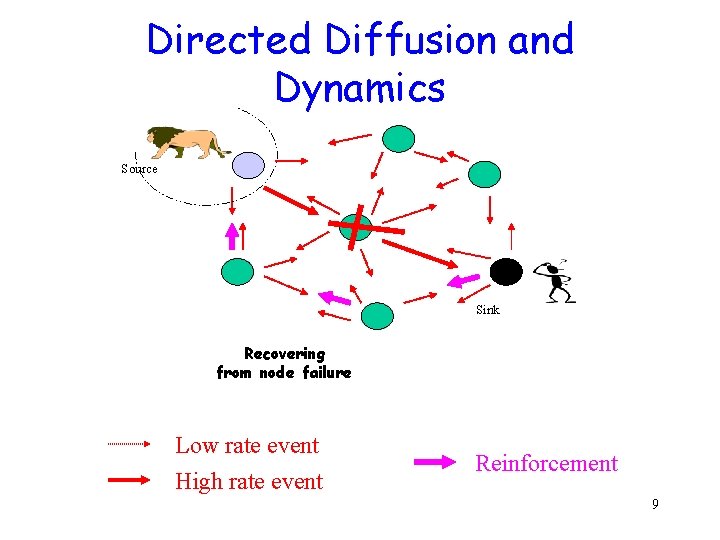
Basic Directed Diffusion Sending data and Reinforcing the best path Source Sink Low rate event Reinforcement = Increased interest 8
Directed Diffusion and Dynamics Source Sink Recovering from node failure Low rate event High rate event Reinforcement 9
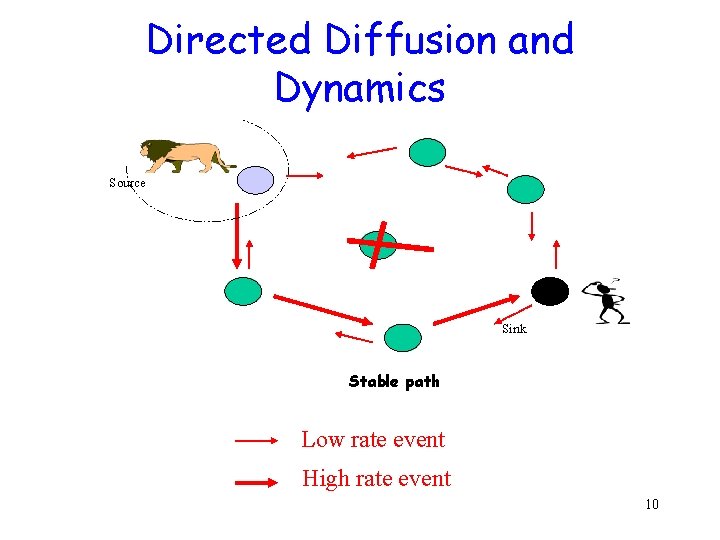
Directed Diffusion and Dynamics Source Sink Stable path Low rate event High rate event 10
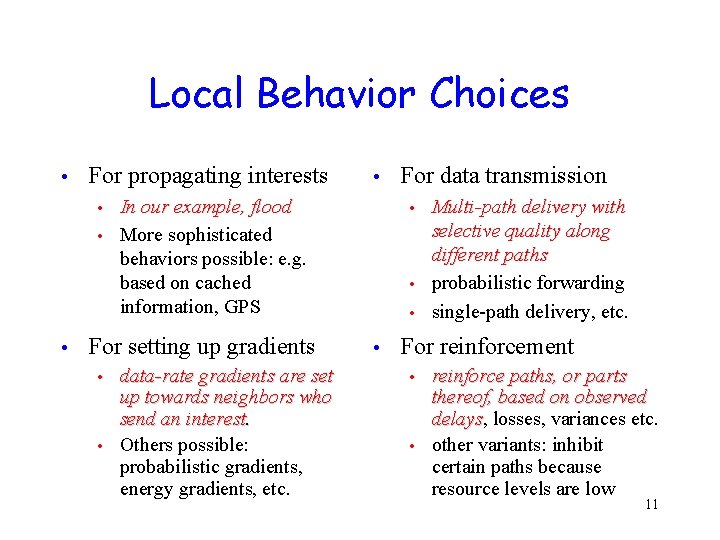
Local Behavior Choices • For propagating interests • In our example, flood • More sophisticated behaviors possible: e. g. based on cached information, GPS Multi-path delivery with selective quality along different paths • probabilistic forwarding • single-path delivery, etc. • • For setting up gradients data-rate gradients are set up towards neighbors who send an interest. • Others possible: probabilistic gradients, energy gradients, etc. • For data transmission • • For reinforcement reinforce paths, or parts thereof, based on observed delays, delays losses, variances etc. • other variants: inhibit certain paths because resource levels are low • 11
Initial simulation study of diffusion • Key metric • Average Dissipated Energy per event delivered • indicates energy efficiency and network lifetime • Compare diffusion to flooding • centrally computed tree (omniscient multicast) multicast • 12
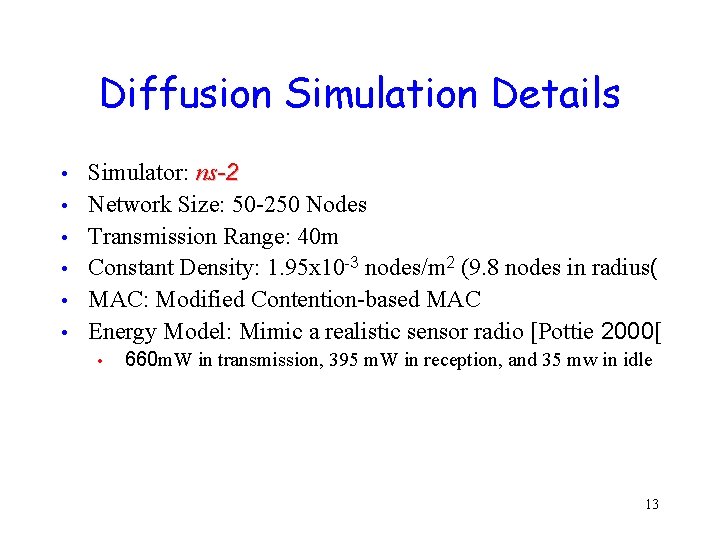
Diffusion Simulation Details • • • Simulator: ns-2 Network Size: 50 -250 Nodes Transmission Range: 40 m Constant Density: 1. 95 x 10 -3 nodes/m 2 (9. 8 nodes in radius( MAC: Modified Contention-based MAC Energy Model: Mimic a realistic sensor radio [Pottie 2000[ • 660 m. W in transmission, 395 m. W in reception, and 35 mw in idle 13
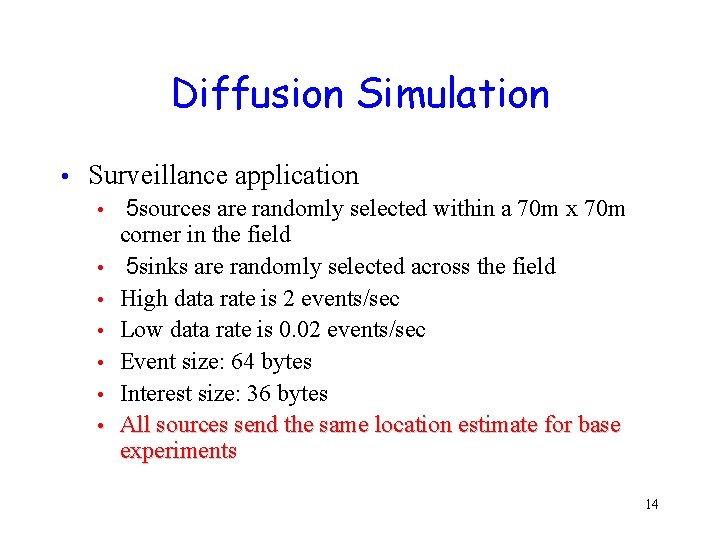
Diffusion Simulation • Surveillance application • • 5 sources are randomly selected within a 70 m x 70 m corner in the field 5 sinks are randomly selected across the field High data rate is 2 events/sec Low data rate is 0. 02 events/sec Event size: 64 bytes Interest size: 36 bytes All sources send the same location estimate for base experiments 14
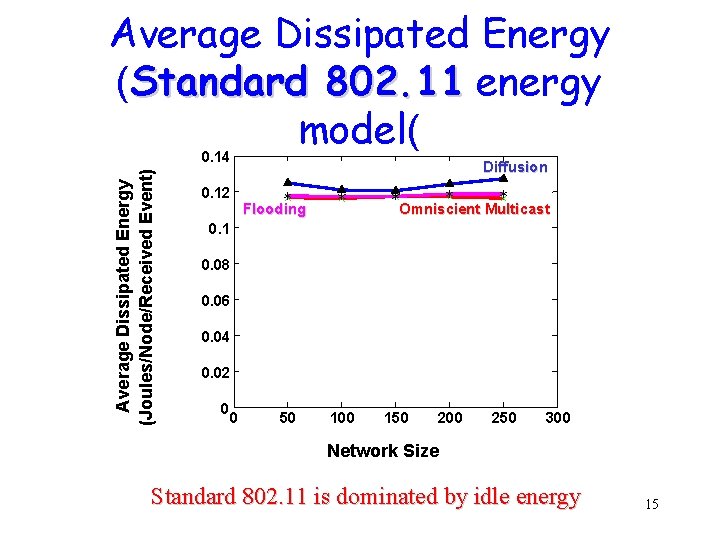
Average Dissipated Energy (Standard 802. 11 energy model( Average Dissipated Energy (Joules/Node/Received Event) 0. 14 0. 12 Diffusion Flooding Omniscient Multicast 0. 1 0. 08 0. 06 0. 04 0. 02 0 0 50 100 150 200 250 300 Network Size Standard 802. 11 is dominated by idle energy 15
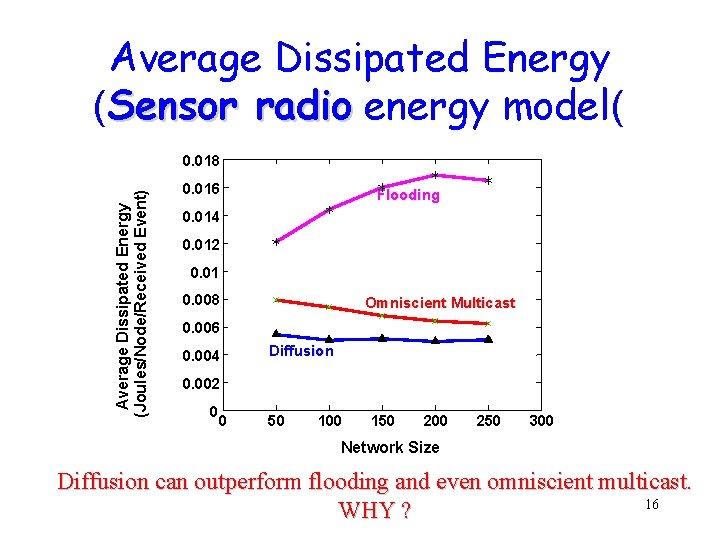
Average Dissipated Energy (Sensor radio energy model( Average Dissipated Energy (Joules/Node/Received Event) 0. 018 0. 016 Flooding 0. 014 0. 012 0. 01 0. 008 Omniscient Multicast 0. 006 0. 004 Diffusion 0. 002 0 0 50 100 150 200 250 300 Network Size Diffusion can outperform flooding and even omniscient multicast. 16 WHY ?
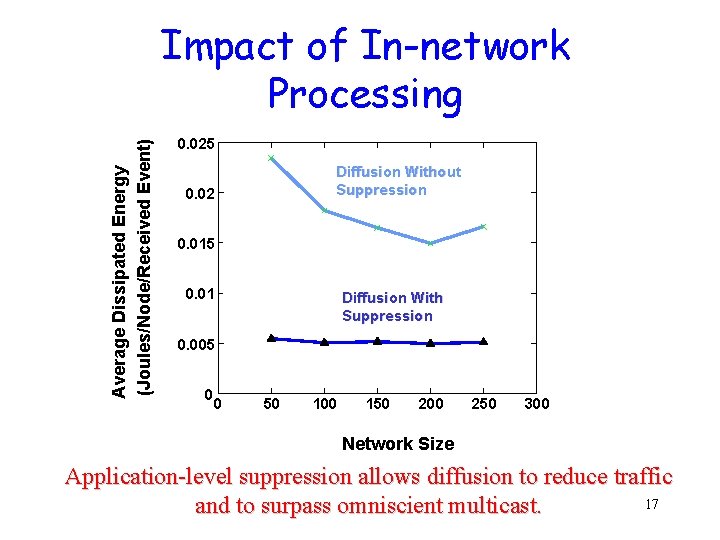
Average Dissipated Energy (Joules/Node/Received Event) Impact of In-network Processing 0. 025 Diffusion Without Suppression 0. 02 0. 015 0. 01 Diffusion With Suppression 0. 005 0 0 50 100 150 200 250 300 Network Size Application-level suppression allows diffusion to reduce traffic 17 and to surpass omniscient multicast.
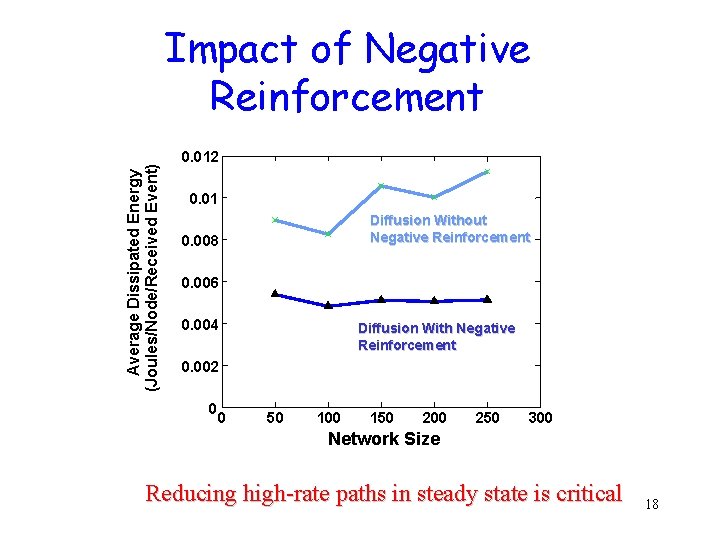
Average Dissipated Energy (Joules/Node/Received Event) Impact of Negative Reinforcement 0. 012 0. 01 Diffusion Without Negative Reinforcement 0. 008 0. 006 0. 004 Diffusion With Negative Reinforcement 0. 002 0 0 50 100 150 200 250 300 Network Size Reducing high-rate paths in steady state is critical 18
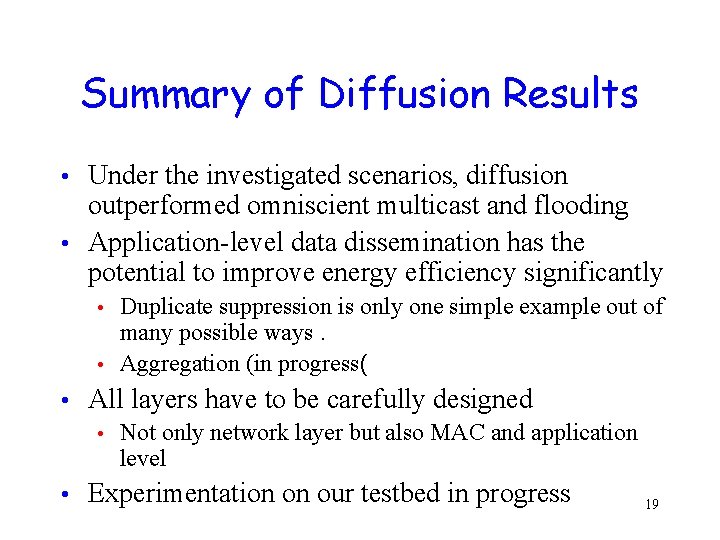
Summary of Diffusion Results Under the investigated scenarios, diffusion outperformed omniscient multicast and flooding • Application-level data dissemination has the potential to improve energy efficiency significantly • Duplicate suppression is only one simple example out of many possible ways. • Aggregation (in progress( • • All layers have to be carefully designed • • Not only network layer but also MAC and application level Experimentation on our testbed in progress 19
More information • SCADDS project • • ns-2: network simulator (with diffusion supports( • • http: //www. isi. edu/scadds http: //www. isi. edu/nsnam/dist/ns-src-snapshot. tar. gz Our testbed and software • http: //www. isi. edu/scadds/testbeds. html 20