
Directed Assistance Module DAM 8 Nitrification Action Plans

- Slides: 31
Directed Assistance Module (DAM) 8: Nitrification Action Plans (NAPs) Developed by the TCEQ Water Supply Division (WSD) Texas Optimization Program (TOP) Presented by the WSD Financial, Managerial, and Technical (FMT) Capacity Development Contractor v. 2 1
Outline of NAP DAM Presentation: Brief overview n Six workshops n 1. 2. 3. 4. 5. 6. Sample Sites Monitoring Frequency Methods Goals, baselines, and triggers Actions Communication strategies 2
Outline of Presentation Chloramination n Nitrification n 3
Chloramines 4
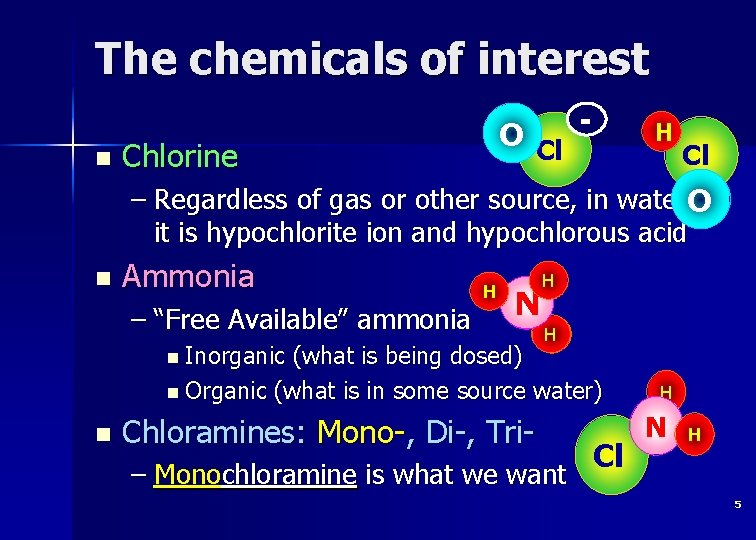
The chemicals of interest n O Cl Cl Chlorine - H Cl Cl – Regardless of gas or other source, in water. O it is hypochlorite ion and hypochlorous acid n Ammonia – “Free Available” ammonia H H N N n Inorganic H H (what is being dosed) n Organic (what is in some source water) n Chloramines: Mono-, Di-, Tri– Monochloramine is what we want Cl H N H 5
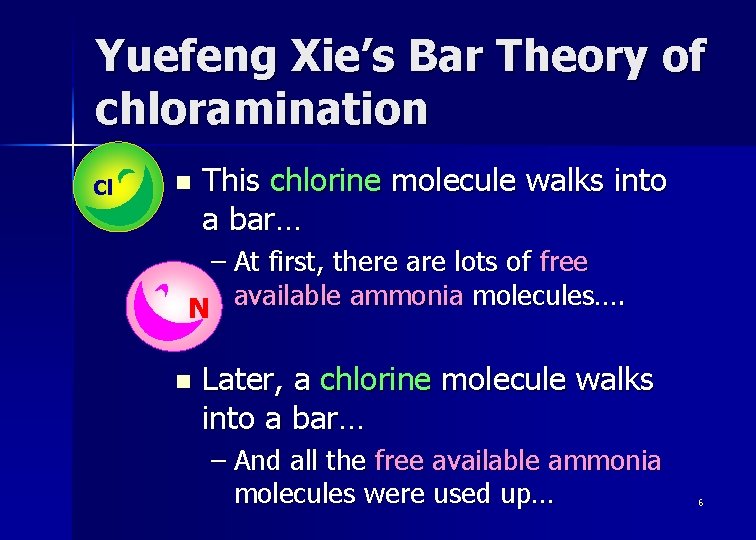
Yuefeng Xie’s Bar Theory of chloramination Cl n This chlorine molecule walks into a bar… – At first, there are lots of free N available ammonia molecules…. n Later, a chlorine molecule walks into a bar… – And all the free available ammonia molecules were used up… 6
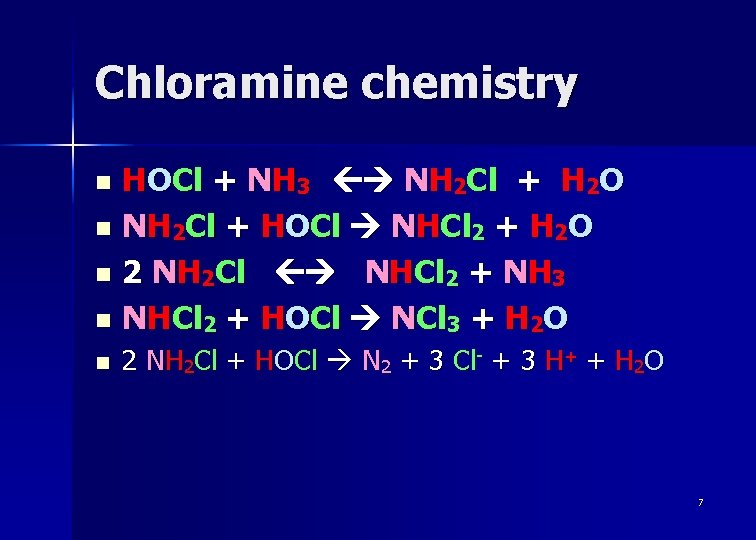
Chloramine chemistry HOCl + NH 3 NH 2 Cl + H 2 O n NH 2 Cl + HOCl NHCl 2 + H 2 O n 2 NH 2 Cl NHCl 2 + NH 3 n NHCl 2 + HOCl NCl 3 + H 2 O n n 2 NH 2 Cl + HOCl N 2 + 3 Cl- + 3 H+ + H 2 O 7
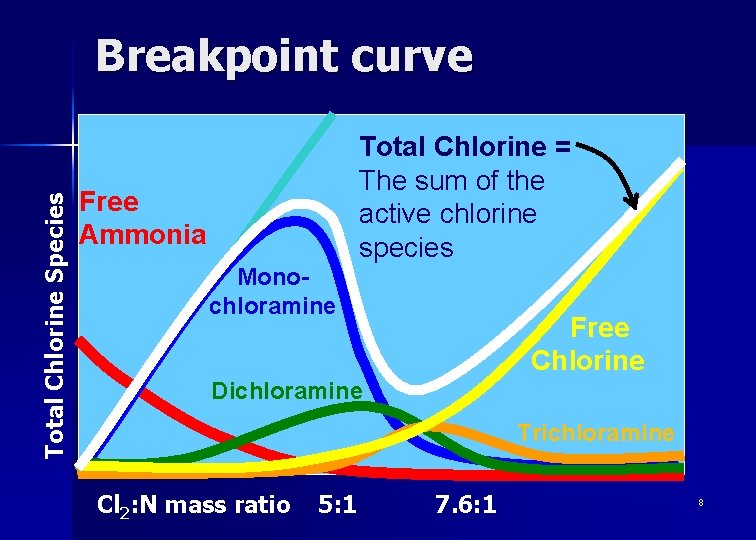
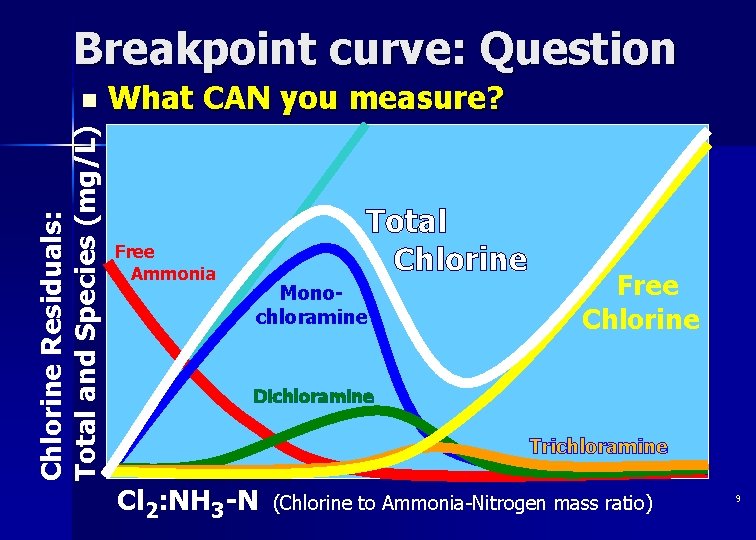
Total Chlorine Species Breakpoint curve Total Chlorine = The sum of the active chlorine species Free Ammonia Monochloramine Free Chlorine Dichloramine Trichloramine Cl 2: N mass ratio 5: 1 7. 6: 1 8
Breakpoint curve: Question Chlorine Residuals: Total and Species (mg/L) n What CAN you measure? – Using normal equipment Free Ammonia Total Chlorine Monochloramine Free Chlorine Dichloramine Trichloramine Cl 2: NH 3 -N (Chlorine to Ammonia-Nitrogen mass ratio) 9
Nitrification 10
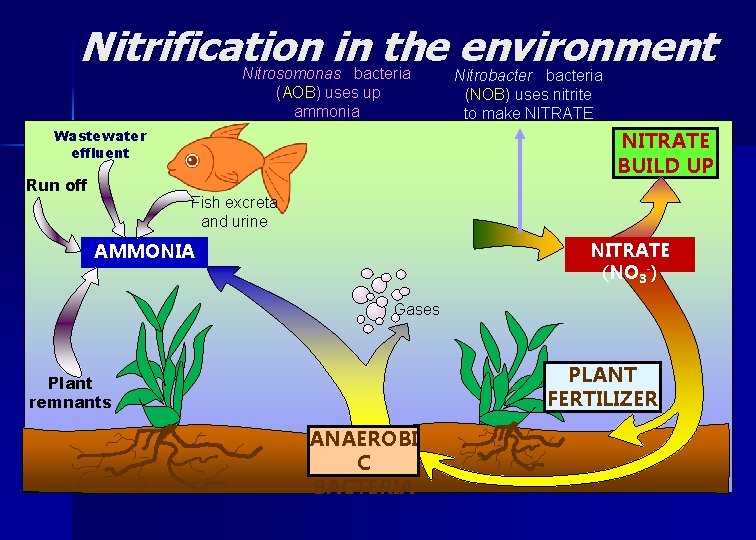
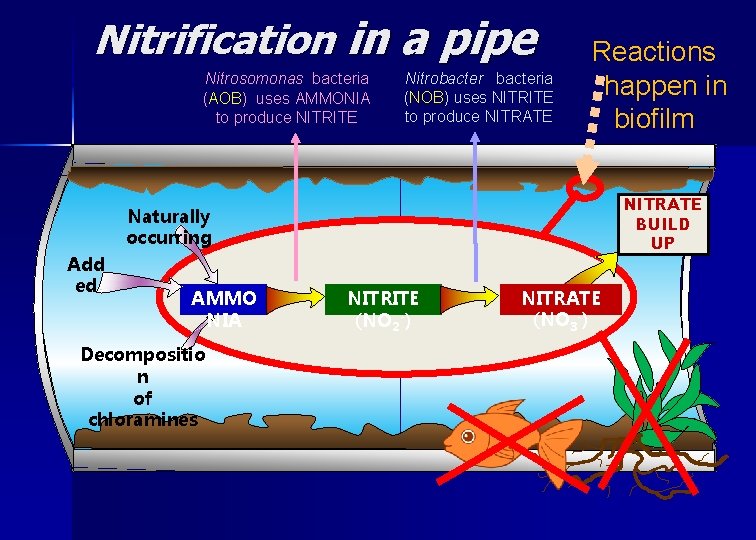
Nitrification n Nitrification happens when bacteria called nitrifiers ‘eat’ ammonia, then nitrite, to form nitrite, then nitrate. n Nitrification causes loss of residual chloramines. 11
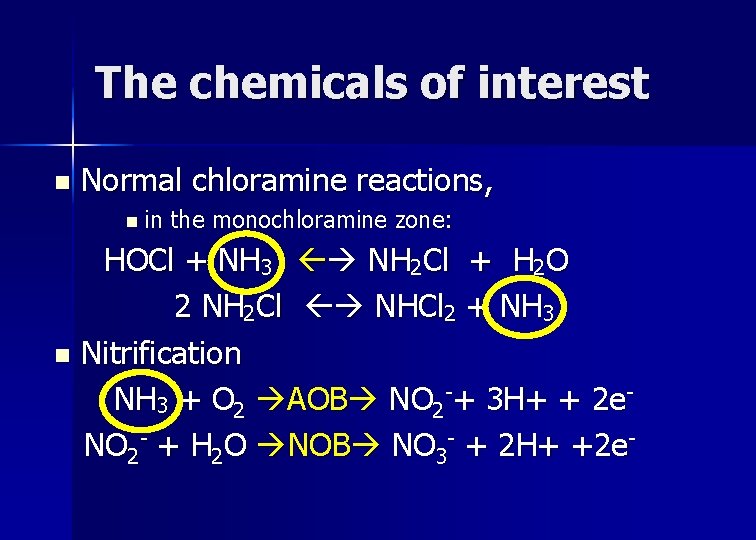
The chemicals of interest n Normal chloramine reactions, n in the monochloramine zone: HOCl + NH 3 NH 2 Cl + H 2 O 2 NH 2 Cl NHCl 2 + NH 3 n Nitrification NH 3 + O 2 AOB NO 2 -+ 3 H+ + 2 e. NO 2 - + H 2 O NOB NO 3 - + 2 H+ +2 e-
Nitrification in the environment Nitrosomonas bacteria (AOB) uses up ammonia and makes NITRITE Wastewater effluent Run off Fish excreta and urine AMMONIA NITRITE (NO 2 -) Nitrobacteria (NOB) uses nitrite to make NITRATE BUILD UP NITRATE (NO 3 -) Gases PLANT FERTILIZER Plant remnants ANAEROBI C BACTERIA
Nitrification in a pipe Nitrosomonas bacteria (AOB) uses AMMONIA to produce NITRITE Nitrobacteria (NOB) uses NITRITE to produce NITRATE Reactions happen in biofilm NITRATE BUILD UP Naturally occurring Add ed AMMO NIA Decompositio n of chloramines NITRITE (NO 2 -) NITRATE (NO 3 -)
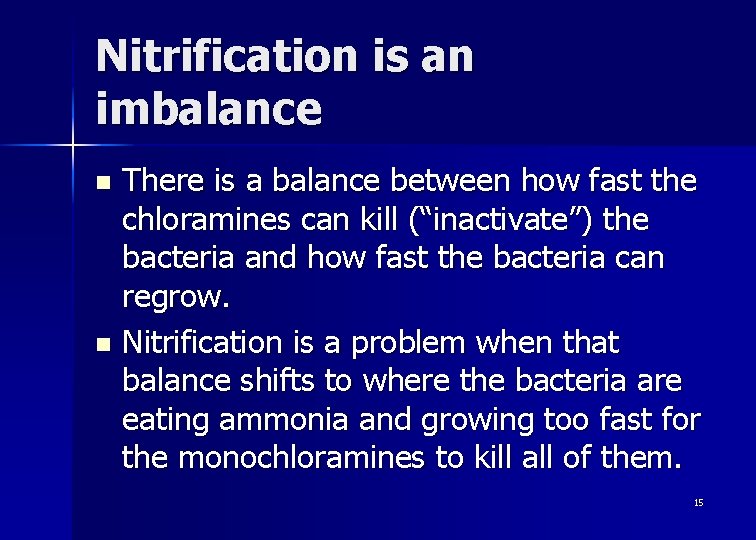
Nitrification is an imbalance There is a balance between how fast the chloramines can kill (“inactivate”) the bacteria and how fast the bacteria can regrow. n Nitrification is a problem when that balance shifts to where the bacteria are eating ammonia and growing too fast for the monochloramines to kill all of them. n 15
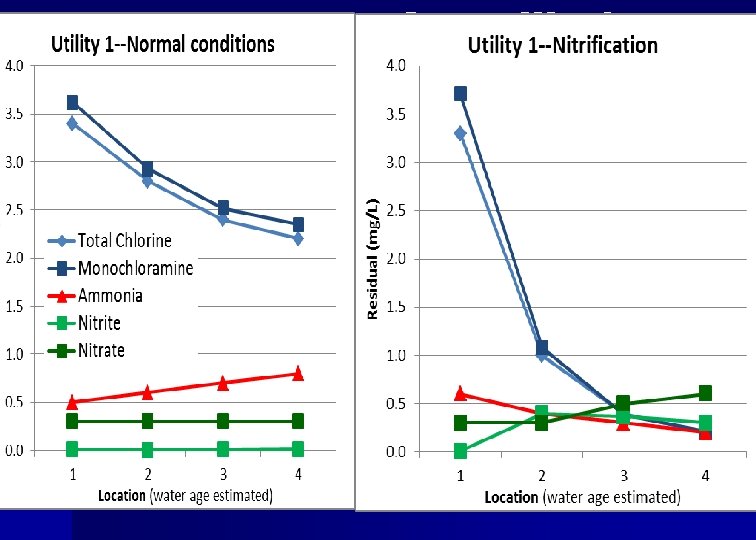
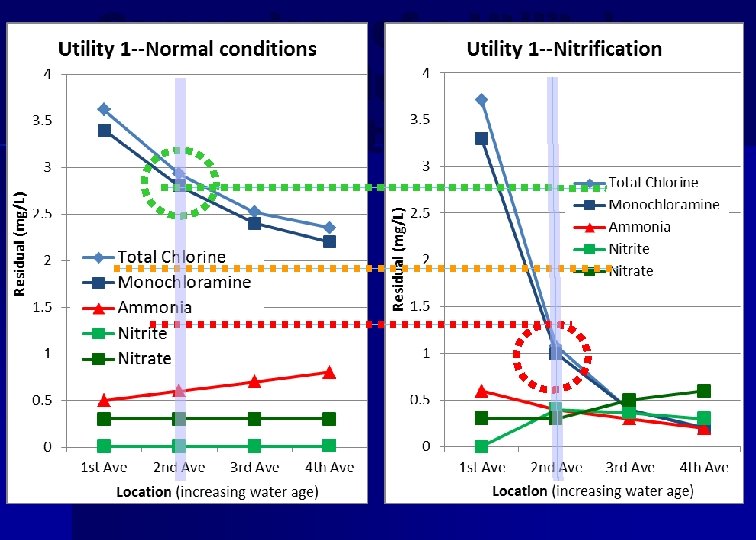
Comparison of a Utility's operations during normal and nitrification events.
NAP Workshops 17
A Nitrification Action Plan is like a Monitoring Plan n It includes 1. 2. 3. 4. 5. 6. A sample site map, Sample schedules, Analytical methods, Site-specific goals, baselines, and trigger levels, Actions, and Communication strategies.
DAM Workshops n This DAM includes a workshop for each element of the DAM. – As you go through each workshop, note follow-up actions that you will need to complete later. 19
Workshop 1. NAP sites n NAP sample sites: – Represent sources, entry points, average and high water age in all pressure planes. – Can be the same as coliform sites n But they don’t have to be. – Critical control points n “A point where control can be applied and is essential to prevent or eliminate nitrification” – EG: Before booster chloramination
Workshop 2. Monitoring frequency n NAP monitoring must be done weekly, – May be done more frequently. n Small systems, <750 people or 250 cnx. – Monitor monochloramine and ammonia with every weekly total chlorine sample. n Large systems, select sites at low, average and high water age for weekly sampling.
3 a. Sample collection method n Water representing the main – Not stagnant water in the sample line n Use the calculated flush time (CFT) – Based on volume and flow – Flush just two (2) pipe-volumes – Don’t overflush n Consider building a hydrant and tap sampler
3 b. Analytical methods n Total chlorine: – Use EPA approved method n Monochloramine, ammonia, nitrite, nitrate – EPA does not have approved methods. – Achieve the required accuracy n Document on the List of Analytical Methods (LAM) – Attach to Monitoring Plan
4. Goals/baselines and trigger levels n Nitrification is controlled by defining what “normal” is and looking for trends that are “abnormal. ” – Therefore, initial data must be analyzed to define normal levels, – And additional data must be analyzed or hypothetical levels must be projected for levels that are a concern: trigger levels.
Comparison of a Utility's operations during normal and nitrification events.
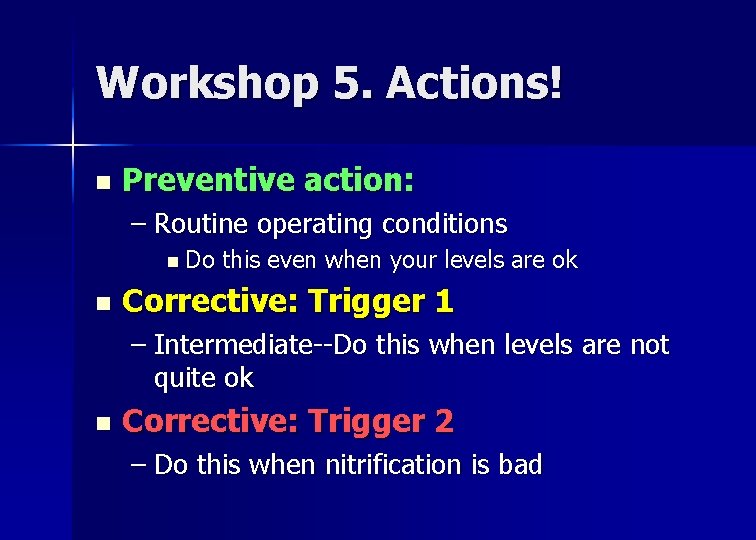
Workshop 5. Actions! n Preventive action: – Routine operating conditions n Do n this even when your levels are ok Corrective: Trigger 1 – Intermediate--Do this when levels are not quite ok n Corrective: Trigger 2 – Do this when nitrification is bad
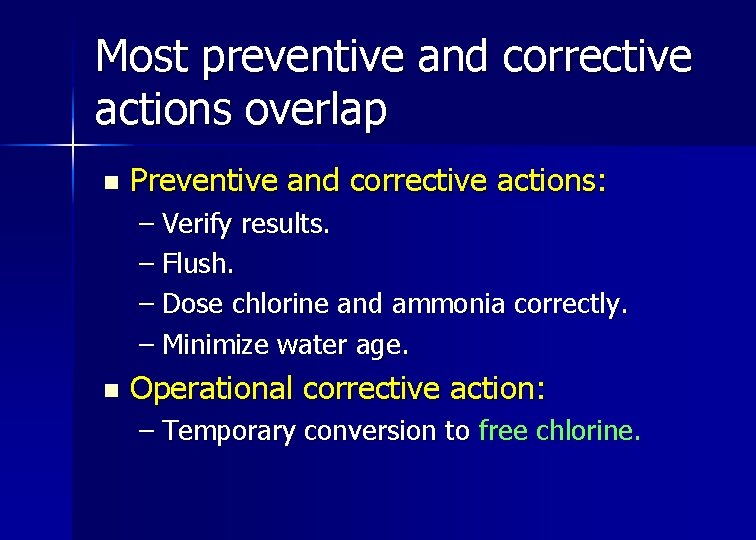
Most preventive and corrective actions overlap n Preventive and corrective actions: – Verify results. – Flush. – Dose chlorine and ammonia correctly. – Minimize water age. n Operational corrective action: – Temporary conversion to free chlorine.
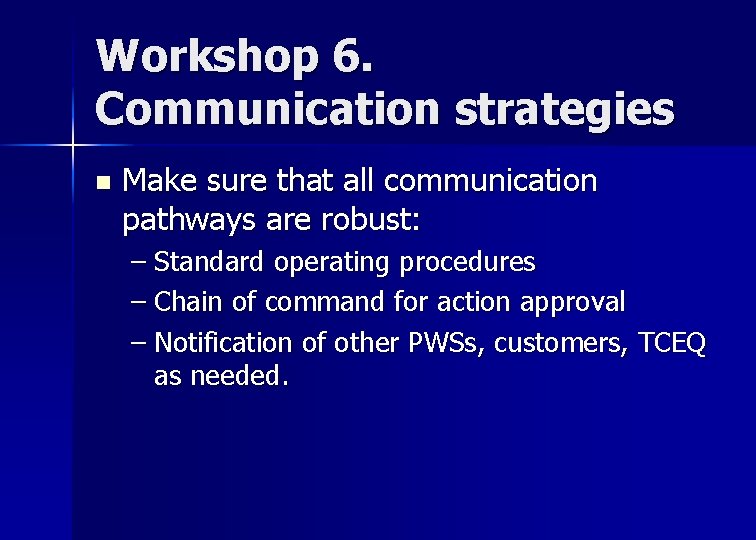
Workshop 6. Communication strategies n Make sure that all communication pathways are robust: – Standard operating procedures – Chain of command for action approval – Notification of other PWSs, customers, TCEQ as needed.
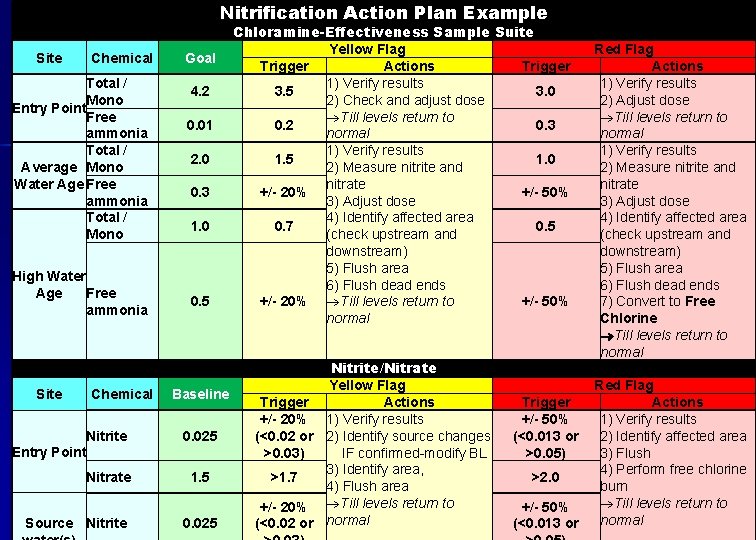
Nitrification Action Plan Example Site Example: Nitrification Action Plan Chemical Total / Mono Entry Point Free ammonia Total / Average Mono Water Age Free ammonia Total / Mono High Water Age Free ammonia Site Chemical Nitrite Entry Point Nitrate Source Nitrite Goal 4. 2 0. 01 2. 0 0. 3 1. 0 0. 5 Baseline 0. 025 1. 5 0. 025 Chloramine-Effectiveness Sample Suite Yellow Flag Trigger Actions Trigger 1) Verify results 3. 5 3. 0 2) Check and adjust dose ®Till levels return to 0. 2 0. 3 normal 1) Verify results 1. 5 1. 0 2) Measure nitrite and nitrate +/- 20% +/- 50% 3) Adjust dose 4) Identify affected area 0. 7 0. 5 (check upstream and downstream) 5) Flush area 6) Flush dead ends +/- 20% ®Till levels return to +/- 50% normal Nitrite/Nitrate Yellow Flag Trigger Actions +/- 20% 1) Verify results (<0. 02 or 2) Identify source changes >0. 03) IF confirmed-modify BL 3) Identify area, >1. 7 4) Flush area +/- 20% ®Till levels return to (<0. 02 or normal Trigger +/- 50% (<0. 013 or >0. 05) >2. 0 +/- 50% (<0. 013 or Red Flag Actions 1) Verify results 2) Adjust dose ®Till levels return to normal 1) Verify results 2) Measure nitrite and nitrate 3) Adjust dose 4) Identify affected area (check upstream and downstream) 5) Flush area 6) Flush dead ends 7) Convert to Free Chlorine ®Till levels return to normal Red Flag Actions 1) Verify results 2) Identify affected area 3) Flush 4) Perform free chlorine burn ®Till levels return to normal
Take-home Message
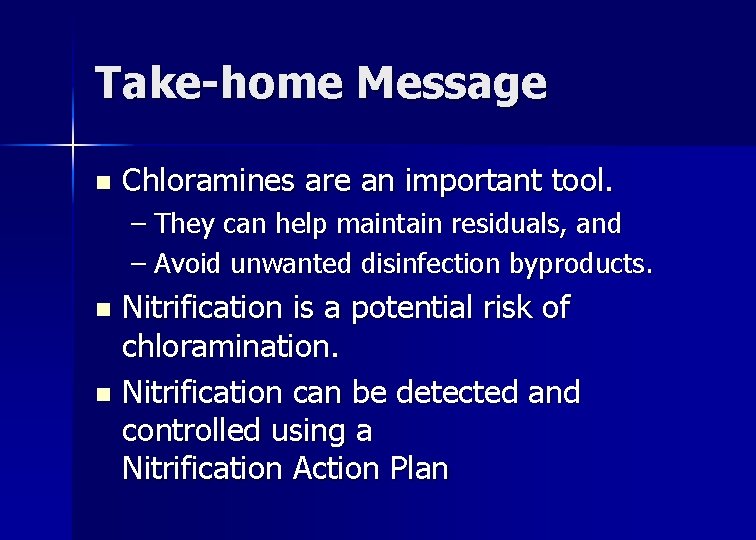
Take-home Message n Chloramines are an important tool. – They can help maintain residuals, and – Avoid unwanted disinfection byproducts. Nitrification is a potential risk of chloramination. n Nitrification can be detected and controlled using a Nitrification Action Plan n