
Direct Segment Optimization Optimizing conformal plans without IMRT





- Slides: 33
Direct Segment Optimization Optimizing conformal plans without IMRT Jennifer M. Steers 1, 2 , Martha M. Matuszak 1, 2 , Benedick A. Fraass 1 Departments of Radiation Oncology 1 and Nuclear Engineering & Radiological Sciences 2 University of Michigan, Ann Arbor, Michigan
Outline • Introduction – What is DSO? – Why are in we interested in DSO? – Goal • Methods and Materials • Results – IMRT vs. DSO comparisons • Conclusions
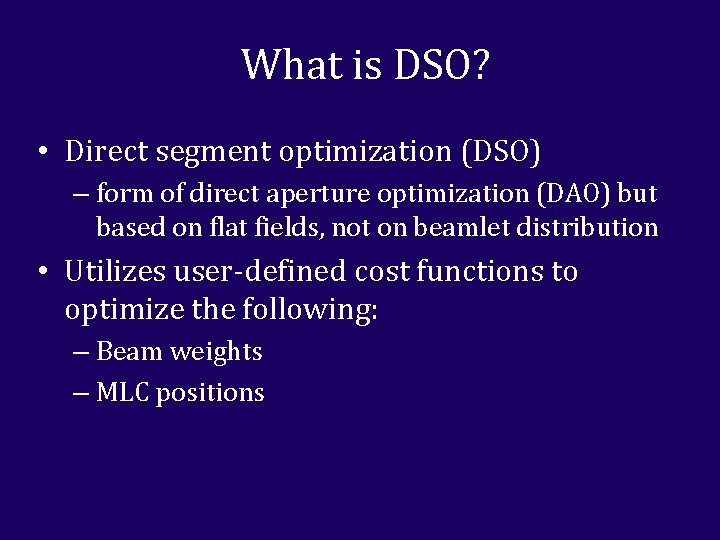
What is DSO? • Direct segment optimization (DSO) – form of direct aperture optimization (DAO) but based on flat fields, not on beamlet distribution • Utilizes user-defined cost functions to optimize the following: – Beam weights – MLC positions
What is DSO?
Why are we interested in DSO? • Plans are optimized conformal plans – Can reduce delivery time over IMRT – Can result in fewer MUs when compared to IMRT • Plans do not require IMRT QA - plans could be started or adapted much quicker • It may make tweaking and optimizing leaf positions in conformal plans, such as SBRT, much quicker
Goal • Can DSO produce simpler plans comparable in quality to IMRT plans with the same beam angles and cost function?
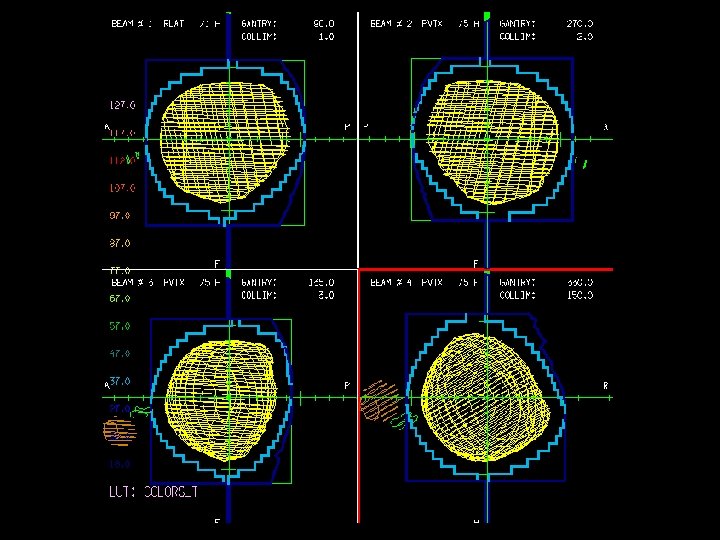
Methods and Materials: Features of DSO • MLCs and beam weights can be optimized separately or together • Search strategy options – Ordered and random searches – Step sizes • DSO offers fewer degrees of freedom per beam when compared to IMRT – User must create segments in a plan before optimizing
IMRT vs. DSO Setup • Planning goal: Minimize dose to OARs and normal tissues without compromising target uniformity • Same gantry angles were used between the IMRT and DSO plans except when needed segments were added to the DSO case • The same cost function was used to optimize both the IMRT and DSO plans
Evaluation of Comparisons • Both plans were optimized and evaluated with the following metrics – DVHs – MU/fx and beam-on time/fx – Mean doses to structures – Max structure doses (to 0. 5 cc or 0. 1 cc) – D 95 (for PTVs) – 3 D dose comparisons
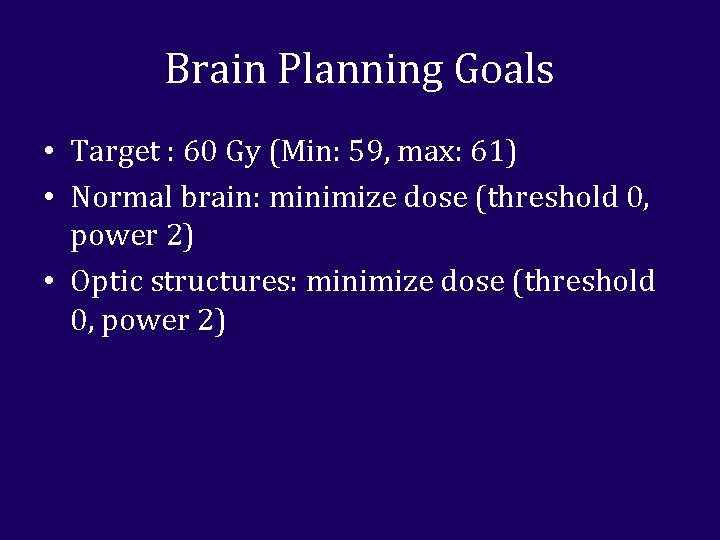
Brain Planning Goals • Target : 60 Gy (Min: 59, max: 61) • Normal brain: minimize dose (threshold 0, power 2) • Optic structures: minimize dose (threshold 0, power 2)
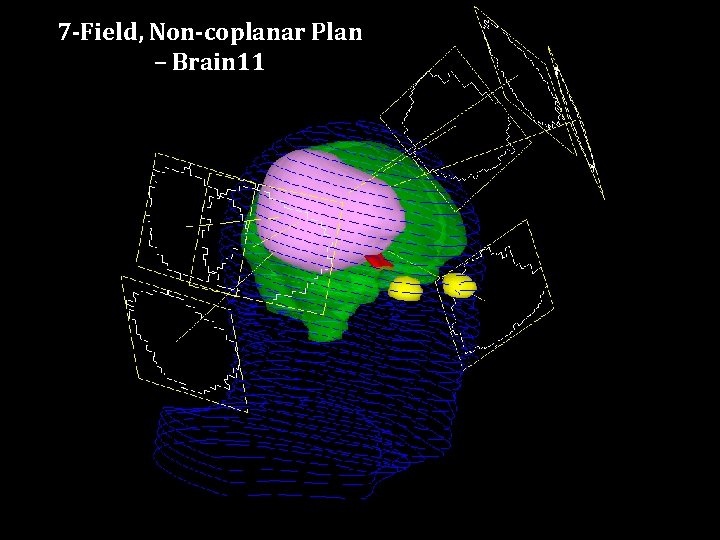
7 -Field, Non-coplanar Plan – Brain 11
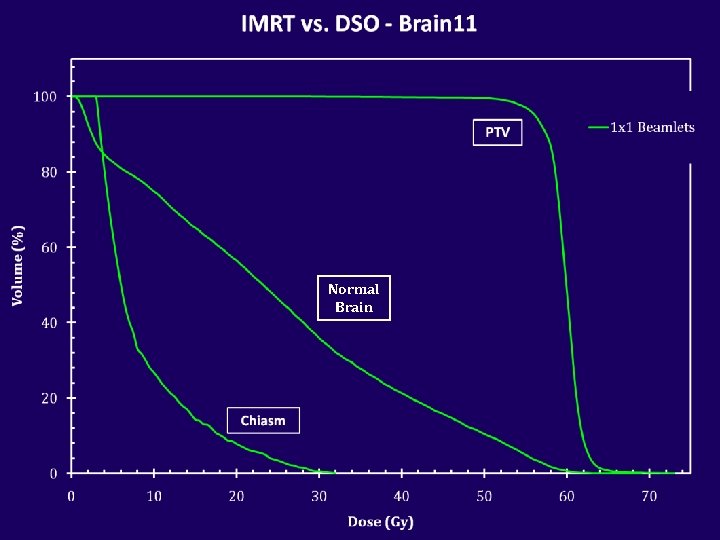
Normal Brain
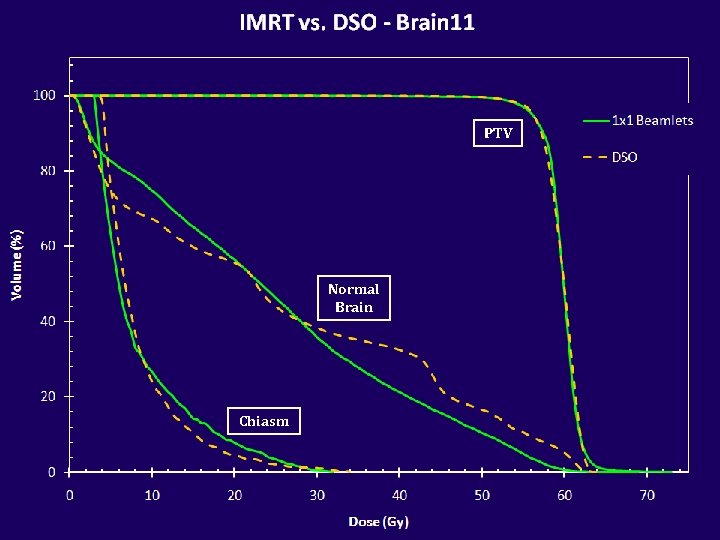
PTV Normal Brain Chiasm
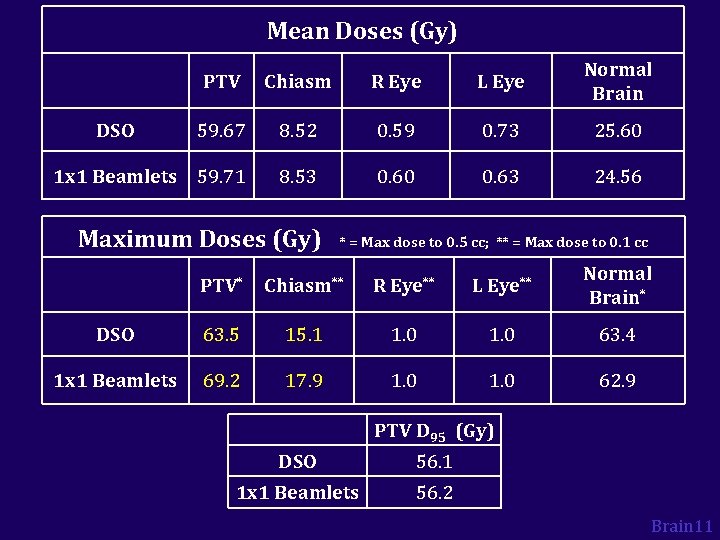
Mean Doses (Gy) PTV Chiasm R Eye L Eye Normal Brain 59. 67 8. 52 0. 59 0. 73 25. 60 1 x 1 Beamlets 59. 71 8. 53 0. 60 0. 63 24. 56 DSO Maximum Doses (Gy) * = Max dose to 0. 5 cc; ** = Max dose to 0. 1 cc PTV* Chiasm** R Eye** L Eye** Normal Brain* DSO 63. 5 15. 1 1. 0 63. 4 1 x 1 Beamlets 69. 2 17. 9 1. 0 62. 9 PTV D 95 (Gy) DSO 56. 1 1 x 1 Beamlets 56. 2 Brain 11
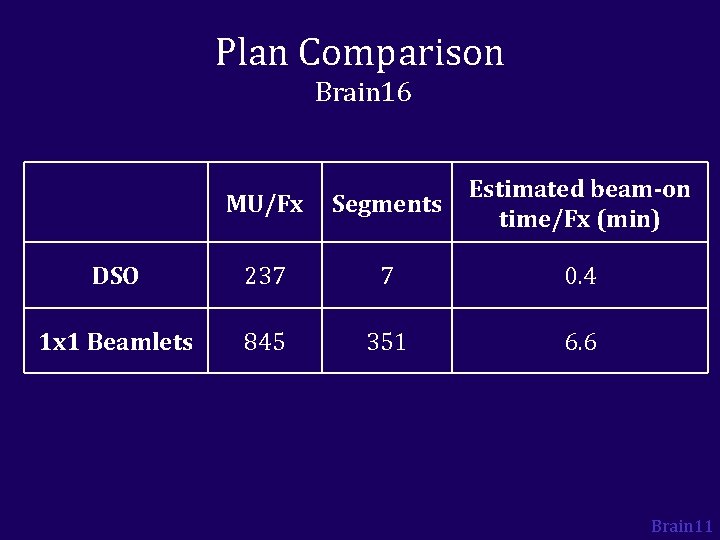
Plan Comparison Brain 16 MU/Fx Segments Estimated beam-on time/Fx (min) DSO 237 7 0. 4 1 x 1 Beamlets 845 351 6. 6 Brain 11
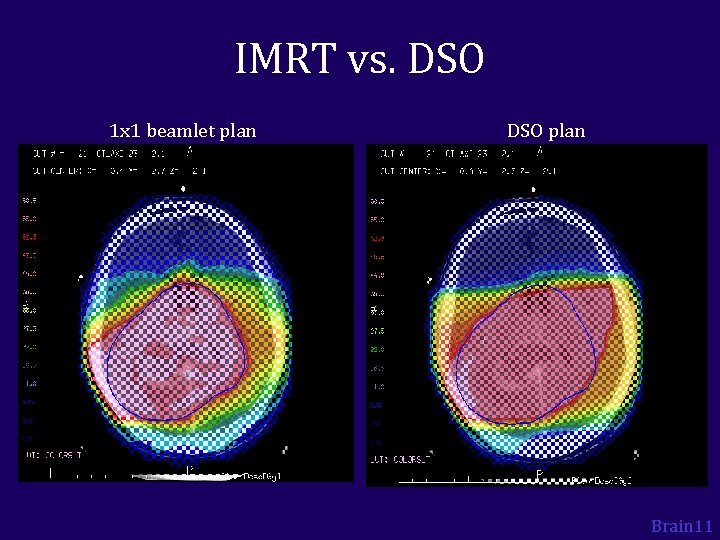
IMRT vs. DSO 1 x 1 beamlet plan DSO plan Brain 11
IMRT vs. DSO 1 x 1 beamlet plan DSO plan Brain 11
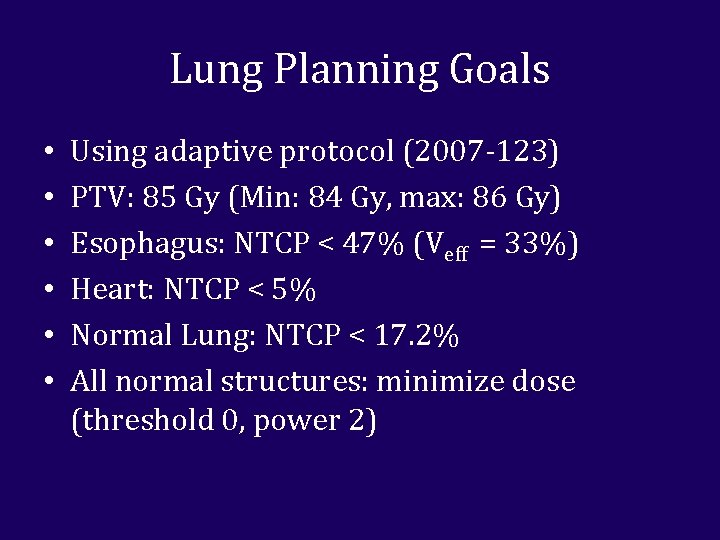
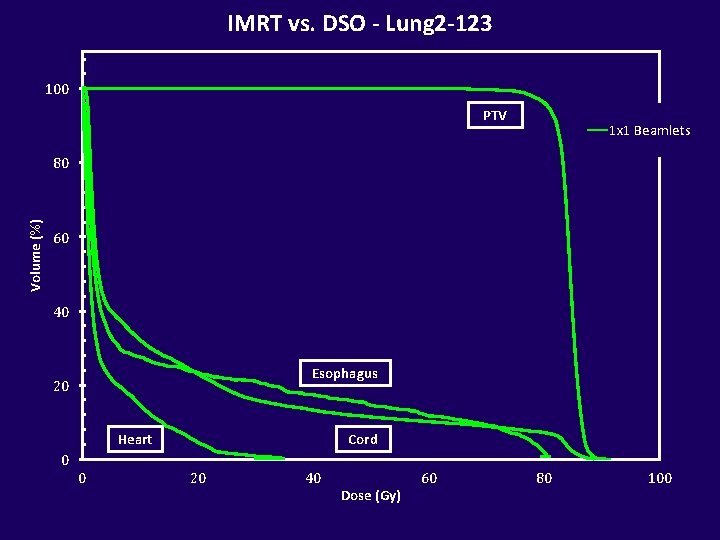
Lung Planning Goals • • • Using adaptive protocol (2007 -123) PTV: 85 Gy (Min: 84 Gy, max: 86 Gy) Esophagus: NTCP < 47% (Veff = 33%) Heart: NTCP < 5% Normal Lung: NTCP < 17. 2% All normal structures: minimize dose (threshold 0, power 2)
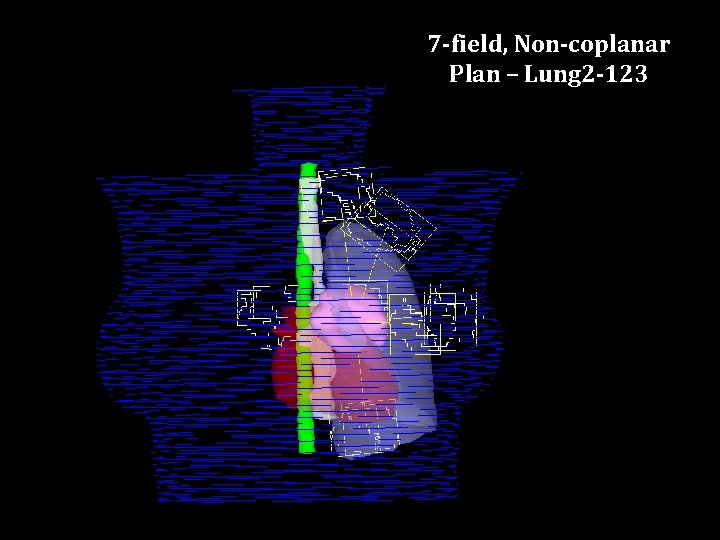
7 -field, Non-coplanar Plan – Lung 2 -123
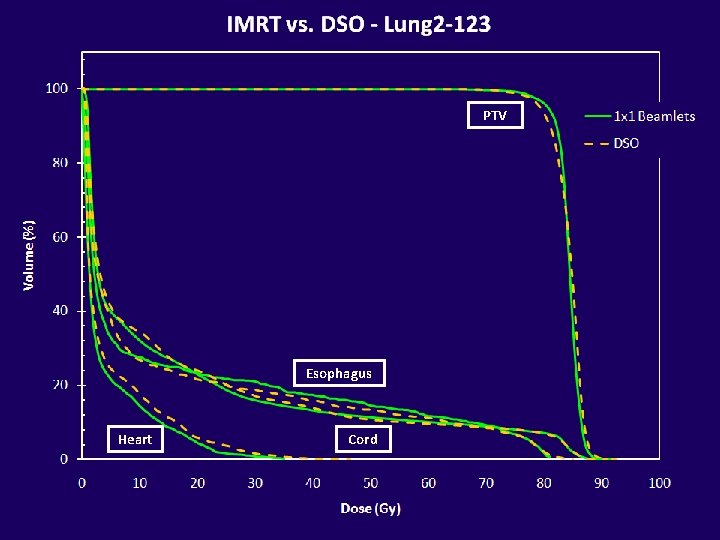
IMRT vs. DSO - Lung 2 -123 100 PTV 1 x 1 Beamlets Volume (%) 80 60 40 Esophagus 20 Heart Cord 0 0 20 40 Dose (Gy) 60 80 100
PTV Esophagus Heart Cord
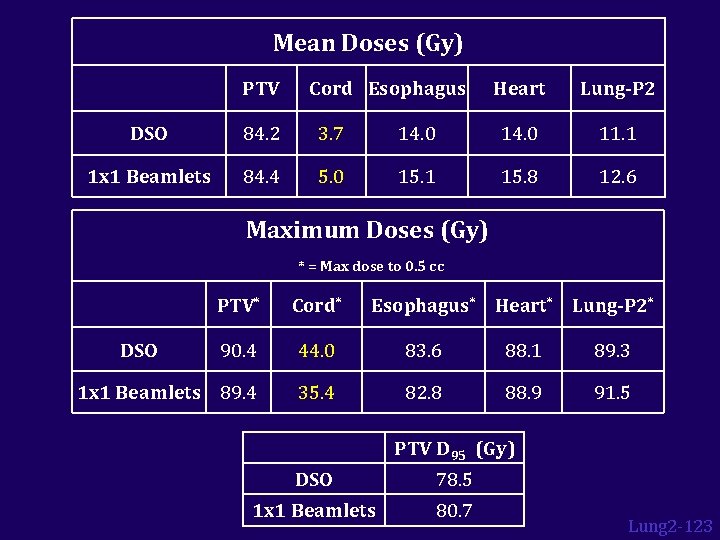
Mean Doses (Gy) PTV Cord Esophagus Heart Lung-P 2 DSO 84. 2 3. 7 14. 0 11. 1 1 x 1 Beamlets 84. 4 5. 0 15. 1 15. 8 12. 6 Maximum Doses (Gy) * = Max dose to 0. 5 cc PTV* Cord* 90. 4 44. 0 83. 6 88. 1 89. 3 1 x 1 Beamlets 89. 4 35. 4 82. 8 88. 9 91. 5 DSO Esophagus* Heart* Lung-P 2* PTV D 95 (Gy) DSO 78. 5 1 x 1 Beamlets 80. 7 Lung 2 -123
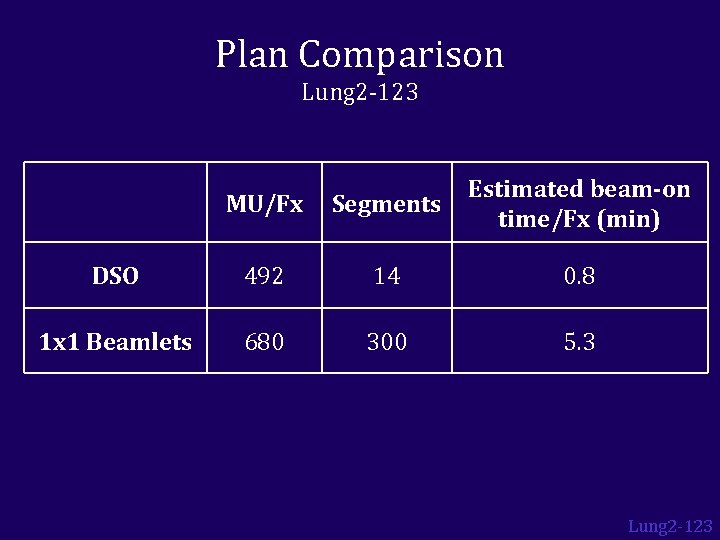
Plan Comparison Lung 2 -123 MU/Fx Segments Estimated beam-on time/Fx (min) DSO 492 14 0. 8 1 x 1 Beamlets 680 300 5. 3 Lung 2 -123
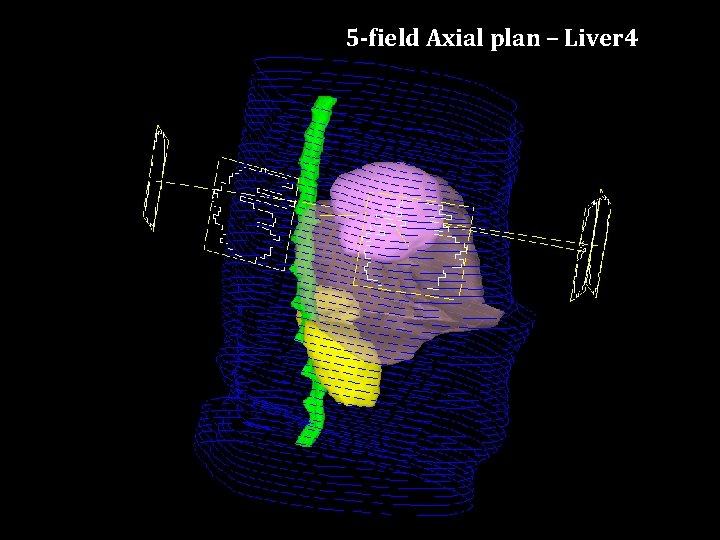
5 -field Axial plan – Liver 4
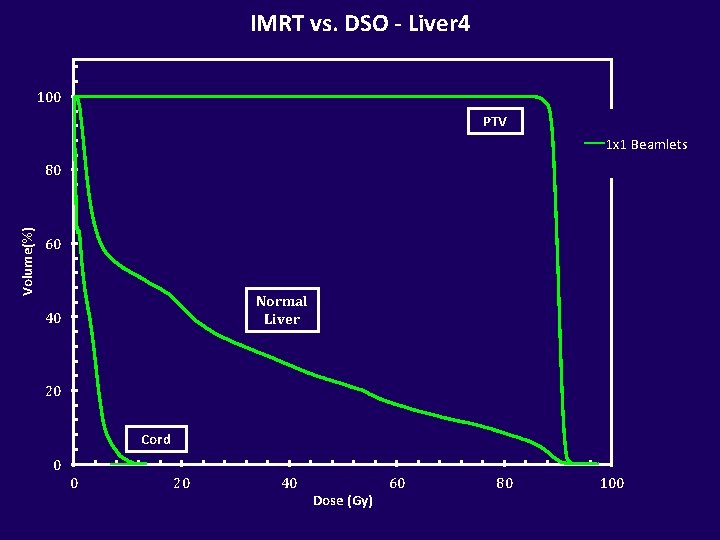
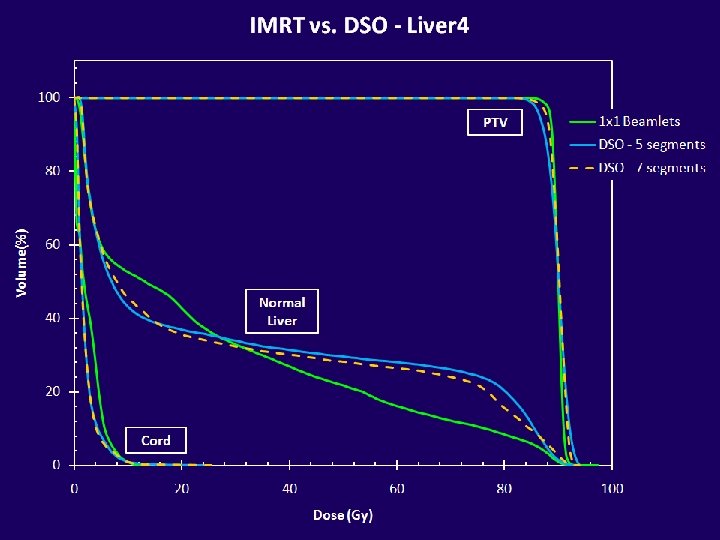
IMRT vs. DSO - Liver 4 100 PTV 1 x 1 Beamlets Volume(%) 80 60 Normal Liver 40 20 Cord 0 0 20 40 Dose (Gy) 60 80 100
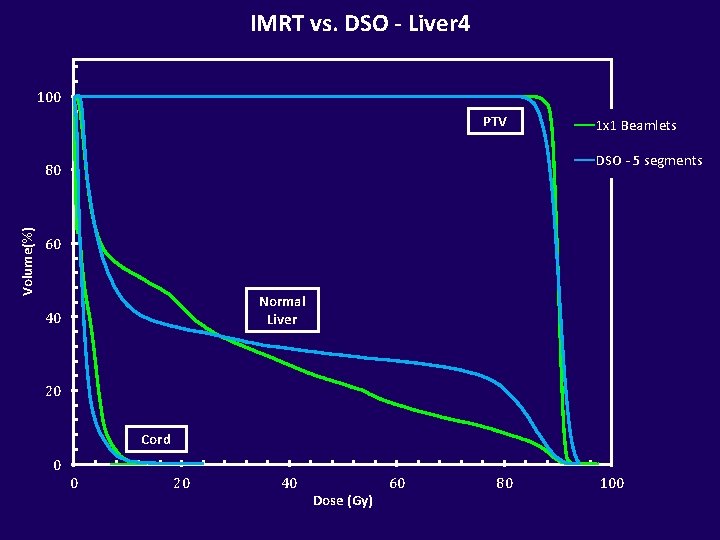
IMRT vs. DSO - Liver 4 100 PTV DSO - 5 segments 80 Volume(%) 1 x 1 Beamlets 60 Normal Liver 40 20 Cord 0 0 20 40 Dose (Gy) 60 80 100
PTV Normal Liver Cord
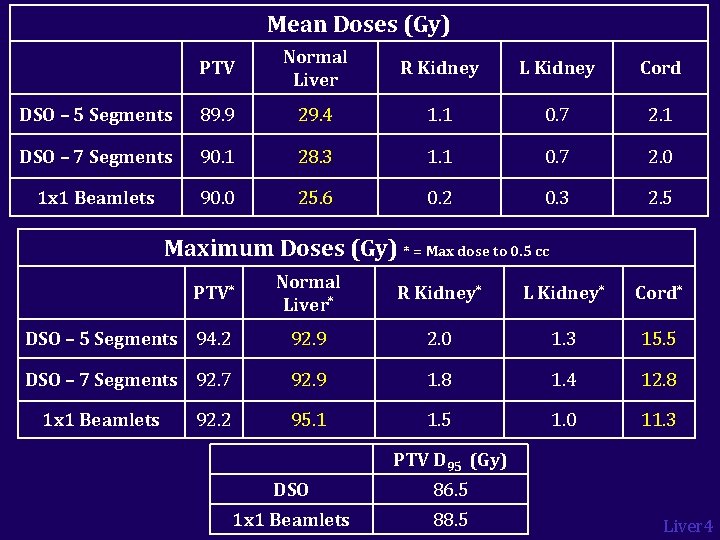
Mean Doses (Gy) PTV Normal Liver R Kidney L Kidney Cord DSO – 5 Segments 89. 9 29. 4 1. 1 0. 7 2. 1 DSO – 7 Segments 90. 1 28. 3 1. 1 0. 7 2. 0 1 x 1 Beamlets 90. 0 25. 6 0. 2 0. 3 2. 5 Maximum Doses (Gy) * = Max dose to 0. 5 cc Normal Liver* R Kidney* L Kidney* Cord* DSO – 5 Segments 94. 2 92. 9 2. 0 1. 3 15. 5 DSO – 7 Segments 92. 7 92. 9 1. 8 1. 4 12. 8 95. 1 1. 5 1. 0 11. 3 PTV* 1 x 1 Beamlets 92. 2 PTV D 95 (Gy) DSO 86. 5 1 x 1 Beamlets 88. 5 Liver 4
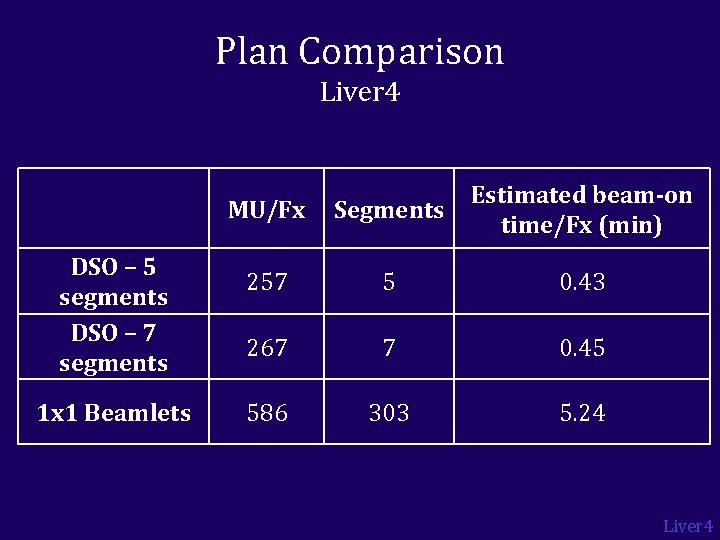
Plan Comparison Liver 4 DSO – 5 segments DSO – 7 segments 1 x 1 Beamlets MU/Fx Segments Estimated beam-on time/Fx (min) 257 5 0. 43 267 7 0. 45 586 303 5. 24 Liver 4
IMRT vs. DSO 1 x 1 beamlet plan DSO plan Liver 4
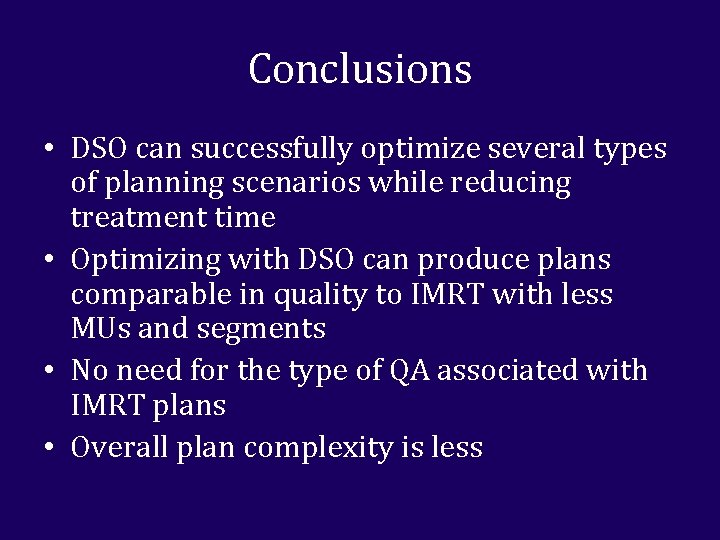
Conclusions • DSO can successfully optimize several types of planning scenarios while reducing treatment time • Optimizing with DSO can produce plans comparable in quality to IMRT with less MUs and segments • No need for the type of QA associated with IMRT plans • Overall plan complexity is less
Conclusions • In the future: – DSO may be more time efficient while yielding similar quality plans as IMRT in an adaptive replanning scenario – Since DSO produces flat-field plans, it may be useful for cases with inter- and intra-fraction motion – Looking at other sites that could benefit from twiddling (prostate, SBRT, pediatric)
Questions?