Direct Market Fresh Produce Pricing Overview Introduction The


- Slides: 20
Direct Market Fresh Produce Pricing Overview
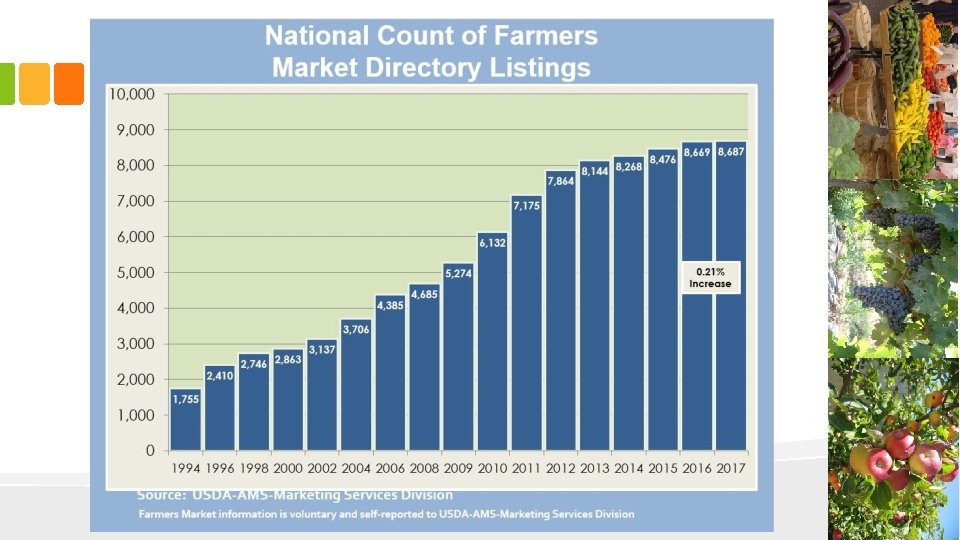
Introduction • The growth rate of farmers’ markets has slowed in recent years • Farmers are seeking a new customer base • Price setting at direct markets difficult for farmers • Consumers want fresh, quality produce at an affordable price • Low income households perceive direct markets to be more expensive than grocery stores
Introduction • Health benefits of consuming recommended levels of fruits and vegetables – Lowers risk of chronic diseases – Decreases risk for obesity • Yet, only 5 -20% of the U. S. population meet the recommended intake • Especially true for low-income households
Introduction • USDA programs for SNAP participants to shop at farmers’ markets 2008 2015 % 2008 2015 Participation Increase Redemptions Utah National 4 753 31 6, 996 675% 829% % Increase $5, 667 $75, 428 1, 231% $2. 7 million $20. 2 million 639% • In 2015, state agencies collectively issued ~$70. 6 billion in SNAP benefits, of that, Utah issued $313. 8 million in benefits
Goals • Illustrate pricing differences for fresh produce at direct market and traditional grocery stores • Illustrate pricing differences between organically and conventionally grown produce at direct markets and grocery stores • Illustrate pricing differences for fresh produce at local and national chain grocery stores • Provide direct market fresh produce pricing information for produce growers • Alleviate consumer misconceptions concerning the cost of fresh produce at direct markets and local grocery stores
Fresh Produce Pricing Data • Collected June to October 2016 & June to September 2017 – 8 Farmers’ markets across Utah – 14 Local/national grocery stores – 32 Fresh produce items • Total observations – 2, 546 Farmers’ market observations – 10, 038 Grocery store observations • Comparisons made on an individual produce items, as well as a “basket of produce” • Compare local vs. national grocery store chains, organic vs. conventional, and farmers’ market vs. grocery store
Grocery Store vs. Farmers’ Market Conventional Basket of Produce Quantity 1 ea 1 bunch 1 ea 2 ea 1 bag 3 ea 1 bag 1 head 1 carton 4 ears 1 pint 2 lbs 1 ea Item Cantaloupe Carrots Cucumber Green Bell Pepper Mixed Greens Onions Yellow Red Potatoes Romaine Strawberries Sweet Corn Tomatoes Cherry Tomatoes Slicing Watermelon Zucchini 95% CI: p-value = 0. 0917 Average Weight 3. 5 lbs 2 lbs 12 oz 1. 3 lbs 12 oz 2. 5 lbs 1. 2 lbs 1 lbs 3. 8 lbs 10. 5 oz 2 lbs 10 lbs 14 oz Total Price Grocery Farmers' Store Price Market Price $1. 87 $2. 95 $1. 61 $4. 27 $0. 81 $0. 84 $2. 21 $2. 16 $5. 45 $4. 99 $1. 83 $3. 02 $4. 58 $7. 72 $1. 51 $4. 47 $2. 59 $5. 37 $1. 96 $1. 69 $3. 26 $2. 50 $3. 30 $3. 20 $4. 49 $4. 36 $1. 19 $0. 85 $36. 66 $48. 38 Diff. -37% -62% -4% 2% 9% -40% -41% -66% -52% 16% 31% 3% 3% 41% -24% Organic Basket of Produce Quantity 1 ea 1 bunch 1 ea 2 ea 1 bag 3 ea 1 bag 1 head 1 carton 4 ears 1 pint 2 lbs 1 ea Item Cantaloupe Carrots Cucumber Green Bell Pepper Mixed Greens Onions Yellow Red Potatoes Romaine Strawberries Sweet Corn Tomatoes Cherry Tomatoes Slicing Watermelon Zucchini 95% CI : p-value = 0. 1386 Average Grocery Farmers' Weight Store Price Market Price 3. 5 lbs $3. 40 $2. 45 2 lbs $2. 54 $4. 67 12 oz $1. 68 $1. 54 1. 3 lbs $4. 04 $2. 97 12 oz $6. 64 $4. 25 2. 5 lbs $3. 07 $4. 91 5 lbs $6. 99 $10. 42 1. 2 lbs $2. 79 $3. 55 1 lbs $3. 87 $9. 38 3. 8 lbs $4. 95 $3. 34 10. 5 oz $3. 05 $3. 12 2 lbs $5. 08 10 lbs $9. 35 $5. 00 14 oz $2. 37 $2. 02 Total Price $59. 83 $62. 70 Diff. 39% -46% 9% 36% 56% -37% -33% -21% -59% 48% -2% 0% 87% 17% -5%
Grocery Store vs. Farmers’ Market Average Market Price of Each Basket $100, 00 $90, 00 $80, 00 $70, 00 $60, 00 $50, 00 $40, 00 $30, 00 $20, 00 $10, 00 $90, 62 Grocery Store Farmers Market $62, 81 $45, 51 $37, 44 $17, 86 Large Market Basket Medium Market Basket $16, 17 Small Market Basket
Grocery Store vs. Farmers’ Market • 28 Organic produce items 28 Organic Produce Items 6 Items [PERCENTA GE] 10 Items [PERCENTA GE] • 32 Conventional produce items • Difference in cost very item specific • Organics more expensive at grocery stores Less Expensive at Farmers' Market 12 Items [PERCENTA GE] More Expensive at Farmers' Market Comparably Priced [VALUE] 32 Conventional Items. Produce Items 16% [VALUE] Items 31% Less Expensive at Farmers' Market [VALUE] Items 53% More Expensive at Farmers' Market Comparably Priced
Organic vs. Conventional • Comparison of 29 and 30 fresh produce items • Organic produce is more expensive than conventional produce at grocery stores • Some organic products are less expensive than conventional at farmers’ markets 30 Grocery Store Produce Items Organic is Less Expensive [VALUE] Items 97% Organic is More Expensive [VALUE] Comparably Priced Item 3% 29 Farmers' Market Produce Items 10 Items [PERCENTA GE] 18 Items [PERCENTA GE] 1 Item [PERCENTA GE] Organic is Less Expensive Organic is More Expensive Comparably Priced
National vs. Local Grocery Stores Conventional Basket of Produce Average National Local Grocery Quantity Item Weight Grocery Store 1 ea Cantaloupe 3. 5 lbs $1. 80 $1. 94 1 bunch Carrots 2 lbs $1. 66 $1. 55 1 ea Cucumber 12 oz $0. 78 $0. 84 2 ea Green Bell Pepper 1. 3 lbs $2. 13 $2. 31 1 bag Mixed Greens 12 oz $5. 39 $5. 52 3 ea Onions Yellow 2. 5 lbs $1. 87 $1. 78 1 bag Red Potatoes 5 lbs $4. 73 $4. 40 1 head Romaine 1. 2 lbs $1. 76 $1. 28 1 carton Strawberries 1 lbs $2. 49 $2. 72 4 ears Sweet Corn 3. 8 lbs $1. 83 $2. 10 1 pint Tomatoes Cherry 10. 5 oz $3. 24 $3. 28 2 lbs Tomatoes Slicing 2 lbs $3. 54 $3. 02 1 ea Watermelon 10 lbs $4. 82 $4. 15 1 ea Zucchini 14 oz $1. 26 $1. 13 Total Price $37. 31 $36. 02 Diff. -7% 7% -8% -2% 5% 7% 38% -13% -1% 17% 16% 12% 4% Organic Basket of Produce Average National Local Grocery Quantity Item Weight Grocery Store 1 ea Cantaloupe 3. 5 lbs $3. 25 $3. 73 1 bunch Carrots 2 lbs $2. 55 $2. 50 1 ea Cucumber 12 oz $1. 70 $1. 65 2 ea Green Bell Pepper 1. 3 lbs $3. 52 $4. 94 1 bag Mixed Greens 12 oz $6. 24 $7. 18 3 ea Onions Yellow 2. 5 lbs $2. 56 $3. 93 1 bag Red Potatoes 5 lbs $6. 87 $7. 30 1 head Romaine 1. 2 lbs $3. 08 $1. 83 1 carton Strawberries 1 lbs $3. 65 $4. 39 4 ears Sweet Corn 3. 8 lbs $7. 83 $2. 08 1 pint Tomatoes Cherry 10. 5 oz $3. 15 $2. 81 2 lbs Tomatoes Slicing 2 lbs $4. 81 $5. 63 1 ea Watermelon 10 lbs $8. 66 $11. 42 1 ea Zucchini 14 oz $2. 59 $1. 65 Total Price $60. 46 $61. 05 Local grocery less expensive than national chains for conventional produce Diff. -13% 2% 3% -29% -13% -35% -6% 68% -17% 277% 12% -15% -24% 57% -1%
Grocery Store Comparison Conventional Basket of Produce Quantity Item Average Weight Lee's Marketplace* Smith's Grocery Walmart Macey's* Rancho Market* Bowman's Market* Target Harmon's Grocery* City Market Village Market* Davis* Lin's* 1 ea Cantaloupe 1 bunch Carrots 1 ea Cucumber 3. 5 lbs 2 lbs 12 oz $2. 12 $1. 63 $0. 86 $1. 93 $1. 65 $0. 73 $1. 54 $1. 36 $0. 72 $1. 81 $1. 72 $0. 85 $1. 93 $1. 30 $0. 66 $1. 42 $0. 88 $1. 95 $1. 66 $0. 95 $2. 36 $1. 65 $0. 88 $1. 77 $5. 88 $1. 33 $1. 59 $1. 57 $1. 23 $0. 97 $0. 00 $2. 49 $1. 23 $0. 67 2 ea 1 bag 3 ea 1 bag 1. 3 lbs 12 oz 2. 5 lbs $2. 18 $5. 50 $1. 72 $4. 22 $2. 21 $5. 78 $1. 88 $5. 19 $1. 87 $4. 12 $1. 67 $3. 82 $2. 52 $5. 39 $2. 06 $5. 00 $1. 95 N/A $1. 13 $4. 52 $2. 34 $5. 04 $1. 83 $3. 96 $2. 44 $6. 14 $2. 17 $4. 83 $2. 37 $6. 09 $1. 93 $4. 55 $1. 69 $7. 48 $2. 13 $6. 64 $2. 93 $7. 11 $2. 23 $2. 79 $3. 57 $6. 18 $1. 67 $4. 07 $1. 51 N/A $2. 03 $4. 42 1. 2 lbs 1 lbs $1. 17 $2. 64 $1. 15 $2. 60 $1. 90 $2. 21 $1. 34 $2. 57 $1. 22 $1. 45 $1. 23 $2. 33 $3. 87 $2. 69 $1. 41 $3. 65 $3. 49 $2. 58 $1. 61 $3. 68 $1. 30 $0. 00 $1. 48 $2. 58 Green Bell Pepper Mixed Greens Onions Yellow Red Potatoes 1 head Romaine 1 carton Strawberries 4 ears 1 pint Sweet Corn Tomatoes Cherry 3. 8 lbs 10. 5 oz $2. 01 $3. 52 $2. 04 $3. 63 $1. 38 $2. 75 $2. 01 $3. 25 $1. 55 $2. 06 $3. 08 $2. 02 $3. 07 $2. 03 $3. 45 $2. 61 $3. 67 $4. 06 N/A $4. 37 $2. 13 $3. 51 $4. 11 2 lbs Tomatoes Slicing 2 lbs $2. 94 $3. 18 $3. 38 $3. 74 $2. 20 $2. 72 $4. 34 $3. 30 $6. 57 $2. 86 $2. 55 $4. 07 $1. 28 $35. 85 $4. 95 $1. 07 $37. 99 $5. 24 $1. 52 $33. 49 $4. 46 $1. 22 $37. 94 $2. 88 $0. 79 $23. 62 $4. 88 $1. 03 $34. 47 $3. 58 $1. 30 $41. 00 $3. 91 $1. 14 $38. 72 $6. 28 $1. 59 $53. 71 $8. 14 $1. 79 $41. 59 $2. 58 $1. 19 $30. 58 $5. 05 $1. 16 $32. 79 1 ea Watermelon 1 ea Zucchini *Locally Owned 10 lbs 14 oz Total Price
Grocery Store Comparison
Farmers’ Market Comparison Conventional Basket of Produce Quantity Item 1 ea Cantaloupe 1 bunch Carrots 1 ea Cucumber 2 ea Green Bell Pepper 1 bag Mixed Greens 3 ea Onions Yellow 1 bag Red Potatoes 1 head Romaine 1 carton Strawberries 4 ears Sweet Corn 1 pint Tomatoes Cherry 2 lbs Tomatoes Slicing 1 ea Watermelon 1 ea Zucchini Average Cache Valley Ogden Farmers' Weight Gardners' Market 3. 5 lbs $2. 99 $2. 15 2 lbs $4. 12 $4. 82 12 oz $0. 69 $0. 90 1. 3 lbs $1. 80 $2. 23 12 oz $3. 43 $7. 20 2. 5 lbs $3. 47 $3. 03 5 lbs $6. 50 $7. 77 1. 2 lbs $4. 32 N/A 1 lbs $5. 47 $4. 17 3. 8 lbs $1. 26 $1. 75 10. 5 oz $3. 13 $2. 15 2 lbs $2. 97 $3. 39 10 lbs $4. 23 $4. 08 14 oz $0. 62 $0. 66 Total Price $44. 98 $44. 30 USU Botanical Center Farmers' Market $3. 51 $4. 88 $0. 76 $2. 03 $6. 00 $2. 54 $5. 85 $9. 80 N/A $1. 81 $1. 98 $2. 92 $3. 86 $0. 79 $46. 75 Some products not available at all markets. SLC Downtown Farmers' Market $2. 42 $4. 03 $1. 88 $5. 21 $2. 85 $11. 00 $3. 11 $7. 56 $1. 88 $2. 84 $3. 69 $4. 41 $1. 00 $52. 91
Farmers’ Market Comparison
Comparison by Area • Farmers’ market pricing more variable • Spikes in the high season • Lower pricing in October • Farmers’ markets more expensive only on certain months
Comparison by Area • Ogden market more expensive on average than grocery stores in the area • Logan pricing lower in 2016 than in 2017
Conclusions • Pricing at local grocery stores competitive with national chains and in many cases lower • Organic produce can be found at conventional prices more often at farmers’ markets • Farmers’ market pricing volatile and differs between major farmers’ markets • Price comparison very item specific • What do these mean for growers?
Thank You This material is based upon work supported by USDA/NIFA under Award Number 2015 -49200 -24225.