
Digital transformation risks and opportunities for banks in
Digital transformation: risks and opportunities for banks in the CIS Dmitry Nazarov, CFA Associate Financial Services Ratings Copyright © 2019 by S&P Global. All rights reserved.
Agenda Digitalization in the CIS countries: trends, conditions, opportunities. Azerbaijan: chasing the leaders. Digitalization and credit ratings. 2
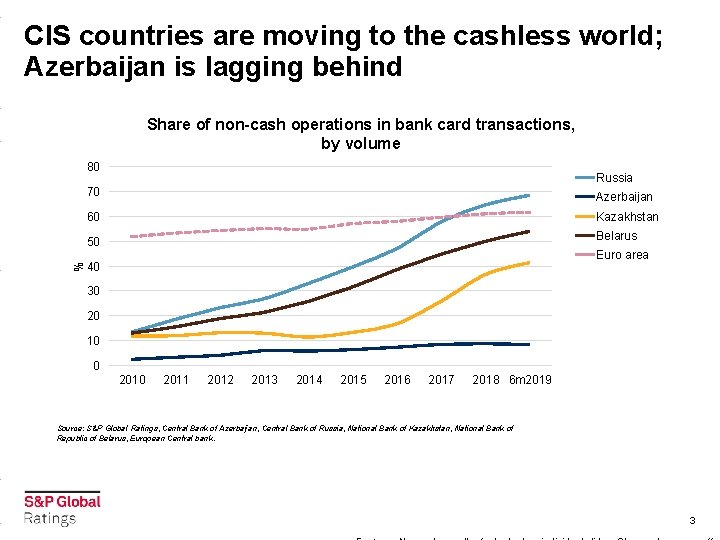
CIS countries are moving to the cashless world; Azerbaijan is lagging behind Share of non-cash operations in bank card transactions, by volume % 80 Russia 70 Azerbaijan 60 Kazakhstan 50 Belarus Euro area 40 30 20 10 0 2011 2012 2013 2014 2015 2016 2017 2018 6 m 2019 Source: S&P Global Ratings, Central Bank of Azerbaijan, Central Bank of Russia, National Bank of Kazakhstan, National Bank of Republic of Belarus, European Central bank. 3
Four drivers of digitalization: Technology, Regulation, Industry, Preferences (TRIP) Technology – banks’ technological capabilities. Regulation – regulator’s approach to digital transformation (proactive, reactive, protective). Industry – structure of the banking system and its ability to adapt and invest. Preferences – customer’s preferences for emerging technologies, and perceived likelihood to switch to nonbank competitors. In most countries, PREFERENCES are the most important driver. We also use TRIP model to analyze disruption risk for banking sectors stemming from digitalization. 4
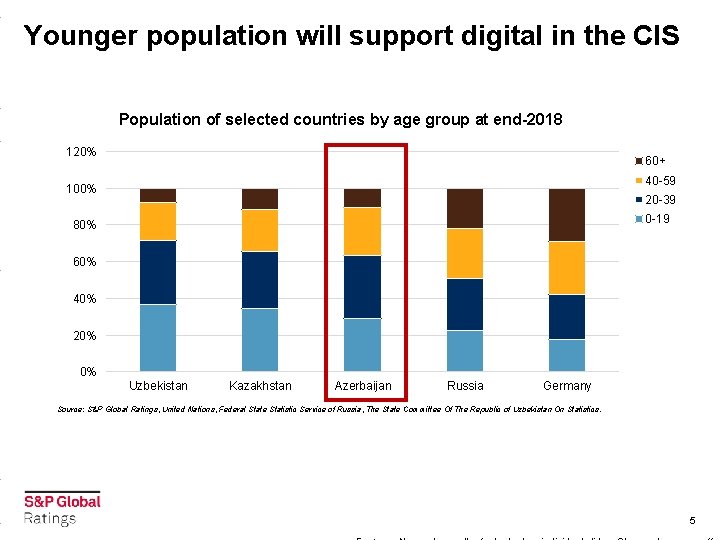
Younger population will support digital in the CIS Population of selected countries by age group at end-2018 120% 60+ 40 -59 100% 20 -39 0 -19 80% 60% 40% 20% 0% Uzbekistan Kazakhstan Azerbaijan Russia Germany Source: S&P Global Ratings, United Nations, Federal State Statistic Service of Russia, The State Committee Of The Republic of Uzbekistan On Statistics. 5
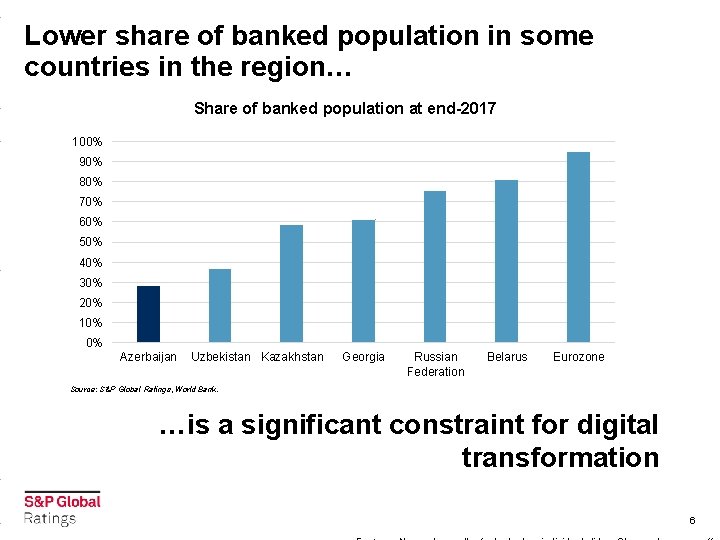
Lower share of banked population in some countries in the region… Share of banked population at end-2017 100% 90% 80% 70% 60% 50% 40% 30% 20% 10% 0% Azerbaijan Uzbekistan Kazakhstan Georgia Russian Federation Belarus Eurozone Source: S&P Global Ratings, World Bank. …is a significant constraint for digital transformation 6
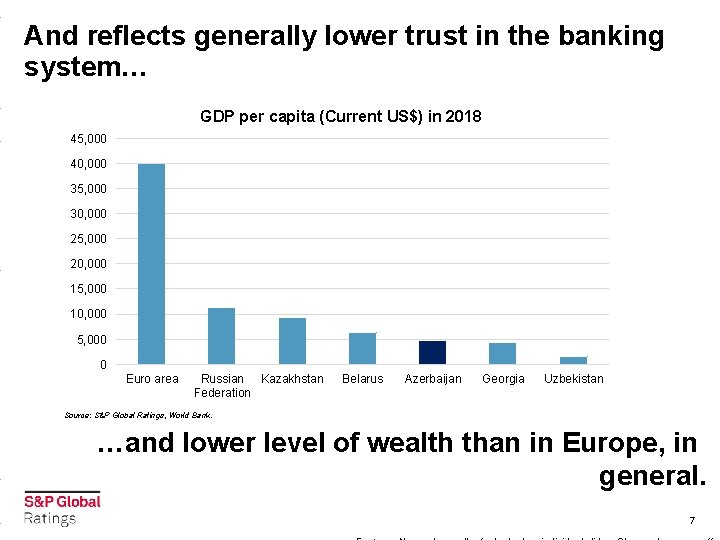
And reflects generally lower trust in the banking system… GDP per capita (Current US$) in 2018 45, 000 40, 000 35, 000 30, 000 25, 000 20, 000 15, 000 10, 000 5, 000 0 Euro area Russian Kazakhstan Federation Belarus Azerbaijan Georgia Uzbekistan Source: S&P Global Ratings, World Bank. …and lower level of wealth than in Europe, in general. 7

Challenging economic conditions and high share of problem assets… Problem loans as a % of gross loans % 45 2016 40 2017 35 2018 30 2019 F 25 20 15 10 5 0 Kazakhstan Azerbaijan Russia Belarus Uzbekistan Georgia Source: S&P Global Ratings. …distracted many CIS banks’ from digital transformation 8
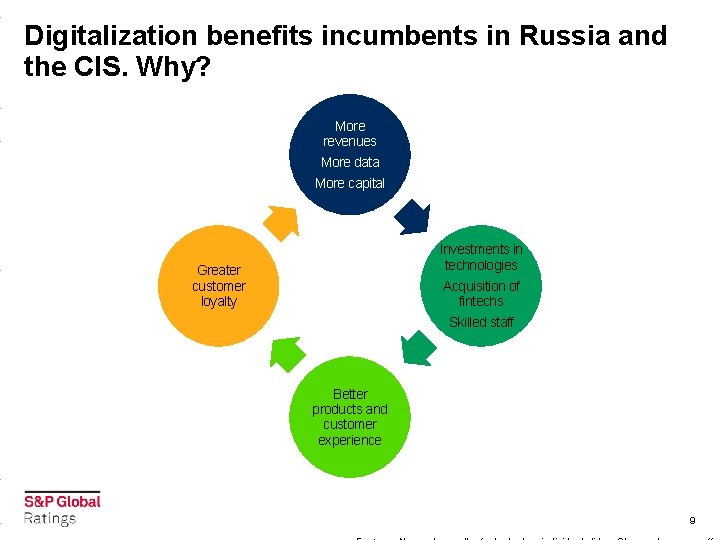
Digitalization benefits incumbents in Russia and the CIS. Why? More revenues More data More capital Investments in technologies Greater customer loyalty Acquisition of fintechs Skilled staff Better products and customer experience 9
Regulation Most regulators in the CIS are dormant and reactive in digital sphere. Russian CBR is an exception. In Europe most regulators favor competition and seek to better inform and protect customers. Examples of initiatives in Europe, concerning digital sphere: o PSD 2; o GDPR; o Regulatory sandboxes for fintechs (in the UK since 2016); o TIBER-EU (key initiative of the ECB in cybersecurity). 10
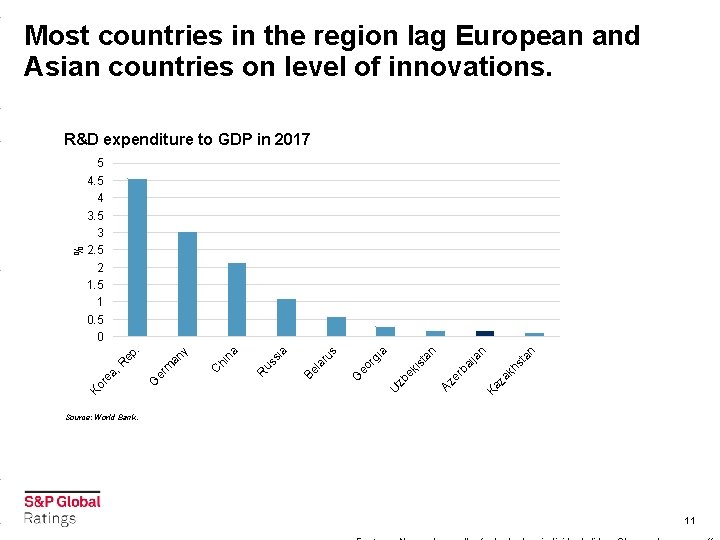
Most countries in the region lag European and Asian countries on level of innovations. st an n kh za Ka er b Az ek zb U ai ja ta n is rg ia eo G Be la r us a si us R hi n C an y er m G a, R Ko re a 5 4 3. 5 3 2. 5 2 1. 5 1 0. 5 0 ep. % R&D expenditure to GDP in 2017 Source: World Bank. 11
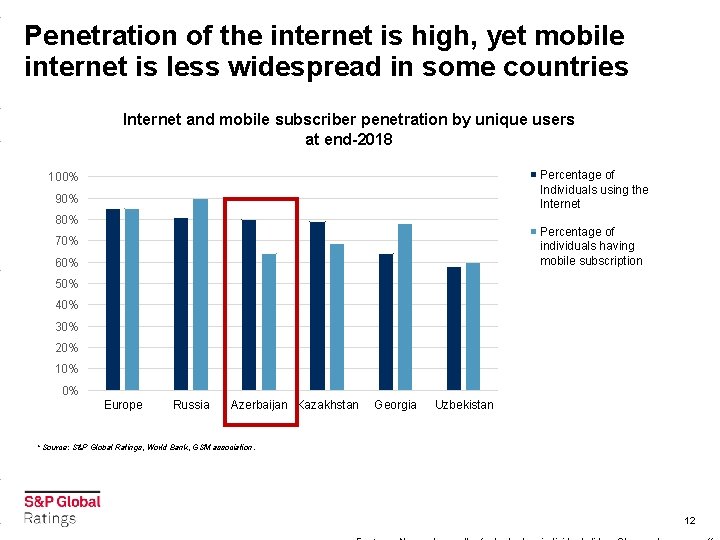
Penetration of the internet is high, yet mobile internet is less widespread in some countries Internet and mobile subscriber penetration by unique users at end-2018 Percentage of Individuals using the Internet 100% 90% 80% Percentage of individuals having mobile subscription 70% 60% 50% 40% 30% 20% 10% 0% Europe Russia Azerbaijan Kazakhstan Georgia Uzbekistan * Source: S&P Global Ratings, World Bank, GSM association. 12
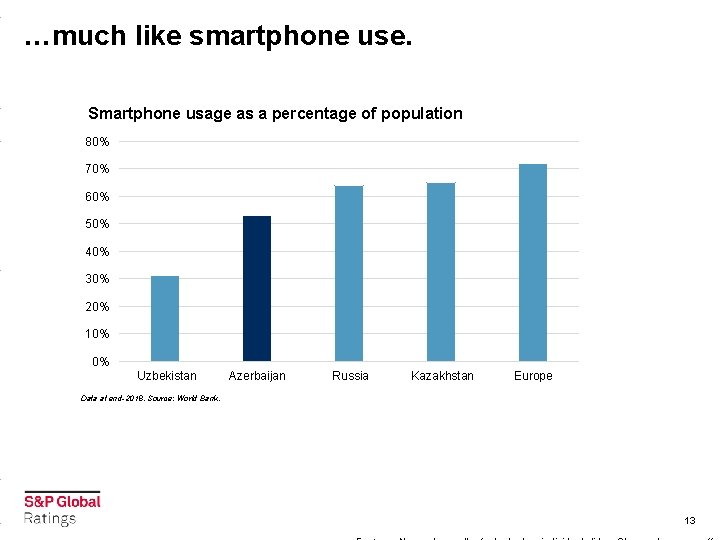
…much like smartphone use. Smartphone usage as a percentage of population 80% 70% 60% 50% 40% 30% 20% 10% 0% Uzbekistan Azerbaijan Russia Kazakhstan Europe Data at end-2018. Source: World Bank. 13
Banks’ technological capabilities differ a lot across the region Basic technologies such as automated credit scoring, mobile and internet banking are widespread. But few banks allow customers to fully digitize their experience with the bank. Even fewer exert much value from their data to create customertailored products. Lack of skilled IT staff is a serious constraint for some countries in the region 14
Disruption risks from fintechs are generally low in the CIS in the mid-term Generally low level of innovations outside the banking sector, compared with Asia and North America. Lack of venture capital. Lack of regulation, stimulating open banking and competition. 15
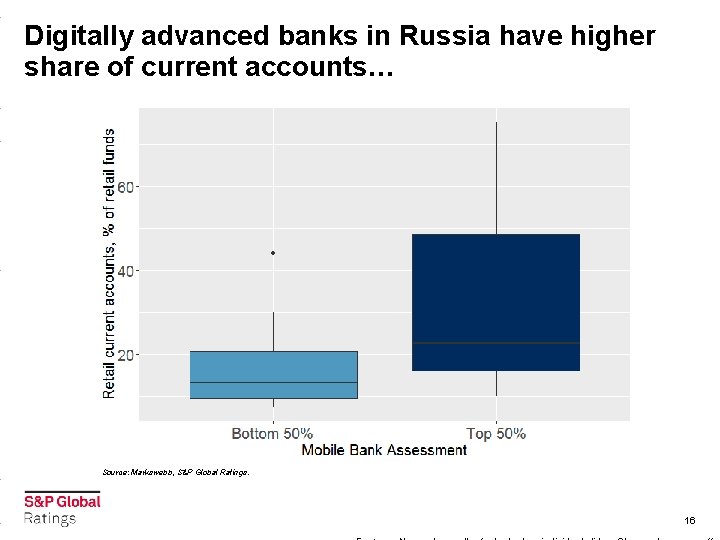
Digitally advanced banks in Russia have higher share of current accounts… Source: Markswebb, S&P Global Ratings. 16
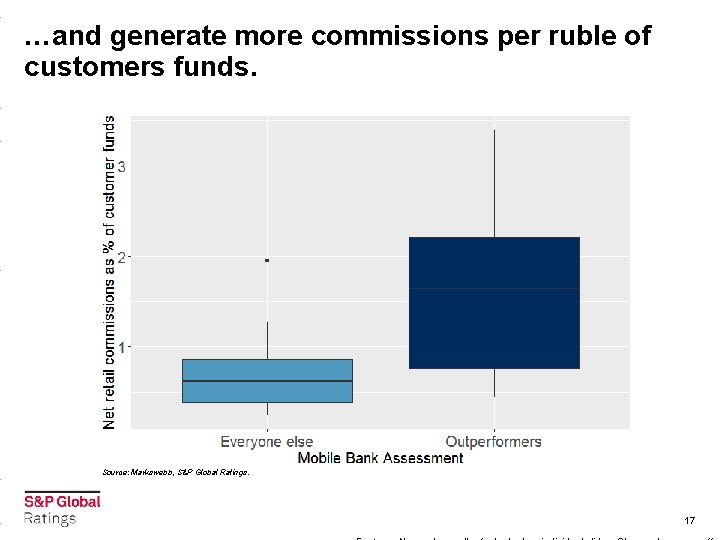
…and generate more commissions per ruble of customers funds. Source: Markswebb, S&P Global Ratings. 17
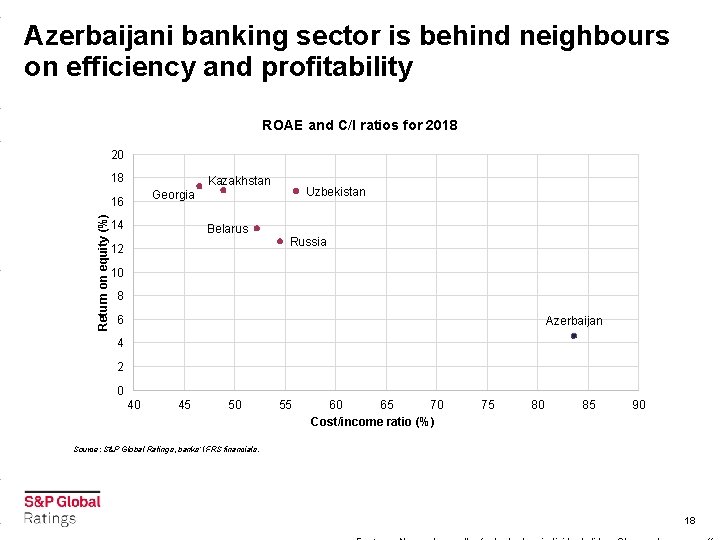
Azerbaijani banking sector is behind neighbours on efficiency and profitability ROAE and C/I ratios for 2018 20 18 Kazakhstan 16 Return on equity (%) Uzbekistan Georgia 14 Belarus 12 Russia 10 8 6 Azerbaijan 4 2 0 40 45 50 55 60 65 70 Cost/income ratio (%) 75 80 85 90 Source: S&P Global Ratings, banks’ IFRS financials. 18
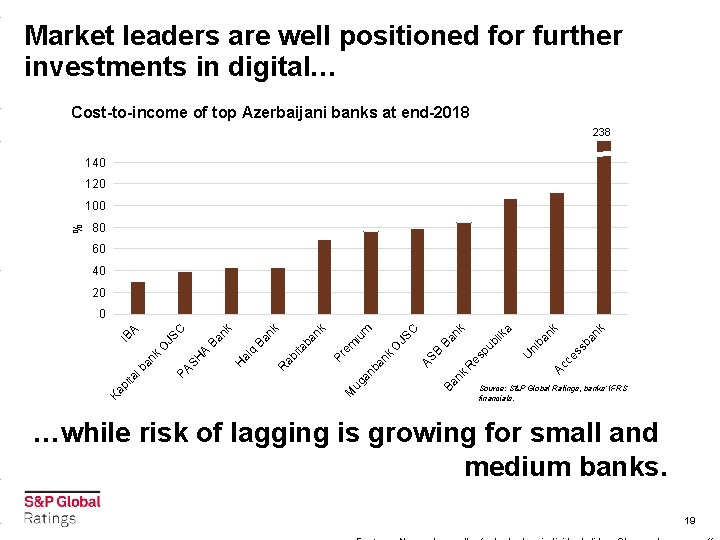
Market leaders are well positioned for further investments in digital… Cost-to-income of top Azerbaijani banks at end-2018 238 140 120 % 100 80 60 40 20 k ba n ss ce Ac U ni ba nk a lik es pu b an k nk R B B Ba nk O an ba ug AS JS C iu m em ita ab Pr ba nk nk H al q B a nk A Ba H PA S R M Ka p ita l b an k O JS IB A C 0 Source: S&P Global Ratings, banks’ IFRS financials. …while risk of lagging is growing for small and medium banks. 19
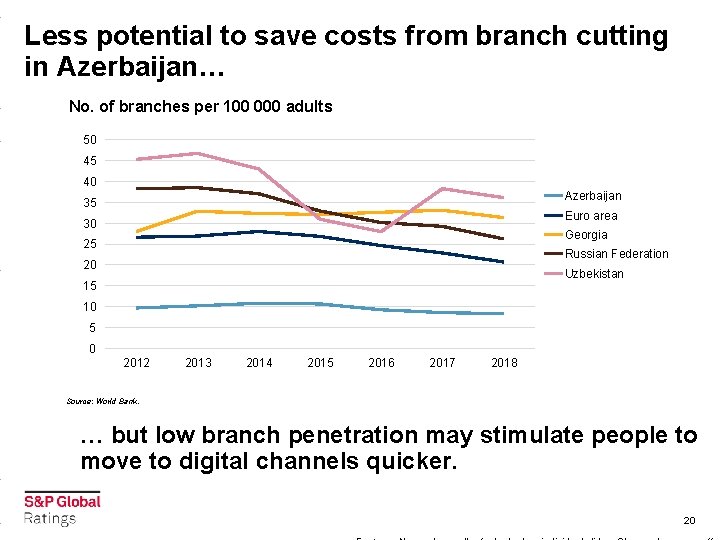
Less potential to save costs from branch cutting in Azerbaijan… No. of branches per 100 000 adults 50 45 40 Azerbaijan 35 Euro area 30 Georgia 25 Russian Federation 20 Uzbekistan 15 10 5 0 2012 2013 2014 2015 2016 2017 2018 Source: World Bank. … but low branch penetration may stimulate people to move to digital channels quicker. 20
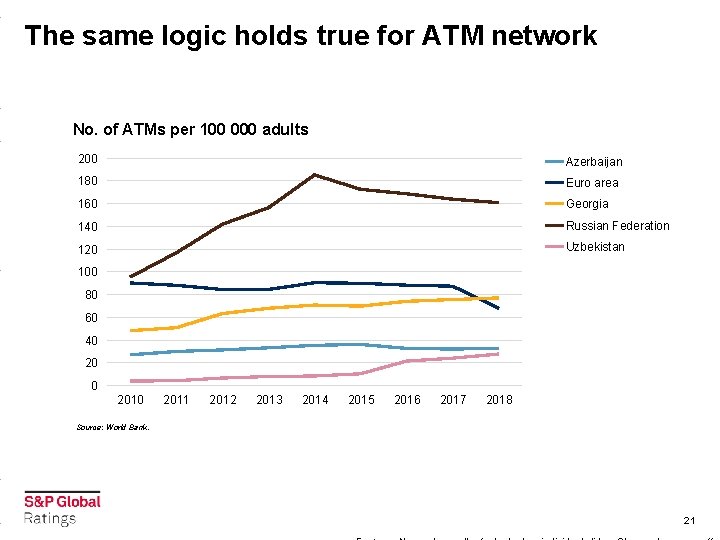
The same logic holds true for ATM network No. of ATMs per 100 000 adults 200 Azerbaijan 180 Euro area 160 Georgia 140 Russian Federation 120 Uzbekistan 100 80 60 40 2011 2012 2013 2014 2015 2016 2017 2018 Source: World Bank. 21

Digitalization in Azerbaijan – SWOT Analysis WEAKNESSES STRENGTHS • Relatively young population, receptive to new technologies; • Low trust of population in the banking system; • High penetration of the broadband internet; • Low penetration of the banking services; • Low innovation and technologies’ spending; • Growing penetration of the mobile internet and smartphones. • • OPPORTUNITIES Lack of qualified staff; Lack of capital and revenues for some banks. THREATS • Low penetration of ATMs and branches may push people to digital; • Foreign players with better technologies may threaten incumbents; • Lack of expensive legacy systems may simplify digital transition; • Threats to loose business for small, less digitally advanced banks; • Good opportunities for largest banks to entrench their market position. • Threats to loose part of the revenues to the Big. Tech – in the long-run. 22
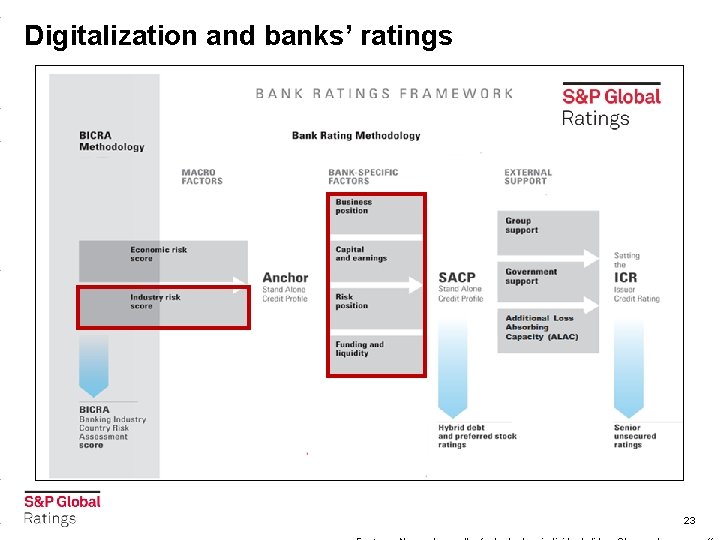
Digitalization and banks’ ratings 23
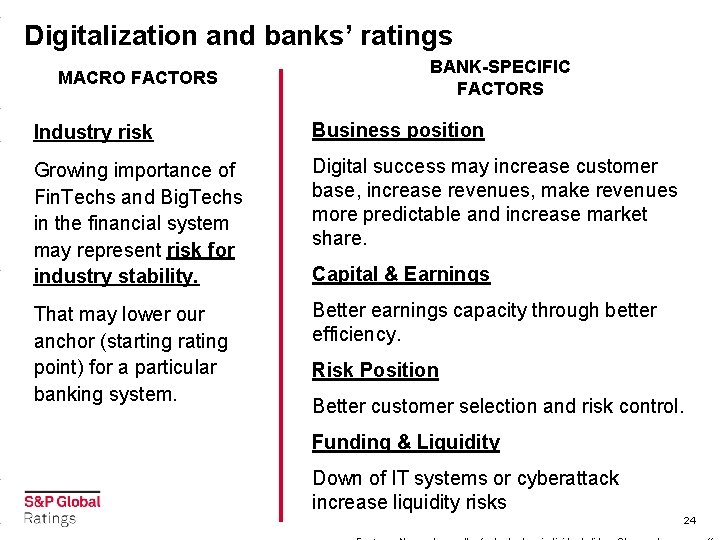
Digitalization and banks’ ratings MACRO FACTORS BANK-SPECIFIC FACTORS Industry risk Business position Growing importance of Fin. Techs and Big. Techs in the financial system may represent risk for industry stability. Digital success may increase customer base, increase revenues, make revenues more predictable and increase market share. That may lower our anchor (starting rating point) for a particular banking system. Better earnings capacity through better efficiency. Capital & Earnings Risk Position Better customer selection and risk control. Funding & Liquidity Down of IT systems or cyberattack increase liquidity risks 24
Thank you for your attention! © S&P Global Ratings 2019. All rights reserved.
No content (including ratings, credit-related analyses and data, valuations, model, software or other application or output therefrom) or any part thereof (Content) may be modified, reverse engineered, reproduced or distributed in any form by any means, or stored in a database or retrieval system, without the prior written permission of Standard & Poor’s Financial Services LLC or its affiliates (collectively, S&P). The Content shall not be used for any unlawful or unauthorized purposes. S&P and any third-party providers, as well as their directors, officers, shareholders, employees or agents (collectively S&P Parties) do not guarantee the accuracy, completeness, timeliness or availability of the Content. S&P Parties are not responsible for any errors or omissions (negligent or otherwise), regardless of the cause, for the results obtained from the use of the Content, or for the security or maintenance of any data input by the user. The Content is provided on an “as is” basis. S&P PARTIES DISCLAIM ANY AND ALL EXPRESS OR IMPLIED WARRANTIES, INCLUDING, BUT NOT LIMITED TO, ANY WARRANTIES OF MERCHANTABILITY OR FITNESS FOR A PARTICULAR PURPOSE OR USE, FREEDOM FROM BUGS, SOFTWARE ERRORS OR DEFECTS, THAT THE CONTENT’S FUNCTIONING WILL BE UNINTERRUPTED OR THAT THE CONTENT WILL OPERATE WITH ANY SOFTWARE OR HARDWARE CONFIGURATION. In no event shall S&P Parties be liable to any party for any direct, incidental, exemplary, compensatory, punitive, special or consequential damages, costs, expenses, legal fees, or losses (including, without limitation, lost income or lost profits and opportunity costs or losses caused by negligence) in connection with any use of the Content even if advised of the possibility of such damages. Credit-related and other analyses, including ratings, and statements in the Content are statements of opinion as of the date they are expressed and not statements of fact. S&P’s opinions, analyses and rating acknowledgment decisions (described below) are not recommendations to purchase, hold, or sell any securities or to make any investment decisions, and do not address the suitability of any security. S&P assumes no obligation to update the Content following publication in any form or format. The Content should not be relied on and is not a substitute for the skill, judgment and experience of the user, its management, employees, advisors and/or clients when making investment and other business decisions. S&P does not act as a fiduciary or an investment advisor except where registered as such. While S&P has obtained information from sources it believes to be reliable, S&P does not perform an audit and undertakes no duty of due diligence or independent verification of any information it receives. To the extent that regulatory authorities allow a rating agency to acknowledge in one jurisdiction a rating issued in another jurisdiction for certain regulatory purposes, S&P reserves the right to assign, withdraw or suspend such acknowledgement at any time and in its sole discretion. S&P Parties disclaim any duty whatsoever arising out of the assignment, withdrawal or suspension of an acknowledgment as well as any liability for any damage alleged to have been suffered on account thereof. S&P keeps certain activities of its business units separate from each other in order to preserve the independence and objectivity of their respective activities. As a result, certain business units of S&P may have information that is not available to other S&P business units. S&P has established policies and procedures to maintain the confidentiality of certain non-public information received in connection with each analytical process. S&P may receive compensation for its ratings and certain analyses, normally from issuers or underwriters of securities or from obligors. S&P reserves the right to disseminate its opinions and analyses. S&P's public ratings and analyses are made available on its Web sites, www. standardandpoors. com (free of charge), and www. ratingsdirect. com and www. globalcreditportal. com (subscription), and may be distributed through other means, including via S&P publications and third-party redistributors. Additional information about our ratings fees is available at www. standardandpoors. com/usratingsfees. Australia Standard & Poor's (Australia) Pty. Ltd. holds Australian financial services license number 337565 under the Corporations Act 2001. Standard & Poor’s credit ratings and related research are not intended for and must not be distributed to any person in Australia other than a wholesale client (as defined in Chapter 7 of the Corporations Act). STANDARD & POOR’S, S&P and RATINGSDIRECT are registered trademarks of Standard & Poor’s Financial Services LLC. 26
- Slides: 26