Digital Transformation Republic of Cameroon Saas Plaza USAG


Digital Transformation Republic of Cameroon Saas. Plaza & USAG

Digital Transformation Republic of Cameroon Saas. Plaza & USAG

Hoster of the Year Internet Initiative of Japan

THANK YOU

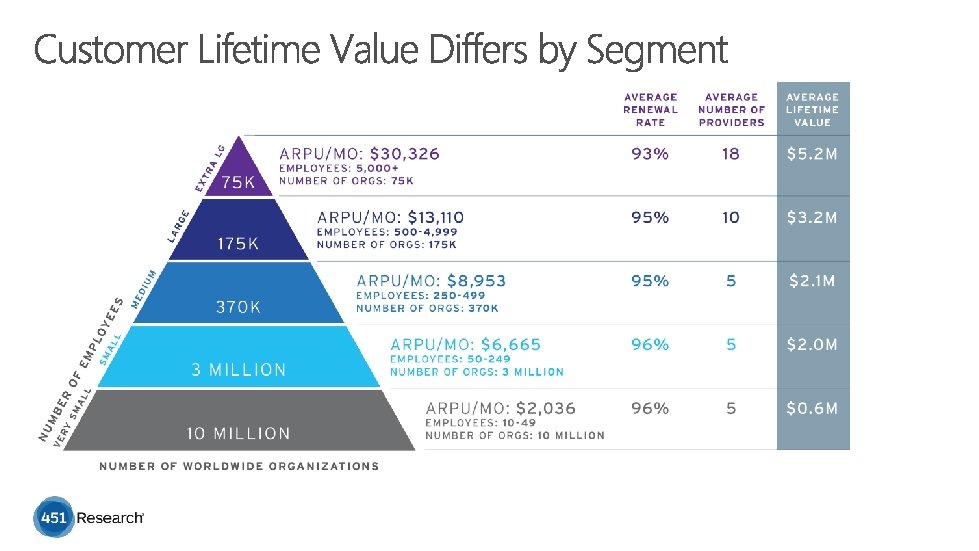
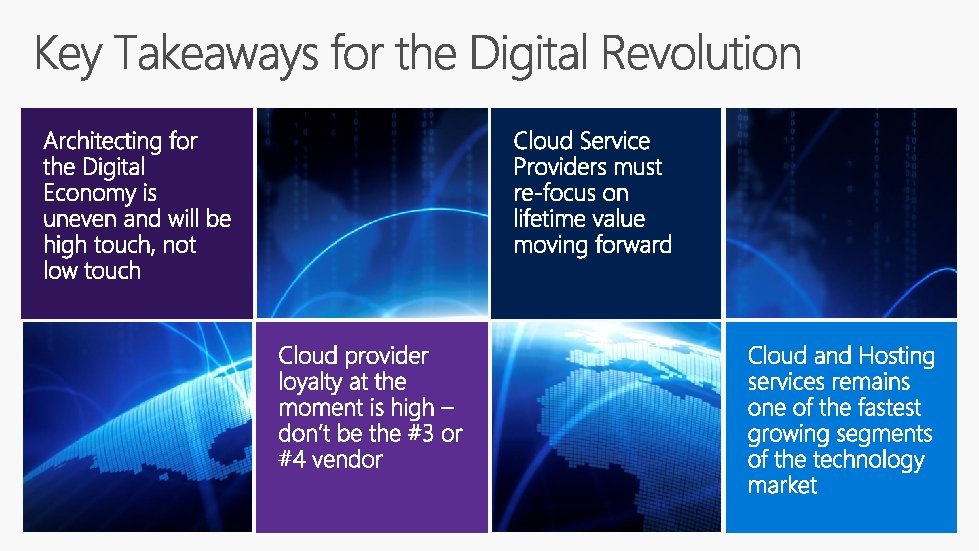
THE ROAD AHEAD Architecting for the digital economy Customer Loyalty fuels growth 57% of org infrastructure will 95% of customers expect 70% of budget is beyond 38% of organizations will be digital in two years to stay with current provider Opportunity is in lifetime value 85% of customers are beyond discovery cloud phase 15% Digita l is the Destination infrastructure hosting increase hosting & cloud spend at renewal Less than have reached broad implementation phase

Microsoft Cloud Platform CSP Cloud Solution Provider Program

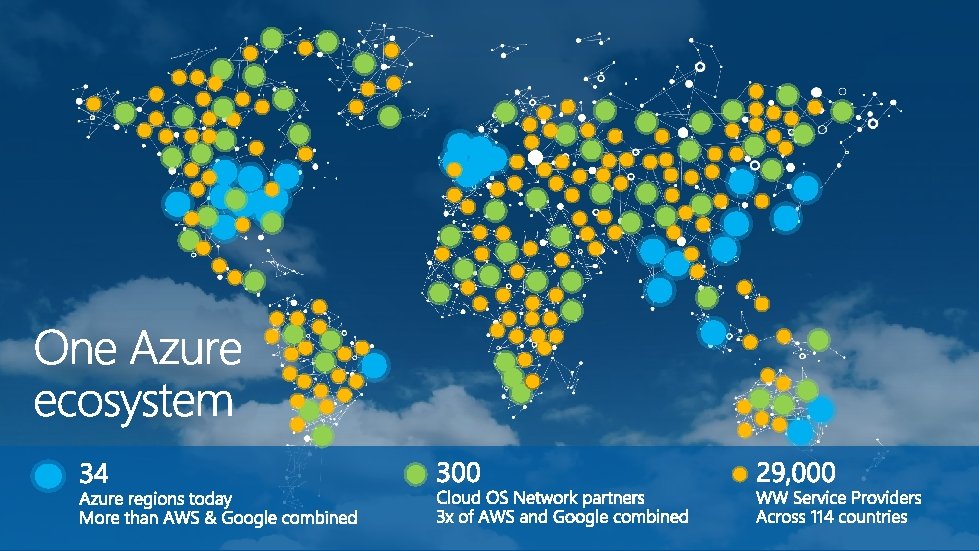
Cloud Solution Provider Program 15, 000+ Indirect and Direct CSP Partners 8 M+ Office 365 Seats Deployed CSP + Syndication 400+ Service Providers with Azure Hybrid Scenarios Microsoft Cloud Platform 300+ Cloud OS Network partners +10 K Customers 60+ Service Providers in Azure Stack Technical Assessment Over 20% Yo. Y SQL growth

Q. Estimate the reliance of your organization on physical infrastructure vs. digital infrastructure to deliver products and services, today and in 2 years. 51% Digital 57% Digital n=1734

Q n=1734 Market Disrupter: fundamentally changing an existing market, such as Uber or Airbnb. [VALUE] 46% Market Maker: creating a market that did not previously exist, such as i. Robot, Facebook or Twitter Under Reinvention: reinventing and/or repositioning your organization, such as GE's focus on environmental technologies Staying the Course: continuing to execute existing strategies 22. 3% 14. 5% 9. 2% [VALUE] Transitioning: being sold/acquired/divesting/bankruptcy etc. Market Disruptor Market Maker Under Reinvention Staying The Course Transitioning High Business Transformation 47. 2% 49. 0% 48. 1% 25. 3% 54. 5% High IT Portfolio Transformation 51. 6% 48. 6% 47. 3% 30. 5% 49. 3% % Digital Infrastructure in 2 Years 60. 7% 57. 8% 58. 1% 55. 0% 55. 1% % Digital Infrastructure Change 5. 0% 3. 9% 6. 7% 7. 1% 1. 7%

Q. Rate the level of investment in the following technologies over the next 5 years in terms of meeting your business goals where 0=no investment and 10=significant investment. 59% 58% 57% 55% 53% 53% 51% 50% 48% 45% 43% 40% 39% Cloud-based software and applications Cybersecurity protection Cloud-based infrastructure Mobile platforms and applications Customer experience management systems Data integration across multiple lines of business & platforms Collaborative tools/Productivity tools for employees Agile software development processes for fast feedback Data mining and analytics Social-media enabled business process Governance/regulatory tools Sensor-based technology Artificial intelligence Wearables Robotics 3 D printing 0% 10% % Rating 8 -10 20% 30% 40% 50% 60% 70% n=1734

38% to 56% The shift of workloads to cloud environments over the next two years is dramatic, from 38% overall today to 56% expected in two years Off-premises workloads also shift from 29% today to 44% in two years Cloud providers will account for 68% of all Cloud workloads, up from 60% today Base=Cloud Adopters Source: 451 Research, Voice of the Enterprise: Cloud Computing, Q 2 2015

Q. Which of the following best describes how your organization will use different on-premises & off-premises cloud environments over the next two years? n = 939 Q. Has your organization configured any of the following clouds for interoperability? 61% ON PREMISES PRIVATE cloud with a HOSTED PRIVATE cloud 63% 74% 42% ON PREMISES PRIVATE cloud with a PUBLIC cloud + + HOSTED PRIVATE cloud with a PUBLIC cloud -20% 45% 50% 40% 32% 33% 30% 2014 Multi-Users (n=989) 2015 Multi-Hybrid Users (n=1419) 2016 Multi-Hybrid Users (n=1116) Source: 451 Research, Voice of the Enterprise: Cloud Computing, Q 2 2015 80%

Q. Approximately what percent of your HOSTING & CLOUD SERVICES budget in 2016 is allocated to the following services? n=1600 100% 90% 21% 23% 21% 22% 80% 70% 60% 50% 40% 27% 26% 30% 20% 10% 31% 29% 2015 2016 2017 est 0% Security Services Managed Services Application Hosting Infrastructure Hosting Over 70% of cloud spending is now beyond Infrastructure services Hosting is truly fullservice Security is a core differentiator; customers expect to pay for it

Percent of Respondents Infrastructure Services Application Services Security Services

Managed Services Backup and Recovery Mobile Services Cloud Migration Services Application development tools & platforms Cloud Assessment, Readiness & Enableme. . . Cloud Transformation Services Archiving Disaster Recovery/Site Recovery Premium 24 x 7 support services End-to-End Application management Cloud Brokering Services Partner-enabled one-stop-shopping Capacity Planning tools CDN/Media Streaming 60% 41% 41% 40% 39% 38% 36% 34% 30% 28% 25% 18% 0% 10% 20% 30% Percent of Respondents 40% 50% 60% 70%

Bare Metal Servers 16% Partner-enabled one-stop-shopping 11% Capacity Planning tools 8% Cloud Brokering Services 7% Data Sovereignty/Data Residency 6% Cloud Transformation Services 6% Cloud Migration Services 5% Rate the level of transformation required in your current IT or digital portfolio to support this level of business transformation over the next five years. 0=no transformation, 10=major transformation, n=1734 Level of IT Portfolio Transformation Note: The percentages quoted are standardized beta weights from a stepwise regression analysis. They denote relative importance of the driver. Security -6% Hosted Private Cloud -6% Basic Website Hosting -6%

Total Cloud Spending with Primary Provider: 48%

Renewal Rates % of customers intending to renew their contract with their primary provider are best in class at average of 95%

Average number of years with Primary provider: 3. 2 years

The Impact of Churn and Pricing on Lifetime Value

Q. What is your organizations contract terms with Provider, meaning how long are you obligated to pay for their services? 8% 13% 5% 11% No contract: Hourly/on-demand use Month to Month contract Annual contract Two year contract 22% Three year contract 41% Multi-year contract Other, please specify n=1734 Most (43%) of organizations have a multi-year contract with their primary provider 38% of customers will increase spend upon renewal (vs 10% decreasing spend) for additional performance, services and capacity
![Q. Please rate [Primary Service Provider] on the following service attributes where 0=poor and](http://slidetodoc.com/presentation_image_h/a1ec1e5b39b2f5a027371c7ab644ef8e/image-30.jpg "Q. Please rate [Primary Service Provider] on the following service attributes where 0=poor and")
Q. Please rate [Primary Service Provider] on the following service attributes where 0=poor and 10=excellent. Q. Overall, how satisfied are you with [Primary Service Provider]? Use a scale from 0 to 10 where 0=not at all satisfied and 10= extremely satisfied Q. How likely is it that you would recommend [Primary Service Provider] to a friend or colleague? Use a scale from 0 to 10 where 0=not at all likely and 10= extremely likely Performance on Selection Criteria 69. 0% Trustworthy company Technical expertise/knowledge 68. 3% Product performance & reliability Consistently deliver 67. 8% 67. 6% Secure products and services 67. 1% Experience 67. 1% Percent Rating 8 -10 on Quality Predictors of Satisfaction and Advocacy 11% Staff goes above & beyond 10% Trustworthy company 9% Economical/low cost 8% Accessible/Easy to reach Breadth of offerings 7% Product performance & reliability 7% Understands my business 6% Note: The percentages quoted are standardized beta weights from a stepwise regression analysis. They denote relative importance of 2016 Microsoft Cloud and Hosting the driver in predicting vendor satisfaction and advocacy. Summit

$US Millions Cloud Share Increases from 7% to 28% $140, 000 $120, 000 $100, 000 $80, 000 $60, 000 $40, 000 $20, 000 $0 2010 Dedicated Hosting $3, 078 Shared Hosting $8, 584 Managed Hosting $12, 808 Infrastructure as a Service $680 Platform as a Service $316 Infrastructure Software as a Service $695 Total Hosting + Cloud $26, 162 2011 $3, 257 $9, 385 $15, 524 $1, 572 $618 $1, 003 2012 $3, 468 $10, 455 $18, 931 $2, 872 $1, 358 $1, 422 2013 $3, 690 $11, 256 $25, 703 $4, 801 $1, 523 $2, 215 2014 $3, 922 $12, 627 $30, 845 $7, 039 $2, 287 $3, 087 2015 $4, 166 $14, 069 $36, 766 $9, 682 $3, 121 $4, 107 $31, 358 $38, 507 $49, 188 $59, 806 $71, 912 Source: 451 Research, Cloud Computing Market Monitor, 2016 $4, 405 $15, 592 $43, 562 $12, 507 $3, 979 $5, 358 2017 $4, 655 $17, 185 $51, 444 $15, 353 $4, 900 $6, 795 2018 $4, 915 $18, 840 $60, 433 $18, 199 $5, 880 $8, 352 2019 $5, 199 $20, 536 $70, 550 $21, 214 $6, 936 $9, 977 CAGR 15 -19 $85, 402 $100, 333 $116, 619 $134, 411 16. 9% 5. 7% 9. 9% 17. 7% 21. 7% 22. 1% 24. 8%

Thank You! Michelle Bailey SVP Datacenter Initiatives and Data Strategy 451 Research michelle. bailey@451 research. com @mbailey 316

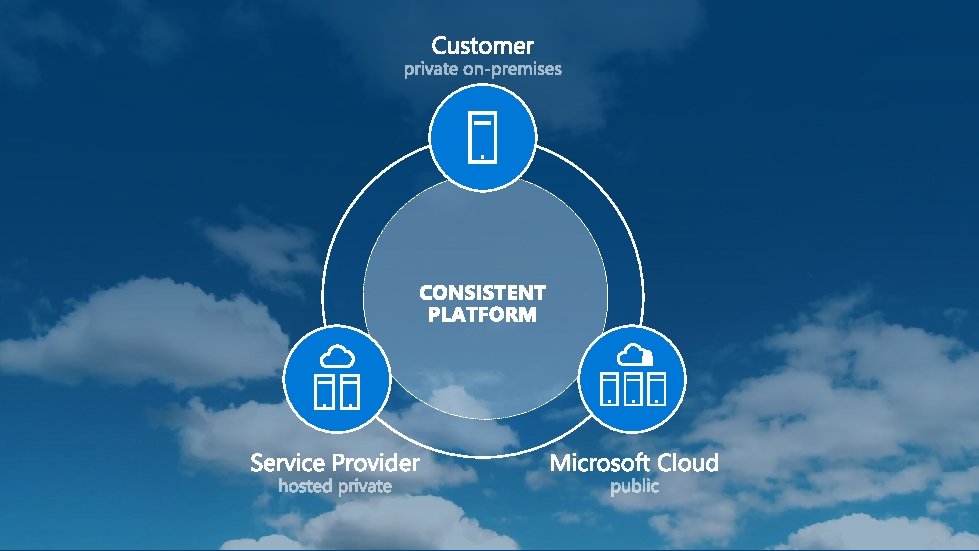
Hybrid solutions use Windows Server in the datacenter and in the cloud Own the end-toend customer relationship via CSP Run Azure cloud services in your datacenter The Microsoft cloud platform empowers partners with the right solutions for your customers’ big challenges. MICROSOFT CONFIDENTIAL

Industry potential for hybrid 27% CAGR 2019 Spending in billions 90 80 70 60 2. 8% 50 growth IT spending in 2020 40 30 20 10 0 2014 2015 2016 $Bn 2017 2018 Linear($Bn) 2019 “I start to think of a multi cloud environment as a foundation for a next wave of applications. ” Gartner Inc. ’s Ed Anderson in a WSJ Special report: CIOs Say Hybrid Cloud Takes Off MICROSOFT CONFIDENTIAL

>120, 000 >1. 4 M New Azure customer subscriptions/month SQL Databases running on Azure "Microsoft’s comprehensive hybrid story, which spans applications and platforms as well as infrastructure, is highly attractive to companies, drawing towards 777 T them>40% >5 M many 2 T Storage transactions Messagesin pergeneral. ” month Revenue from Organizations inthe cloud processed by Io. T LYDIAAzure LEONG, Azure Active Directory GARTNER per day startups and ISVs

The cloud-ready server operating system that delivers new layers of security and Azure-innovation for the applications and infrastructure that power your business. Built-in Security Software-defined Datacenter Cloud-ready Application Platform Built-in layers of security Built-in SDDC capabilities Built-in containers Protection to Identity Affordable and enterprise ready Lightweight Nano Server option Secure the virtualization platform Azure-inspired infrastructure

Microsoft hybrid cloud management Simplified guest and workload management, both on-premises & in the cloud On-premises datacenter Public and hosted clouds Microsoft System Center Azure or AWS WINDOWS HYPER-V WINDOWS VMWare WINDOWS Microsoft Operations Management + Security WINDOWS Log Analytics, Configuration, Automation, Security, Backup, Site Recovery

Azure Stack

Battle testing services, so you don’t have to Develop Azure Services Deliver Services using your datacenter Repeat Operate at Hyper-Scale Add Provider experiences Scale & integration points

MANAGED SERVICES Resource and cost optimization Cloud managed services = Monitoring, management, security MORE $$ Migrations and replatforming Support Resell TRADITIONAL DATACENTER MANAGEMENT Hybrid Offers App Lifecycle management EXPAND YOUR OFFER PORTFOLIO Paa. S Services Industry solutions

MANAGED SERVICES Cloud & Hosting Service Providers EXPAND YOUR OFFER PORTFOLIO


Monday July 11, 2016 Program Key GTM & Partnership Infrastructure Licensing Applications HMSP 01 Empowering digital transformation with Microsoft cloud solutions for hosting, cloud and managed service providers North 105 1: 00 – 2: 00 PM HMSP 02 Success with Azure: Transform your business with Microsoft Azure South 713 AB 2: 30 – 3: 30 PM HMSP 03 Selling SQL: Grow your SQL business with SQL offers and programs for hosting partners South 713 AB 4: 00 – 5: 00 PM Tuesday July 12, 2016 HMSP 04 Skype for Business Online: Overview, sales scenarios, go-to-market motions for SMB through the Cloud Solution Provider (CSP) program South 713 AB 1: 00 – 2: 00 PM HMSP 05 What is the magic Office 365 customer formula for Cloud Solution Provider (CSP) partners? Top lessons learned from Go. Daddy and Rackspace South 713 AB 2: 30 – 3: 30 PM HMSP 06 Building a best practice partnership: The evolution of cloud, collaboration and opportunity South 709 2: 30 – 3: 30 PM HMSP 07 Migrating from hosted Exchange to Office 365: What should you know South 713 AB 4: 00 – 5: 00 PM HMSP 08 A practical look at CSP offers, billing and monetization South 709 4: 00 – 5: 00 PM Wednesday July 13, 2016 HMSP 09 The next frontier: Managed services on Microsoft Azure – seize the opportunity and grow revenue and profits South 713 AB 1: 00 – 2: 00 PM HMSP 10 Hybrid licensing South 709 1: 00 – 2: 00 PM HMSP 11 Keys to building a strong EMS offer and sales practice with the Cloud Solution Provider (CSP) program South 713 AB 2: 30 – 3: 30 PM HMSP 12 No Usage=No Revenue! Understanding the Cloud Customer journey for selling and driving consumption of Office 365 South 709 2: 30 – 3: 30 PM HMSP 13 Making hybrid cloud real with Azure Stack South 713 AB 4: 00 – 5: 00 PM

- Slides: 48