
Digital Signal Processing Lab 3 Filter analysis implementation
Digital Signal Processing Lab 3: Filter analysis & implementation in Matlab Toon van Waterschoot, Marc Moonen ESAT – Departement of Electrical Engineering KU Leuven, Belgium
Digital Signal Processing: Lab Sessions • Session 1: Signal generation & analysis in Matlab • Session 2: Embedded DSP implementation of energy-based voice • • • activity detector Session 3: Filter analysis & implementation in Matlab Session 4: Embedded DSP implementation of FIR filter Session 5: NLMS adaptive filtering in Matlab Session 6: Embedded DSP implementation of NLMS adaptive filter Session 7: Embedded DSP implementation of acoustic echo canceller 2 Image source: pinterest. com
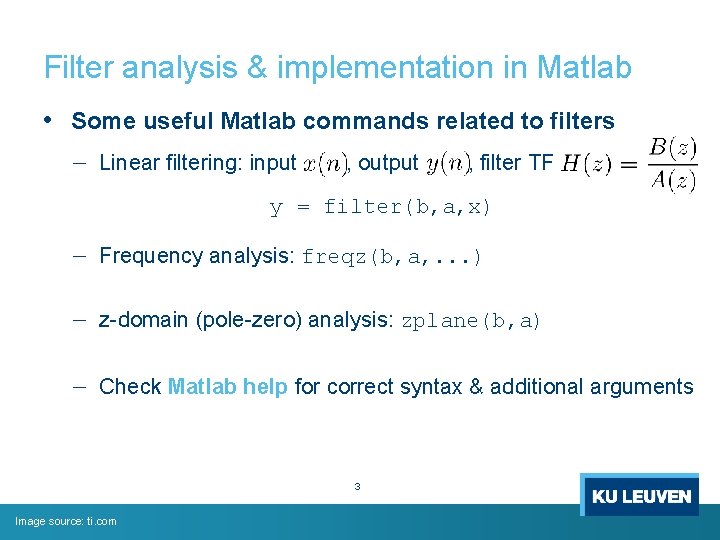
Filter analysis & implementation in Matlab • Some useful Matlab commands related to filters - Linear filtering: input , output , filter TF y = filter(b, a, x) - Frequency analysis: freqz(b, a, . . . ) - z-domain (pole-zero) analysis: zplane(b, a) - Check Matlab help for correct syntax & additional arguments 3 Image source: ti. com
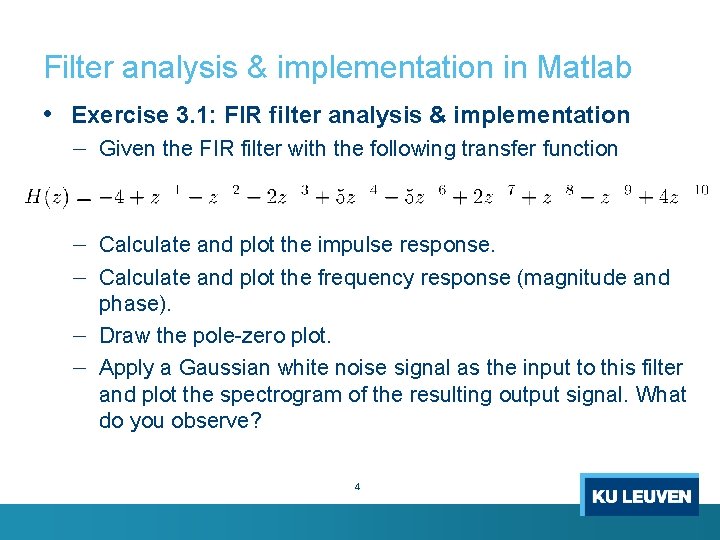
Filter analysis & implementation in Matlab • Exercise 3. 1: FIR filter analysis & implementation - Given the FIR filter with the following transfer function - Calculate and plot the impulse response. Calculate and plot the frequency response (magnitude and phase). Draw the pole-zero plot. Apply a Gaussian white noise signal as the input to this filter and plot the spectrogram of the resulting output signal. What do you observe? - - - 4
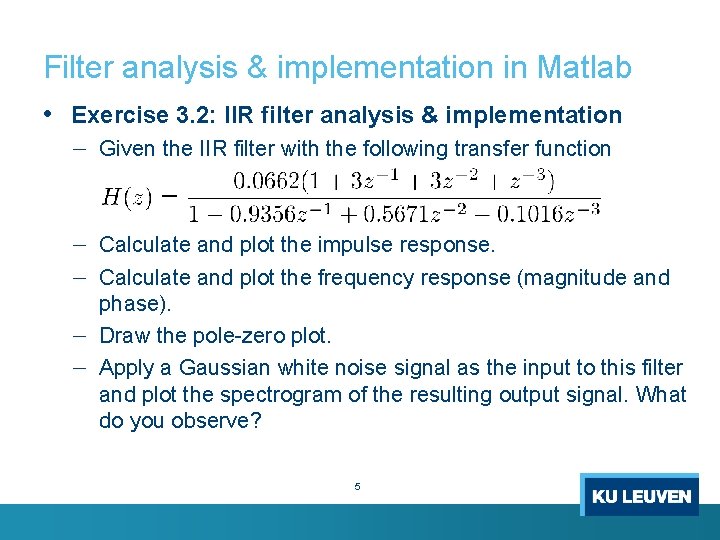
Filter analysis & implementation in Matlab • Exercise 3. 2: IIR filter analysis & implementation - Given the IIR filter with the following transfer function - Calculate and plot the impulse response. Calculate and plot the frequency response (magnitude and phase). Draw the pole-zero plot. Apply a Gaussian white noise signal as the input to this filter and plot the spectrogram of the resulting output signal. What do you observe? - - - 5
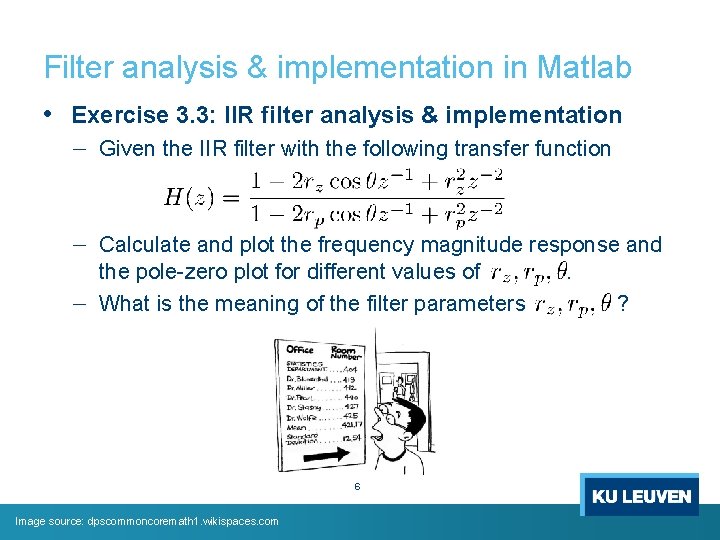
Filter analysis & implementation in Matlab • Exercise 3. 3: IIR filter analysis & implementation - Given the IIR filter with the following transfer function - Calculate and plot the frequency magnitude response and the pole-zero plot for different values of. What is the meaning of the filter parameters ? - 6 Image source: dpscommoncoremath 1. wikispaces. com
Filter analysis & implementation in Matlab • Exercise 3. 4: FIR filter analysis & implementation - - - Download the WAV file Ex 3_4. wav and read it into Matlab. This file contains the impulse response of an FIR filter. Apply a (pre-recorded) speech signal as the input to this filter and listen to the resulting output signal. What is the effect of this FIR filter? Any idea what this filter represents? Calculate and plot the impulse response. Calculate and plot the frequency response (magnitude and phase). Provide a physical interpretation of both responses. Do not draw the pole-zero plot! Your system will run out of memory. Why? 7
Filter analysis & implementation in Matlab • Exercise 3. 5: Filter coefficient quantization - - When implementing digital filters in a fixed-point DSP, the filter coefficients will be quantized. Simulate the filter coefficients quantization for the filters in Exercises 3. 1– 3. 3 by scaling & rounding. Do this for 16 -bit and 8 -bit quantization. Compare the frequency response and the pole-zero plot of the original (unquantized) filters and the 16 -bit and 8 -bit quantized filters. What can you conclude? 8
- Slides: 8