Digital Elevation Model Based Watershed and Stream Network

Digital Elevation Model Based Watershed and Stream Network Delineation n Conceptual Basis n Eight direction pour point model (D 8) n Flow accumulation n Pit removal and DEM reconditioning n Stream network delineation n Catchment and watershed delineation n Topographic texture and drainage density n n n Channel network geomorphology and Horton’s Laws Stream drop test to objectively select channel delineation threshold Generalized methods for stream network delineation (Curvature, Slope-area, Grid order)

Duality between Terrain and Drainage Network • Flowing water erodes landscape and carries away sediment sculpting the topography • Topography defines drainage direction on the landscape and resultant runoff and streamflow accumulation processes

Study Area in West Austin with a USGS 30 m DEM from a 1: 24, 000 scale map Watershed Delineation by Hand Digitizing Watershed divide Drainage direction Arc. Hydro Page 57 Outlet

DEM Elevations 720 Contours 740 720 700 680

Hydrologic Slope - Direction of Steepest Descent 30 30 80 74 63 69 67 56 60 52 48 Slope: Arc. Hydro Page 70

Eight Direction Pour Point Model 32 64 1 16 8 128 4 2 ESRI Direction encoding Arc. Hydro Page 69

32 Flow Direction Grid 1 16 8 Arc. Hydro Page 71 64 128 4 2 2 2 4 4 8 1 2 4 8 4 128 1 2 4 8 2 1 4 4 4 1 1 1 2 16

Flow Direction Grid 32 64 128 16 8 1 4 2

Grid Network Arc. Hydro Page 71

Flow Accumulation Grid. Area draining in to a grid cell 0 0 3 0 0 0 0 2 0 0 3 2 2 0 0 11 0 0 0 1 15 0 0 2 5 24 1 0 2 11 1 2 5 15 24 1 Link to Grid calculator Arc. Hydro Page 72

Contributing Area Grid 1 1 1 1 4 3 3 1 1 12 1 1 2 16 1 1 1 3 6 25 2 1 1 4 1 3 12 2 1 3 1 1 2 16 6 25 1 2 Tau. DEM convention. The area draining each grid cell including the grid cell itself.

Flow Accumulation > 5 Cell Threshold 0 0 0 3 2 2 0 0 0 11 0 0 1 15 0 0 2 5 24 1

Stream Network for 5 cell Threshold Drainage Area 0 0 3 0 0 0 2 0 0 0 11 1 0 2 1 0 15 5 24 1
")
Streams with 200 cell Threshold (>18 hectares or 13. 5 acres drainage area)

Watershed Outlet

Watershed Draining to This Outlet

Watershed and Drainage Paths Delineated from 30 m DEM Automated method is more consistent than hand delineation

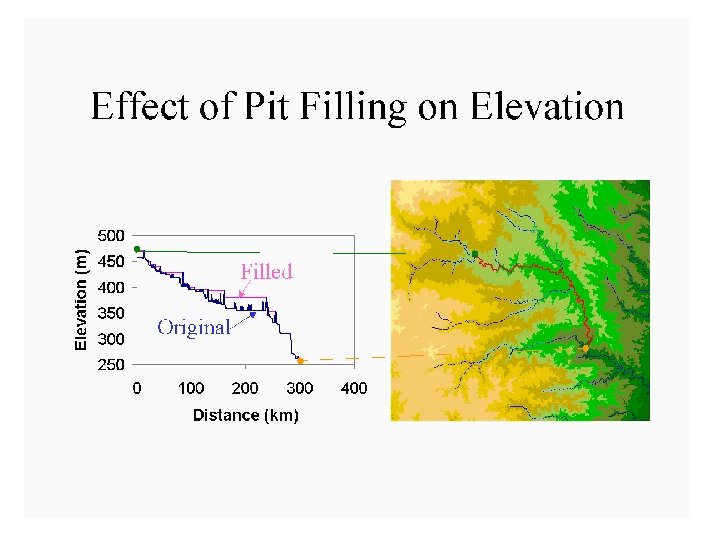
The Pit Removal Problem • DEM creation results in artificial pits in the landscape • A pit is a set of one or more cells which has no downstream cells around it • Unless these pits are removed they become sinks and isolate portions of the watershed • Pit removal is first thing done with a DEM

Pit Filling Increase elevation to the pour point elevation until the pit drains to a neighbor

Carving Lower elevation of neighbor along a predefined drainage path until the pit drains to the outlet point

Filling Carving Minimizing Alterations

“Burning In” the Streams Take a mapped stream network and a DEM Make a grid of the streams Raise the off-stream DEM cells by an arbitrary elevation increment Produces "burned in" DEM streams = mapped streams + =

AGREE Elevation Grid Modification Methodology

Stream Segments 0 0 3 0 0 0 2 0 0 0 11 1 0 2 1 0 15 5 24 1

Stream Links in a Cell Network 1 1 1 2 3 4 4 4 Arc. Hydro Page 74 2 3 4 4 3 5 5 6 6 6 5 5

Stream links grid for the San Marcos subbasin 201 172 203 206 204 Arc. Hydro Page 74 209 Each link has a unique identifying number

Vectorized Streams Linked Using Grid Code to Cell Equivalents Vector Streams Grid Streams Arc. Hydro Page 75

Drainage. Lines are drawn through the centers of cells on the stream links. Drainage. Points are located at the centers of the outlet cells of the catchments Arc. Hydro Page 75

Catchments for Stream Links Same Cell Value

Raster Zones and Vector Polygons One to one connection DEM Grid. Code Catchment Grid. ID 4 3 5 Raster Zones Vector Polygons

Catchments • For every stream segment, there is a corresponding catchment • Catchments are a tessellation of the landscape through a set of physical rules

Catchments, Drainage. Lines and Drainage. Points of the San Marcos basin Arc. Hydro Page 75

Adjoint catchment: the remaining upstream area draining to a catchment outlet. Arc. Hydro Page 77

Catchment, Watershed, Subwatersheds Catchments Watershed outlet points may lie within the interior of a catchment, e. g. at a USGS stream-gaging site. Arc. Hydro Page 76
![Summary of Key Processing Steps • • [DEM Reconditioning] Pit Removal (Fill Sinks) Flow](http://slidetodoc.com/presentation_image/3a9b965cd09e437111e1001c783ca412/image-36.jpg "Summary of Key Processing Steps • • [DEM Reconditioning] Pit Removal (Fill Sinks) Flow")
Summary of Key Processing Steps • • [DEM Reconditioning] Pit Removal (Fill Sinks) Flow Direction Flow Accumulation Stream Definition Stream Segmentation Catchment Grid Delineation Raster to Vector Conversion (Catchment Polygon, Drainage Line, Catchment Outlet Points)

Hydrologic processes are different on hillslopes and in channels. It is important to recognize this and account for this in models. Drainage area can be concentrated or dispersed (specific catchment area) representing concentrated or dispersed flow.

Delineation of Channel Networks and Subwatersheds 500 cell theshold 1000 cell theshold

100 grid cell constant support area threshold stream delineation

200 grid cell constant support area based stream delineation

How to decide on support area threshold ? AREA 2 3 AREA 1 12 Why is it important?

Examples of differently textured topography Badlands in Death Valley. from Easterbrook, 1993, p 140. Coos Bay, Oregon Coast Ra from W. E. Dietrich

Logged Pacific Redwood Forest near Humboldt, California

Canyon Creek, Trinity Alps, Northern California. Photo D K Hagans

Gently Sloping Convex Landscape From W. E. Dietrich

Mancos Shale badlands, Utah. From Howard, 1994.

Topographic Texture and Drainage Density Driftwood, PA Same scale, 20 m contour interval Sunland, CA

“landscape dissection into distinct valleys is limited by a threshold of channelization that sets a finite scale to the landscape. ” (Montgomery and Dietrich, 1992, Science, vol. 255 p. 826. ) Suggestion: One contributing area threshold does not fit all watersheds. Lets look at some geomorphology. • Drainage Density • Horton’s Laws • Slope – Area scaling • Stream Drops

Drainage Density • Dd = L/A • Hillslope length 1/2 Dd B B Hillslope length = B L A = 2 B L Dd = L/A = 1/2 B B= 1/2 Dd

Drainage Density for Different Support Area Thresholds EPA Reach Files 100 grid cell threshold 1000 grid cell threshold

Drainage Density Versus Contributing Area Threshold

Hortons Laws: Strahler system for stream ordering 1 1 2 2 1 3 1 1 2 1 1 1 1

Bifurcation Ratio

Area Ratio

Length Ratio

Slope Ratio

Slope-Area scaling Data from Reynolds Creek 30 m DEM, 50 grid cell threshold, points, individual links, big dots, bins of size 100
, \"Quantitative analysis of longitudinal stream")
Constant Stream Drops Law Broscoe, A. J. , (1959), "Quantitative analysis of longitudinal stream profiles of small watersheds, " Office of Naval Research, Project NR 389 -042, Technical Report No. 18, Department of Geology, Columbia University, New York.

Stream Drop Elevation difference between ends of stream Nodes Links Single Stream Note that a “Strahler stream” comprises a sequence of links (reaches or segments) of the same order

Suggestion: Map channel networks from the DEM at the finest resolution consistent with observed channel network geomorphology ‘laws’. • Look for statistically significant break in constant stream drop property • Break in slope versus contributing area relationship • Physical basis in the form instability theory of Smith and Bretherton (1972), see Tarboton et al. 1992

Statistical Analysis of Stream Drops

T-Test for Difference in Mean Values 0 72 130 T-test checks whether difference in means is large (> 2) when compared to the spread of the data around the mean values

Constant Support Area Threshold

200 grid cell constant support area based stream delineation
 43")
Local Curvature Computation (Peuker and Douglas, 1975, Comput. Graphics Image Proc. 4: 375) 43 48 48 51 51 56 41 47 47 54 54 58

Contributing area of upwards curved grid cells only

Upward Curved Contributing Area Threshold

Curvature based stream delineation

Channel network delineation, other options 4 2 3 5 6 1 7 8 Contributing Area Grid Order 1 1 1 4 3 3 1 1 2 2 2 1 12 1 1 3 1 1 2 16 1 1 3 6 25 2 1 2 2 3 1

Grid network pruned to order 4 stream delineation
.")
Slope area threshold (Montgomery and Dietrich, 1992).

Summary Concepts • The eight direction pour point model approximates the surface flow using eight discrete grid directions • The elevation surface represented by a grid digital elevation model is used to derive surfaces representing other hydrologic variables of interest such as – – Slope Flow direction Drainage area Catchments, watersheds and channel networks
 • Hydrologic processes are different between hillslopes and channels • Drainage")
Summary Concepts (2) • Hydrologic processes are different between hillslopes and channels • Drainage density defines the average spacing between streams and the representative length of hillslopes • The constant drop property provides a basis for selecting channel delineation criteria to preserve the natural drainage density of the topography • Generalized channel delineation criteria can represent spatial variability in the topographic texture and drainage density

Are there any questions ? AREA 2 3 AREA 1 12
- Slides: 74