Digital Elevation Model Based Watershed and Stream Network

Digital Elevation Model Based Watershed and Stream Network Delineation Reading https: //pro. arcgis. com/en/pro-app/tool-reference/spatial-analyst/an-overview-of-the-hydrology-tools. htm How to use Understanding

Topography defines watersheds which are fundamentally the most basic hydrologic landscape elements.

Learning Objectives To be able to delineate watersheds as the basic hydrologic model elements from Digital Elevation Models using Geographic Information Systems tools and to use this information in Hydrologic Analyses • Explain the basic concepts involved in the terrain flow information model • Identify and fill sinks in a small digital elevation model • Calculate hydrologic slope in the direction of steepest descent and the eight direction pour point model flow direction • Calculate flow accumulation as the number of grid cells draining into a grid cell • Identify a stream network raster based on grid cells exceeding a flow accumulation threshold • Describe the sequence of steps involved in mapping stream networks, catchments and watersheds in preparation for learning how to actually do this in the next exercise

Outline n n n n DEM Pit removal Flow direction field derivation Flow Accumulation Channels and Watersheds Raster to Vector Connection Using vector stream information DEM Conditioning Hydrologic Terrain Analysis Software
 720 Contours 740 720 700")
The starting point: a grid digital elevation model (DEM) 720 Contours 740 720 700 680

The terrain flow information model for deriving channels, watersheds, and flow related terrain information. Raw DEM Flow Field Watersheds are the most basic hydrologic landscape elements Pit Removal (Filling) Channels, Watersheds, Flow Related Terrain Information

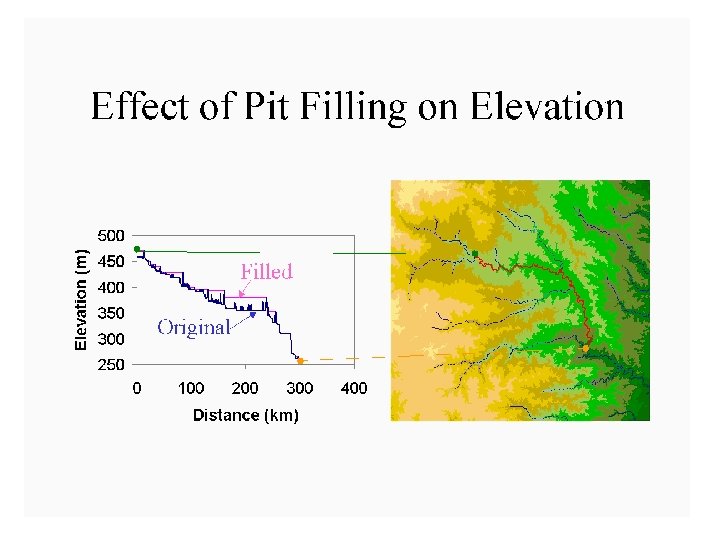
The Pit Removal Problem • DEM creation results in artificial pits in the landscape • A pit is a set of one or more cells which has no downstream cells around it • Unless these pits are removed they become sinks and isolate portions of the watershed • Pit removal is first thing done with a DEM

Pit Filling Increase elevation to the pour point elevation until the pit drains to a neighbor

Pit Filling Original DEM Pits Filled Pits Pour Points Grid cells or zones completely surrounded by higher terrain The lowest grid cell adjacent to a pit

D 8 Flow Direction Model - Direction of steepest descent 30 80 74 63 32 69 67 56 16 60 52 48 8 64 128 1 4 2 Slope = Drop/Distance Steepest down slope direction
 Flow Model 32 64 128 1 16 8 2 4")
Eight Direction (D 8) Flow Model 32 64 128 1 16 8 2 4 2 2 4 4 8 1 2 4 8 4 4 1 2 4 8 2 4 4 1 2 1 4 16

Flow Direction Grid 32 64 128 16 8 1 4 2

Grid Network

Flow Accumulation Grid. Area draining in to a grid cell 0 0 0 0 2 2 2 0 0 10 0 14 0 1 0 0 4 1 19 1 0 0 0 2 2 10 0 4 1 0 0 2 0 0 1 14 19 0 1

Stream Definition Flow Accumulation > 10 Cell Threshold Stream Network for 10 cell Threshold Drainage Area 0 0 0 0 2 2 2 0 0 10 0 14 0 1 0 0 4 1 19 1 0 0 0 2 2 10 0 4 1 0 0 2 0 0 1 14 19 0 1

Tau. DEM contributing area convention. 1 1 1 1 3 3 3 1 1 11 1 2 2 1 1 15 1 5 2 20 1 1 3 1 1 1 2 1 3 11 1 5 2 1 1 3 1 1 2 15 25 The area draining each grid cell includes the grid cell itself. 1 2

Arc. GIS and Tau. DEM flow direction encodings 32 64 16 8 4 Arc. GIS 128 4 1 5 2 6 3 2 1 7 Tau. DEM 8

Watershed Draining to Outlet • Watershed mapped as all grid cells that drain to an outlet • Streams mapped as grid cells with flow accumulation greater than a threshold

Watershed and Stream Grids • Watershed mapped as all grid cells that drain to an outlet • Streams mapped as grid cells with flow accumulation greater than a threshold

Stream Segments 201 172 203 206 204 Arc. Hydro Page 74 209 Each link has a unique identifying number Maidment, D. R. , ed. (2002), Arc Hydro GIS for Water Resources, ESRI Press, Redlands, CA, 203 p.

Vectorized Streams Linked Using Grid Code to Cell Equivalents Vector Streams Grid Streams Arc. Hydro Page 75

Drainage. Lines are drawn through the centers of cells on the stream links. Drainage. Points are located at the centers of the outlet cells of the catchments Arc. Hydro Page 75

Catchments • For every stream segment, there is a corresponding catchment • Catchments are a tessellation of the landscape through a set of physical rules

Raster Zones and Vector Polygons One to one connection DEM Grid. Code Catchment Grid. ID 4 3 5 Raster Zones Vector Polygons

Catchments, Drainage. Lines and Drainage. Points of the San Marcos basin Arc. Hydro Page 75

Catchment, Watershed, Subwatersheds Catchments Watershed outlet points may lie within the interior of a catchment, e. g. at a USGS stream-gaging site. Arc. Hydro Page 76

Using Vector Stream Information “Burning In” the Streams Take a mapped stream network and a DEM Make a grid of the streams Raise the off-stream DEM cells by an arbitrary elevation increment Produces "burned in" DEM streams = mapped streams + =

AGREE Elevation Grid Modification Methodology – DEM Reconditioning

Carving Lower elevation of neighbor along a predefined drainage path until the pit drains to the outlet point

Carving Original DEM Pits Carved DEM Carve outlets

Filling Carving Minimizing Alterations

Minimizing DEM Alterations Original DEM Optimally adjusted Carved Pits Filled
![Summary of Key Processing Steps • • [DEM Reconditioning] Pit Removal (Fill Sinks) Flow](http://slidetodoc.com/presentation_image_h2/bc52fb494acc405e380a80a3c6ebab87/image-34.jpg "Summary of Key Processing Steps • • [DEM Reconditioning] Pit Removal (Fill Sinks) Flow")
Summary of Key Processing Steps • • [DEM Reconditioning] Pit Removal (Fill Sinks) Flow Direction Flow Accumulation Stream Definition Stream Segmentation Catchment Grid Delineation Raster to Vector Conversion (Catchment Polygon, Drainage Line, Catchment Outlet Points)

Hydrologic Terrain Analysis Software • • Arc. GIS Online Hydro Arc. GIS Hydrology Tools Arc. Hydro Tau. DEM Cyber. GIS App [River. Tools] [GRASS]

Arc. GIS Pro Ready to Use Tools

Arc. GIS Hydrology Toolset

Arc. Hydro http: //resources. arcgis. com/en/communities/hydro/

Tau. DEM • Stream and watershed delineation • Multiple flow direction flow field • Calculation of flow based derivative surfaces • MPI Parallel Implementation for speed up and large problems • Open source platform independent C++ command line executables for each function • Deployed as an Arc. GIS Toolbox with python scripts that drive command line executables • CSDMS Cluster Implementation • Open Topography implementation • Cyber. GIS Implementation http: //hydrology. usu. edu/taudem/

Workflow to automatically generate stream network upstream of outlet

Catchments linked to Stream Network The starting point for catchment based distributed hydrologic modeling

Edge contamination arises when a contributing area value depends on grid cells outside of the domain. This occurs when drainage is inwards from the boundaries or areas with no data values. The algorithm recognizes this and reports "no data" resulting in streaks of "no data" values extending inwards from boundaries along flow paths that enter the domain at a boundary.

Tau. DEM in Cyber. GIS http: //gateway. cigi. illinois. edu/ Analysis submitted Analysis running Results data created Results Ready

Summary Concepts • The eight direction pour point model approximates the surface flow using eight discrete grid directions • The elevation surface represented by a grid digital elevation model is used to derive surfaces representing other hydrologic variables of interest such as – – Slope Flow direction Drainage area Catchments, watersheds and channel networks • Software as a service approach is moving functionality into the cloud
- Slides: 44