Digital Elevation Model Based Watershed and Stream Network

Digital Elevation Model Based Watershed and Stream Network Delineation Reading How to use Understanding http: //resources. arcgis. com/en/help/main/10. 2/index. html#//009 z 0000004 w 000000

Outline n n n n n Key Concepts from Exercise 3 Work the 2 nd half of Exercise 3 DEM Pit removal Flow direction field derivation Flow Accumulation Channels and Watersheds Raster to Vector Connection Using vector stream information (DEM reconditioning) Enhanced pit removal

Key Spatial Analysis Concepts from Exercise 3 • Contours and Hillshade to visualize topography

Zonal Average of Raster over Subwatershed Join

Subwatershed Precipitation by Thiessen Polygons • Intersect with Subwatersheds • Evaluate A*P Product • Summarize by subwatershed

What Is Involved? Add Field

Field Calculator to Multiply A and P
 for unique subwatersheds (by Hydro. ID)")
Summarize (Sum) for unique subwatersheds (by Hydro. ID)

Now use field calculator to take the ratio
 • Zonal Statistics (Mean) •")
Subwatershed Precipitation by Interpolation • Kriging (on Precip field) • Zonal Statistics (Mean) • Join • Export

Runoff Coefficients • Interpolated precip for each subwatershed • Convert to volume, P • Sum over upstream subwatersheds in Excel • Runoff volume, Q • Ratio of Q/P Watershed Hydro. ID's Plum Ck at Lockhart, TX 330 Blanco Rv nr Kyle, TX 331, 332 San Marcos Rv at Luling, TX 331, 332, 333, 336

The terrain flow information model for deriving channels, watersheds, and flow related terrain information. Raw DEM Flow Field Watersheds are the most basic hydrologic landscape elements Pit Removal (Filling) Channels, Watersheds, Flow Related Terrain Information

DEM Elevations 720 Contours 740 720 700 680

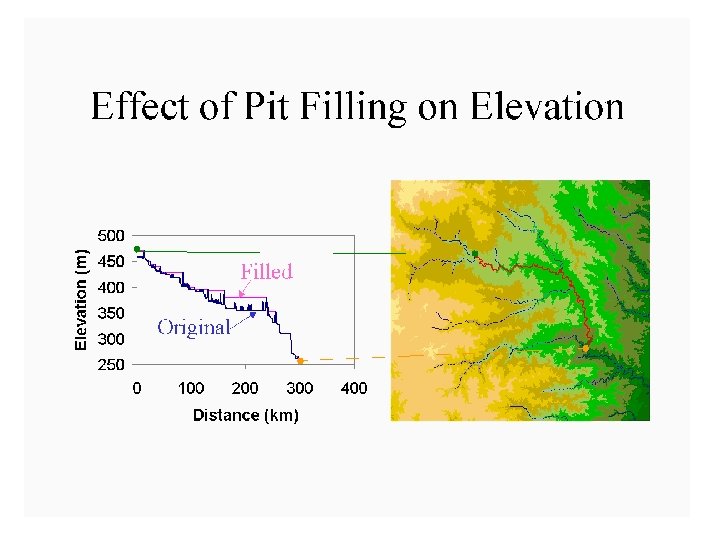
The Pit Removal Problem • DEM creation results in artificial pits in the landscape • A pit is a set of one or more cells which has no downstream cells around it • Unless these pits are removed they become sinks and isolate portions of the watershed • Pit removal is first thing done with a DEM

Pit Filling Increase elevation to the pour point elevation until the pit drains to a neighbor

Pit Filling Original DEM Pits Filled Pits Pour Points Grid cells or zones completely surrounded by higher terrain The lowest grid cell adjacent to a pit

Hydrologic Slope - Direction of Steepest Descent 30 Slope: 30 80 74 63 69 67 56 60 52 48
 Flow Model 32 64 128 1 16 8 2 4")
Eight Direction (D 8) Flow Model 32 64 128 1 16 8 2 4 2 2 4 4 8 1 2 4 8 4 4 1 2 4 8 2 4 4 1 2 1 4 16

Flow Direction Grid 32 64 128 16 8 1 4 2

Grid Network

Flow Accumulation Grid. Area draining in to a grid cell 0 0 0 0 2 2 2 0 0 10 0 14 0 1 0 0 4 1 19 1 0 0 0 2 2 10 0 4 1 0 0 2 0 0 1 14 19 0 1 Link to Grid calculator Arc. Hydro Page 72

Flow Accumulation > 10 Cell Threshold Stream Network for 10 cell Threshold Drainage Area 0 0 0 0 2 2 2 0 0 10 0 14 0 1 0 0 4 1 19 1 0 0 0 2 2 10 0 4 1 0 0 2 0 0 1 14 19 0 1

Tau. DEM contributing area convention. 1 1 1 1 3 3 3 1 1 11 1 2 2 1 1 15 1 5 2 20 1 1 3 1 1 1 2 1 3 11 1 5 2 1 1 3 1 1 2 15 25 The area draining each grid cell includes the grid cell itself. 1 2
")
Streams with 200 cell Threshold (>18 hectares or 13. 5 acres drainage area)

Watershed Draining to Outlet

Watershed and Drainage Paths Delineated from 30 m DEM Automated method is more consistent than hand delineation

Stream Segments 201 172 203 206 204 Arc. Hydro Page 74 209 Each link has a unique identifying number

Vectorized Streams Linked Using Grid Code to Cell Equivalents Vector Streams Grid Streams Arc. Hydro Page 75

Drainage. Lines are drawn through the centers of cells on the stream links. Drainage. Points are located at the centers of the outlet cells of the catchments Arc. Hydro Page 75

Catchments • For every stream segment, there is a corresponding catchment • Catchments are a tessellation of the landscape through a set of physical rules

Raster Zones and Vector Polygons One to one connection DEM Grid. Code Catchment Grid. ID 4 3 5 Raster Zones Vector Polygons

Catchments, Drainage. Lines and Drainage. Points of the San Marcos basin Arc. Hydro Page 75

Catchment, Watershed, Subwatersheds Catchments Watershed outlet points may lie within the interior of a catchment, e. g. at a USGS stream-gaging site. Arc. Hydro Page 76

“Burning In” the Streams Take a mapped stream network and a DEM Make a grid of the streams Raise the off-stream DEM cells by an arbitrary elevation increment Produces "burned in" DEM streams = mapped streams + =

AGREE Elevation Grid Modification Methodology – DEM Reconditioning

Carving Lower elevation of neighbor along a predefined drainage path until the pit drains to the outlet point

Carving Original DEM Pits Carved DEM Carve outlets

Filling Carving Minimizing Alterations

Minimizing DEM Alterations Original DEM Optimally adjusted Carved Pits Filled
![Summary of Key Processing Steps • • [DEM Reconditioning] Pit Removal (Fill Sinks) Flow](http://slidetodoc.com/presentation_image_h2/b995568b36c7fa9f5c9f923e3ac2781d/image-41.jpg "Summary of Key Processing Steps • • [DEM Reconditioning] Pit Removal (Fill Sinks) Flow")
Summary of Key Processing Steps • • [DEM Reconditioning] Pit Removal (Fill Sinks) Flow Direction Flow Accumulation Stream Definition Stream Segmentation Catchment Grid Delineation Raster to Vector Conversion (Catchment Polygon, Drainage Line, Catchment Outlet Points)

Summary Concepts • The eight direction pour point model approximates the surface flow using eight discrete grid directions • The elevation surface represented by a grid digital elevation model is used to derive surfaces representing other hydrologic variables of interest such as – – Slope Flow direction Drainage area Catchments, watersheds and channel networks

Are there any questions ? AREA 2 3 AREA 1 12
- Slides: 43