Digging a Little Deeper How to Use State


 Career and Technical")


")
 • Data Analysis • Needs Assessment • Targeted")


 Data Sources (CSFs) PBM Indicators")


 A-Z Index 2014 Accountability Performance-Based Monitoring")
 463 -5226 Email: PMIdivision@tea.")

- Slides: 59
Digging a Little Deeper How to Use State Accountability and PBMAS to Strengthen Program Effectiveness Texas Education Agency Heather Christie and Lizette Ramos Copyright © Texas Education Agency 2014. All rights reserved.
Who is here with us today?
Purpose A review of identification and interventions for both state accountability and the Performance Based Monitoring Analysis System (PBMAS). How to use information from both systems to conduct meaningful data analysis and needs assessment. How engaging in the TAIS continuous improvement process improves student performance and program effectiveness. Copyright © Texas Education Agency 2014. All rights reserved.
State Accountability Rating System 2014 Performance Indexes Non-AEA District and Campus Targets Index 1 -Student Achievement 55 30 Index 2 -Student* Growth D – 16; Elem – 33; MS - 28 N/A Index 3 -Closing Performance Gaps* D-28, Elem-28, MS-27, HS-31 11 Index 4 -Postsecondary Readiness All Components 57 STAAR All Only Components District 13 Elem 12 33 Middle 13 High School 21 * Set at or about 5 th percentile Graduation/ Drop-out 45
What is Performance-Based Monitoring? A district-level, data-driven monitoring system developed and implemented annually since 2004 Established to shift from process to results-based monitoring—program effectiveness and student performance Copyright © Texas Education Agency 2014. All rights reserved.
What is Performance-Based Monitoring? Bilingual Education/English as a Second Language (BE/ESL) Career and Technical Education (CTE) No Child Left Behind (NCLB) Copyright © Texas Education Agency 2014. All rights reserved. Special Education (SPED)
Guiding Principles of the PBMAS School District Effectiveness Statutory Requirements Indicator Design Maximum Inclusion Individual Program Accountability High Standards Annual Statewide Evaluation Public Input and Accessibility System Evolution Copyright © Texas Education Agency 2014. All rights reserved.
Accountability and PBMAS Correlations State Accountability System PBMAS Index 1 -Student Achievement System Safeguards STAAR 3 -8 Passing Rates EOC Passing Rates Index 3 -Closing Performance Gaps STAAR 3 -8 Passing Rates EOC Passing Rates Index 4 -Postsecondary Readiness Annual Dropout Rate RHSP/DAP Diploma Rate Graduation Rate Copyright © Texas Education Agency 2013. All rights reserved.
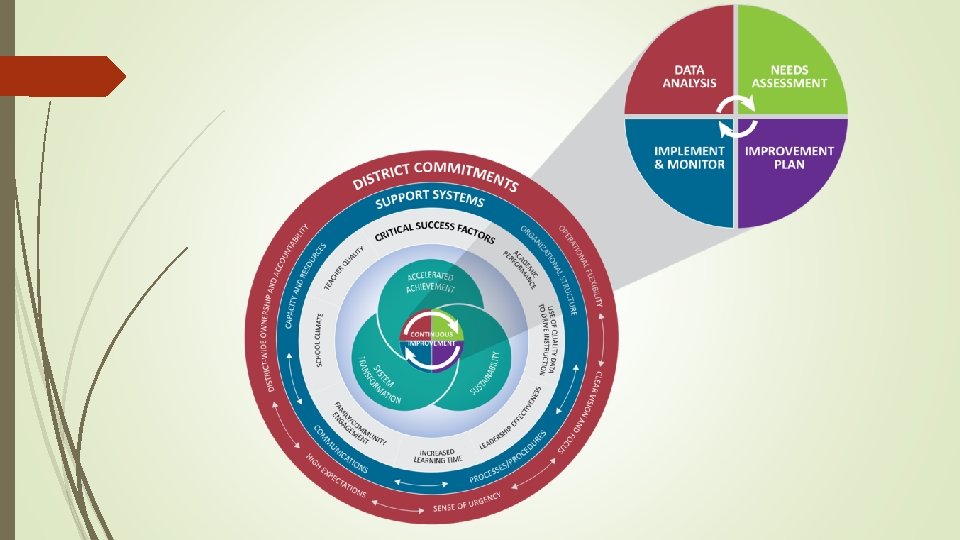
Data Process Reporting State Accountability • Districts • Campuses Performance-Based Monitoring Analysis System (PBMAS) • Districts Federal Requirements (ESEA Waiver) • Priority campuses Data Analysis Needs Assessment Implement & Monitor Improvement Plan Targeted Improvement Plan with Quarterly Progress Reports
The Texas Accountability Intervention System (TAIS) • Data Analysis • Needs Assessment • Targeted Improvement Plan • Implement and Monitor • Revise as indicated by new data Copyright © Texas Education Agency 2013. All rights reserved.
Example District PBMAS report has a performance level 3 on indicator 10 TELPAS composite rate over multiple years
TAIS Continuous Improvement Process Data Analysis Needs Assessment Implement & Monitor Improvement Plan
District Data Analysis General Questions INDEX 1 INDEX 2 INDEX 3 PBM Questions INDEX 4 RF Questions CSF Data Sources Identify Problem Statements Data Analysis
Closer Look – Index 1 Did your district meet standard for Index 1? Checkbox options Yes, with an Index score of 61 or higher. Yes, with an Index score between 55 -60 No What student groups are in greatest need of improvement in order to meet standard? Checkbox options System safeguard student groups
Closer Look – PBM Questions • Trends across programs • Indicators with performance level (PL 2 or 3) • Longitudinal reflection • Campus contributions Data Analysis
How do I know which campuses are contributing to the PBMAS report? Data Analysis Copyright © Texas Education Agency 2014. All rights reserved.
Data Analysis – Campus Contribution Review TELPAS composite scores for students who have 5 or more years in US schools Data Analysis Copyright © Texas Education Agency 2014. All rights reserved.
Are ELLs with 5 or more years in US schools scoring beginning or intermediate? Page 32 of 2014 PBMAS Manual Calculation number of LEP students in Grades 5 -12 in U. S. schools five or more years who received a TELPAS Composite Rating of Beginning or Intermediate number of LEP students in Grades 5 -12 in U. S. schools five or more years Data Analysis who received a TELPAS Composite Rating Copyright © Texas Education Agency 2014. All rights reserved.
Data Analysis – Campus Contribution Review TELPAS composite scores for students who have 5 or more years in US schools Compare campus data to PBMAS standards for that indicator Rank order campus performance What does the data tell you? Now, we have to dig a little deeper… Data Analysis Copyright © Texas Education Agency 2014. All rights reserved.
District Data Analysis General Questions INDEX 1 INDEX 2 INDEX 3 PBM Questions INDEX 4 RF Questions CSF Data Sources Identify Problem Statements Data Analysis
Closer Look – Support Systems and CSFs Data Analysis
Closer Look Support Systems Critical Success Factors Capacity and Resources Improve academic performance Quality data to drive instruction Communications Leadership effectiveness Increased learning time Processes and Procedures Family/community engagement School climate Organizational Structures Teacher quality
Data Analysis - Next Steps Conversations Observations Reviews Surveys Copyright © Texas Education Agency 2014. All rights reserved. Data Analysis
CSF Data Sources Data Analysis
District Data Analysis General Questions INDEX 1 INDEX 2 INDEX 3 PBM Questions INDEX 4 RF Questions CSF Data Sources Identify Problem Statements Data Analysis
Data Analysis – Develop Problem Statements What does the review of data tell me Not all campuses are implementing the designated program model. We have to digger a little deeper… Data Analysis Copyright © Texas Education Agency 2014. All rights reserved.
Closer Look – Problem Statements Problem Statement Missed Index(es) Data Sources (CSFs) PBM Indicators PL 2 or 3 Data Analysis
TAIS Continuous Improvement Process Data Analysis Needs Assessment Implement & Monitor Improvement Plan
Needs Assessment Tab Format Data Tab Problem Statements Root Cause 1 Root Cause 2 Root Cause 3 Root Cause 4 Root Cause 5 And so on…. . Answers the question WHY? Needs Assessment
Language Shift for Clarity Need Root Cause Needs Assessment
Needs Assessment Determine Root Causes All campuses are not implementing the designated program model You will have to dig a little deeper To determine true root causes Needs Assessment Copyright © Texas Education Agency 2014. All rights reserved.
Data Tab Campuses not implementing program model Needs Assessment WHY? • Inconsistent understanding of program model among teachers WHY? • Training take aways not being implemented WHY? • No follow-up or coaching • Not a focus in classroom walk-throughs WHY? • Principals not trained and no monitoring expectations set ROOT CAUSE
Needs Assessment – Narrowing the Focus District systems are not evident, but Some campuses are meeting the needs of ELLs better than others Digging Deeper…. . Needs Assessment Copyright © Texas Education Agency 2014. All rights reserved.
Needs Assessment – Narrowing the Focus What are those campuses doing? How can that be shared with other campuses? May become part of strategy/intervention Does it make sense to move those campuses of targeted practices intosection district systems/expectations? improvement plan Needs Assessment Copyright © Texas Education Agency 2014. All rights reserved.
Needs Assessment – Narrowing the Focus ü District systems in place ü Campus staff understand systems ü Campus staff are implementing the systems as designed ü Now what? ? ? Are our systems effective? You may have to dig a little deeper. Copyright © Texas Education Agency 2014. All rights reserved. Needs Assessment
TAIS Continuous Improvement Process Data Analysis Needs Assessment Implement & Monitor Improvement Plan
Questions to Consider Annual Goals Strategies Quarterly Goals Intervention s ü Do the annual goals address the areas of low performance? Are they linked to the problem statement? ü Do the strategies directly address the root causes? ü Do the quarterly goals ensure the implementation of the strategies and accomplish the annual goals? ü Do the interventions reflect specific actions that will be taken to achieve the quarterly goals? Copyright © Texas Education Agency 2014. All rights reserved. Improvement Plan
Not all campuses are implementing the designated program model 100% of campuses are fully implementing district program model by end of 2014 -2015 school year
Improvement Plan
Principals not trained and no expectations for walk-through monitoring Establish written district expectations for classroom walkthroughs to be incorporated into principal trainings
Quarterly Planning Goals and Interventions
100% Campuses Implementing Program Model Improvement Plan
25% 25% Improvement Plan Copyright © Texas Education Agency 2014. All rights reserved.
25% 25% Improvement Plan Copyright © Texas Education Agency 2014. All rights reserved.
Q 4 Q 3 Q 1 Q 2 Interventions Quarterly “To Do” List
Quarterly Goal Examples Q 1 - 100% of administrators with bilingual programs will conduct 1 walk-through with district support staff by October 15, 2014 to begin inter-rater reliability. Q 2 - Each campus with a BE program will conduct 10 walk-throughs each month with a 70% correct implementation rate by January 20, 2014.
Quarterly Goal Examples Q 3 - District program support specialist will complete observation and provide coaching for each classroom below a 60% correct implementation rate by March 15, 2014, in an effort to increase implementation to 75%. Q 4 - District program support specialists will meet with each campus principal of a bilingual program to share staff implementation survey results and TELPAS scores and will create a campus support plan for 15 -16 by June 15, 2014.
100% of administrators with bilingual programs will conduct 1 walk-through with district support staff by October 15, 2014 to begin inter-rater reliability. Survey principals and staff Create district protocols for BE program walk-throughs Train principals Principal completes at least 1 walk-through to promote inter-rater reliability Survey results indicating principal needs District expectations for BE program implementation walk-throughs Sign-in sheet, agenda, training materials Walkthrough results to review interrater reliability
TAIS Continuous Improvement Process Data Analysis Needs Assessment Implement & Monitor Improvement Plan
100% of administrators with bilingual programs will conduct 1 walk-through with district support staff by October 15, 2014 to begin inter-rater reliability. Survey principals and staff Create district protocols for BE program walkthroughs Train principals Principal completes at least 1 walk-through to promote inter-rater reliability Survey results indicating principal needs District expectations for implementation of BE program walk-throughs Sign-in sheet, agenda, training materials Walkthrough results to review inter-rater reliability
Today’s Key Take-Aways Use of multiple data sources Establish written systems Be proactive Commitment to continuous improvement Copyright © Texas Education Agency 2014. All rights reserved.
In the last two pages of your AIE Quick Reference booklet, write… HOW… will this session help you further YOUR school improvement?
Resources TEA website (www. tea. state. tx. us) A-Z Index 2014 Accountability Performance-Based Monitoring Texas Center for District and School Support (www. tcdss. net)
Contact Information Division of Program Monitoring and Interventions Phone: (512) 463 -5226 Email: PMIdivision@tea. state. tx. us Lizette Ramos lizette. ramos@tea. state. tx. us Heather Christie heather. christie@tea. state. tx. us Copyright © Texas Education Agency 2014. All rights reserved.
• • • Copyright © Notice The materials are copyrighted © and trademarked ™ as the property of the Texas Education Agency (TEA) and may not be reproduced without the express written permission of TEA, except under the following conditions: 1. Texas public school districts, charter schools, and Education Service Centers may reproduce and use copies of the Materials and Related Materials for the districts’ and schools’ educational use without obtaining permission from TEA. 2. Residents of the state of Texas may reproduce and use copies of the Materials and Related Materials for individual personal use only without obtaining written permission of TEA. 3. Any portion reproduced must be reproduced in its entirety and remain unedited, unaltered and unchanged in any way. 4. No monetary charge can be made for the reproduced materials or any document containing them; however, a reasonable charge to cover only the cost of reproduction and distribution may be charged. Private entities or persons located in Texas that are not Texas public school districts, Texas Education Service Centers, or Texas charter schools or any entity, whether public or private, educational or non-educational, located outside the state of Texas MUST obtain written approval from TEA and will be required to enter into a license agreement that may involve the payment of a licensing fee or a royalty. For information contact: Office of Copyrights, Trademarks, License Agreements, and Royalties, Texas Education Agency, 1701 N. Congress Ave. , Austin, TX 78701 -1494; phone 512 -463 -9270 or 512 -463 -9713; email: copyrights@tea. state. tx. us Copyright © Texas Education Agency 2014. All rights reserved.